Table of contents
- Main points
- Introduction
- Goods and contents of main residence
- Contents in property other than main residence
- Collectables and valuables
- Vehicles and number plates
- Total household physical wealth
- Household physical wealth by main household characteristics
- Household physical wealth by individual characteristics
- Background notes
1. Main points
Aggregate physical wealth for all households in Great Britain rose by £70 billion to £1,150 billion in current prices between July 2010 to June 2012 and July 2012 to June 2014, an increase of 7%
Mean household physical wealth stood at £45,000, similar to the level in July 2010 to June 2012 (£44,600)
More than three-quarters of aggregate physical wealth (78%) comprised household goods and contents in a household’s main residence
Just over 1 in 10 households (12%) owned collectables or valuables (such as antiques, artwork and stamps)
Personalised number plates were owned by 7% of households and had a total value of £2 billion
Households in the South East had the highest (£52,900) and households in the North East and Wales the lowest (£39,500) and (£39,600) mean value of physical wealth respectively
2. Introduction
This chapter looks at estimates of household physical wealth from the Wealth and Assets Survey (WAS). In WAS, physical wealth is derived from respondents’ own estimates of the value of the contents of their main residence, the contents of any property which the household owns other than the main residence and also collectables, valuables, vehicles and personalised number plates. The measure of physical wealth is based on the personal, private wealth of households. This means that it does not include business assets owned by household members.
Much of the analysis in this chapter is presented at the household level. This means that all physical assets held by individuals living within households have been added together to produce household totals. Some individual-level analyses are presented towards the end of the chapter, considering the distribution of individuals by age, education level, economic activity and socio-economic classification across the physical wealth bands of the household they live in.
Due to the complexity of the data, for example, the use of imputed values and complex weighting, only a very limited amount of high level significance testing has been undertaken, which is presented in the Technical chapter of this report (335.5 Kb Pdf). None of the estimates commented on in this chapter have been tested for significance.
Collection and presentation of data - goods and contents in main residence
The largest component of physical wealth is the value of households’ goods and contents in their main residence. The way respondents are asked to value these differs from other valuation methods used in WAS. Respondents find this hard to estimate precisely, so are asked to give ‘the approximate replacement value of household contents, which ‘is the approximate cost of replacing the items now, and may be similar to the insured value’. Respondents are asked to select 1 of 10 bands for the value of household goods starting with ‘less than £5,000’ and ending at ‘£200,000 or more’. In order to estimate a precise value for household goods and contents for each household, which can then be used to produce estimates of total physical wealth and total household wealth, the mid-point of each band is taken to be the actual value (for example, all households in the band £5,000 but less than £10,000 would be assigned a precise value of £7,500) with the open ended upper band ‘£200,000 or more’ band being valued at £300,000. Since this is the case, the preferred method is to present the mean for goods and contents instead of the median.
Other household goods and collectables, vehicles and personalised number plates
For all other physical assets respondents are first asked to estimate the value of the asset. If the respondent is unable to estimate a precise value, they are offered a choice of banded values. The precise values of these banded responses are later imputed, based on the distribution of the actual values obtained from other respondents. It is, therefore, statistically valid to consider median values using both actual and imputed data. For comparison purposes, the other goods and collectables estimates have been presented using banded values.
Back to table of contents3. Goods and contents of main residence
Household goods and contents consist of items found in the home such as furniture, clothing and electronic equipment. The questionnaire makes it clear that the value of household goods reported by respondents should not include collectables, valuables, bicycles or other vehicles. Unlike the other wealth components, every household has some physical assets.
Table 4.1 shows the mean1 value and distribution across the banded values of household goods and contents in main residences. The mean value of household goods in main residences was £34,900 in July 2012 to June 2014, the same value as that seen in July 2010 to June 2012, but up from £30,400 in July 2006 to June 2008.
It should be noted that, as for other estimates from WAS, the estimates in this table represent valuations at the time of interview and have not been adjusted to latest year prices. The increase seen since July 2006 to June 2008 is therefore likely to reflect respondents increasing the value of their goods to reflect inflation over the period, rather than or as well as added goods.
The distribution of households across the banded values of household goods and contents has not changed dramatically over the periods shown, with no real change at all between the latest 2 periods, though over the whole period shown there has, again, been a general increase in values given away from the lowest band (less than £5,000) towards the upper bands – again reflecting respondents' attitude that the replacement value of their goods would be greater.
For the period July 2012 to June 2014:
8% of households valued the goods and contents in their main residence in the lowest physical wealth band, that is, less than £5,000, compared with 11% in July 2006 to June 2008
53% of households valued the goods and contents in their main residence at £30,000 or less compared with 61% in July 2006 to June 2008
21% of households valued the goods and contents in their main residence at £50,000 or more compared with 15% in July 2006 to June 2008
2% of households valued the goods and contents in their main residence at £100,000 or more, the same as for other time periods shown
Table 4.1: Distribution of household goods in main residence, by banded values: Great Britain, July 2006 to June 2014
| Great Britain | ||||
| % | ||||
| July 2012 to June 2014 | July 2010 to June 2012 | July 2008 to June 2010 | July 2006 to June 20081 | |
| Mean (£) | 34,900 | 34,900 | 32,400 | 30,400 |
| Less than £5,000 | 8 | 7 | 9 | 11 |
| £5,000 but < £10,000 | 12 | 12 | 12 | 13 |
| £10,000 but < £20,000 | 17 | 17 | 17 | 19 |
| £20,000 but < £30,000 | 16 | 17 | 18 | 18 |
| £30,000 but < £40,000 | 14 | 14 | 15 | 14 |
| £40,000 but < £50,000 | 13 | 13 | 12 | 11 |
| £50,000 but < £75,000 | 14 | 14 | 12 | 10 |
| £75,000 but < £100,000 | 5 | 4 | 3 | 3 |
| £100,000 or more | 2 | 2 | 2 | 2 |
| All Households2 | 100 | 100 | 100 | 100 |
| Source: Wealth and Assets Survey, Office for National Statistics | ||||
| Notes: | ||||
| 1. July 2006 to June 2008 estimates are based on a half sample and multiplied by a factor of 1.76845. | ||||
| 2. Percentages may not sum due to rounding. | ||||
Download this table Table 4.1: Distribution of household goods in main residence, by banded values: Great Britain, July 2006 to June 2014
.xls (55.8 kB)Notes for goods and contents of main residence
- See Collection and presentation of data - goods and contents in main residence in the introduction to this chapter.
4. Contents in property other than main residence
Household goods may also be owned in property other than the main residence (for example, in second homes or buy-to-lets)1. Prior to July 2010, the value of goods in overseas properties was not collected; therefore estimates prior to this date are not included in this section.
In the period July 2012 to June 2014, the percentage of households declaring a value for goods in property other than their main residence was 7%. The value of these goods and contents and the distribution across the value bands, is given in Table 4.2. Due to the smaller numbers of households involved, some bands have been merged.
In July 2012 to June 2014, households who had goods in properties other than their main residence gave a mean value of £21,500 (similar to the figure in July 2010 to June 2012 which was £21,300).
Over a quarter of households (27%) with goods or contents in properties other than their main residence valued these at less than £5,000. 1 in 10 households (10%) with goods or contents in other property estimated the value of these at £50,000 or more.
Table 4.2: Distribution of household goods in properties other than main residence, by banded values
| Great Britain | ||
| % | ||
| July 2012 to June 2014 | July 2010 to June 2012 | |
| Mean Value (£) | 21,500 | 21,300 |
| Less than £5,000 | 27 | 27 |
| £5,000 but < £10,000 | 28 | 28 |
| £10,000 but < £20,000 | 19 | 17 |
| £20,000 but < £30,000 | 6 | 7 |
| £30,000 but < £50,000 | 11 | 11 |
| £50,000 or more | 10 | 10 |
| All Households2 | 100 | 100 |
| Source: Wealth and Assets Survey, Office for National Statistics | ||
| Notes: | ||
| 1. Results exclude households without other property, and without goods or contents within these. | ||
| 2. Percentages may not add up due to rounding. | ||
Download this table Table 4.2: Distribution of household goods in properties other than main residence, by banded values
.xls (55.8 kB)Notes for contents in property other than main residence
- See Other household goods and collectables, vehicles and personalised number plates in the introduction to this chapter.
5. Collectables and valuables
The survey asks households about collectables and valuables they own, such as antiques, artwork and stamps. Table 4.3 shows that the percentage of households owning this type of collectable has remained fairly consistent since July 2006. For the latest period of July 2012 to June 2014, 12% of all households owned collectables and valuables.
Table 4.3: Percentage of households with collectables or valuables
| Great Britain | ||||
| % | ||||
| July 2012 to June 2014 | July 2010 to June 2012 | July 2008 to June 2010 | July 2006 to June 20081 | |
| Percentage with collectables and valuables | 12 | 11 | 11 | 12 |
| Source: Wealth and Assets Survey, Office for National Statistics | ||||
| Notes: | ||||
| 1. July 2006 to June 2008 estimates are based on a half sample and multiplied by a factor of 1.76845. | ||||
Download this table Table 4.3: Percentage of households with collectables or valuables
.xls (54.8 kB)Table 4.4 gives the value and distribution of households with collectables and valuables, across the value bands. In July 2012 to June 2014, the mean value of collectable and valuables for households having these assets was £14,600, a little less than the previous 2 time periods where the mean was £15,500. In July 2012 to June 2014, just under half of households with collectables or valuables (49%), estimated these to be valued at less than £5,000 and over 1 in 20 households (6%) estimated their value to be enough to fall into the top band of £50,000 or more. The distribution has changed little over the survey periods shown.
Table 4.4: Distribution of household collectables and valuable
| Great Britain | ||||
| % | ||||
| July 2012 to June 2014 | July 2010 to June 2012 | July 2008 to June 2010 | July 2006 to June 20082 | |
| Mean Value (£) | 14,600 | 15,500 | 15,500 | 12,600 |
| Less than £5,000 | 49 | 51 | 51 | 50 |
| £5,000 but < £10,000 | 19 | 18 | 19 | 20 |
| £10,000 but < £25,000 | 18 | 18 | 19 | 19 |
| £25,000 but < £50,000 | 7 | 7 | 6 | 6 |
| £50,000 or more | 6 | 6 | 5 | 5 |
| All Households3 | 100 | 100 | 100 | 100 |
| Source: Wealth and Assets Survey, Office for National Statistics | ||||
| Notes: | ||||
| 1. Results exclude households without collectables or valuables. | ||||
| 2. July 2006 to June 2008 estimates are based on a half sample and multiplied by a factor of 1.76845. | ||||
| 3. Percentages may not add up due to rounding. | ||||
Download this table Table 4.4: Distribution of household collectables and valuable
.xls (55.8 kB)6. Vehicles and number plates
The survey asked households about ownership of vehicles including cars, vans and motorbikes and other vehicles1. Respondents are asked not to include leased vehicles and company vehicles, as these do not belong to the household. Thus, the figures in this chapter do not indicate how many households have the use of vehicles. Respondents here were asked first for a precise estimate of value and only offered bands if they could not give a precise estimate.
The percentage of households owning vehicles showed very little change since the period July 2010 to June 2012. In July 2012 to June 2014, over three-quarters of all households (78%) owned 1 or more vehicles (Table 4.5).
Table 4.5: Percentage of households owning vehicles and personalised number plates
| Great Britain | ||||
| % | ||||
| July 2012 to June 2014 | July 2010 to June 2012 | July 2008 to June 2010 | July 2006 to June 20082 | |
| Cars | 73 | 74 | 73 | 73 |
| Vans | 4 | 4 | 4 | 4 |
| Motorbikes | 4 | 4 | 4 | 4 |
| No car, van or motorbike | 26 | 25 | 26 | 27 |
| Other vehicles3 | 31 | 31 | 5 | 5 |
| Personalised plates | 7 | 7 | 6 | 5 |
| All Vehicles4 | 78 | 79 | 75 | 74 |
| Source: Wealth and Assets Survey, Office for National Statistics | ||||
| Notes: | ||||
| 1. Households might own more than one vehicle. | ||||
| 2. July 2006 to June 2008 estimates are based on a half sample and multiplied by a factor of 1.76845. | ||||
| 3. Changes to the questionnaire in the period July 2010 to June 2012 had an impact on the recording of other vehicles. | ||||
| 4. Includes personalised plates. | ||||
Download this table Table 4.5: Percentage of households owning vehicles and personalised number plates
.xls (56.3 kB)Half of all households with at least 1 vehicle estimated the combined value of all of their vehicles at £5,000 or more; a value which has remained constant across each of the periods of the survey (Table 4.6). The questionnaire change related to the recording of bicycles helps to explain the large fall in the median value of other vehicles.
Tables 4.5 and 4.6 also show results for ownership of personalised number plates. The percentage of households reporting ownership of a personalised number plate has risen slightly between the periods of the survey to 7% during July 2012 to June 2014. Half of all households who owned personalised number plates valued them at £500 or more, a median value which is unchanged across the periods of the survey.
Table 4.6: Vehicles and personalised number plates, summary statistics
| Great Britain | ||||
| £ | ||||
| July 2012 to June 2014 | July 2010 to June 2012 | July 2008 to June 2010 | July 2006 to June 20082 | |
| Cars, vans, motorbikes | 5,000 | 5,000 | 5,000 | 5,000 |
| Other vehicles3 | 200 | 200 | 2,300 | 3,000 |
| Personalised number plates | 500 | 500 | 500 | 500 |
| All vehicles4 | 5,000 | 5,000 | 5,000 | 5,000 |
| Source: Wealth and Assets Survey, Office for National Statistics | ||||
| Notes: | ||||
| 1. Results exclude households without this type physical asset. | ||||
| 2. July 2006 to June 2008 estimates are based on a half sample and multiplied by a factor of 1.76845. | ||||
| 3. Changes to the questionnaire at wave 3 had an impact on the recording of other vehicles. | ||||
| 4. Includes personalised number plates. | ||||
Download this table Table 4.6: Vehicles and personalised number plates, summary statistics
.xls (56.3 kB)Notes for vehicles and number plates
- Other vehicles: Households are first asked about any cars, vans or motorbikes that they own, after which they are asked about other vehicles they may own. For the first 2 survey periods of WAS - July 2006 to June 2010 - the question wording did not specifically mention bicycles – although it was later an option available in type of other vehicle. In July 2010 the question wording was changed and there was a marked increase in the reporting of bicycles as other vehicles. This lead to a step change in the percentage of households reporting other vehicles but had less effect on the overall value of other vehicles reported.
7. Total household physical wealth
Total household physical wealth is calculated as the sum of the values recorded for each household for contents of the main residence, contents of other property, collectables and valuables, vehicles and personalised number plates. Households may borrow money to buy things such as vehicles and contents. However, borrowing to finance such purchases will be covered when considering financial wealth. For these reasons, total physical wealth figures are only ever presented on a gross basis and do not consider liabilities.
Table 4.7 shows the mean for total physical wealth. The mean value of household physical wealth increased to £45,000 in July 2012 to June 2014 from £39,100 during July 2006 to June 2008.
Table 4.7: Total household gross physical wealth
| Great Britain | ||||
| £ | ||||
| July 2012 to June 2014 | July 2010 to June 2012 | July 2008 to June 2010 | July 2006 to June 20081 | |
| Mean household gross physical wealth | 45,000 | 44,600 | 41,100 | 39,100 |
| Source: Wealth and Assets Survey, Office for National Statistics | ||||
| Notes: | ||||
| 1. July 2006 to June 2008 estimates are based on a half sample and multiplied by a factor of 1.76845. | ||||
| 2. Only mean values are given. This is due to the way in which the data is collected. | ||||
Download this table Table 4.7: Total household gross physical wealth
.xls (55.3 kB)Table 4.8 gives the aggregate values for household physical wealth for all households in Great Britain (that is, the weighted sum of total physical wealth for every household). The aggregate value of total physical wealth was estimated to have increased by 6% to £1,150 billion between July 2010 to June 2012 and July 2012 to June 2014.
Table 4.8: Aggregate estimates of household gross physical wealth
| Great Britain | ||||
| £ billion | ||||
| July 2012 to June 2014 | July 2010 to June 2012 | July 2008 to June 2010 | July 2006 to June 20081 | |
| Aggregate household gross physical wealth | 1,150 | 1,080 | 1,016 | 961 |
| Source: Wealth and Assets Survey, Office for National Statistics | ||||
| Notes: | ||||
| 1. July 2006 to June 2008 estimates are based on a half sample and multiplied by a factor of 1.76845. | ||||
Download this table Table 4.8: Aggregate estimates of household gross physical wealth
.xls (54.8 kB)Figure 4.9 shows the breakdown of total household physical wealth into its 5 main components. During July 2012 to June 2014, the value of the contents in the main residence accounted for over three-quarters of the total (78%), while the value of vehicles made the second largest contribution (16%). This is very similar to the breakdown seen for July 2010 to June 2012.
The aggregate value of all personalised number plates was £2 billion in July 2012 to June 2014, which has remain unchanged over the survey periods.
Figure 4.9: Breakdown of aggregate household physical wealth
Great Britain, July 2012 to June 2014
Source: Wealth and Assets Survey - Office for National Statistics
Download this chart Figure 4.9: Breakdown of aggregate household physical wealth
Image .csv .xls8. Household physical wealth by main household characteristics
This section considers differences in total household physical wealth by total household net equivalised income, region of residence and household type.
Distribution of household net physical wealth by total household income
To have a true reflection of a household’s income a process of equivalisation has been performed. Household’s equivalised income is being used as this process adjusts income to compensate for both the size and composition of a given household. Performing this adjustment means that incomes of all households will be on a comparable basis.
Figure 4.10 shows the mean net physical wealth by the levels of household net equivalised income. Households in the lowest band of income had the lowest mean net physical wealth, while those households in the highest income band had the highest. During July 2012 to June 2014, households in the lowest income band had a mean physical wealth of £24,200, while for the highest income group that was over 3 times as big, £85,000.
Figure 4.10: Mean household physical wealth, by total household net equivalised income decile
Great Britain, July 2010 to June 2014
Source: Wealth and Assets Survey - Office for National Statistics
Download this chart Figure 4.10: Mean household physical wealth, by total household net equivalised income decile
Image .csv .xlsPhysical wealth by region
Figures 4.11a and 4.11b show mean household physical wealth according to the location of the main residence of the household. They show Scotland, Wales and the 9 English regions (with London shown separately; the figures for the South East exclude London).
The highest mean household physical wealth was observed for households in the South East, with a mean value of £52,900 during July 2012 to June 2014. The lowest mean values of physical wealth were for households in the North East and Wales (£39,500 and £39,600 respectively).
Figure 4.11a: Distribution of mean household physical wealth, by region of residence
Great Britain, July 2010 to June 2014
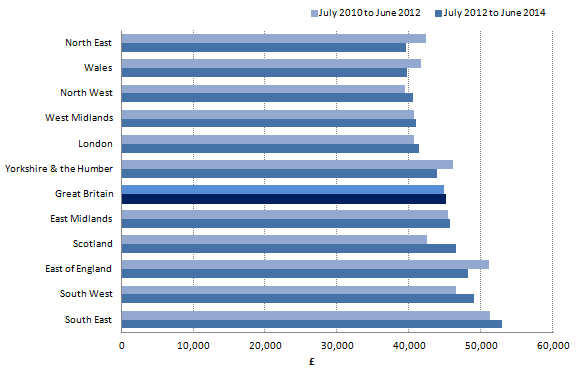
Source: Wealth and Assets Survey - Office for National Statistics
Download this image Figure 4.11a: Distribution of mean household physical wealth, by region of residence
.png (11.6 kB) .xls (19.5 kB)
Figure 4.11b: Mean household physical wealth: by region of residence
Great Britain, July 2012 to June 2014
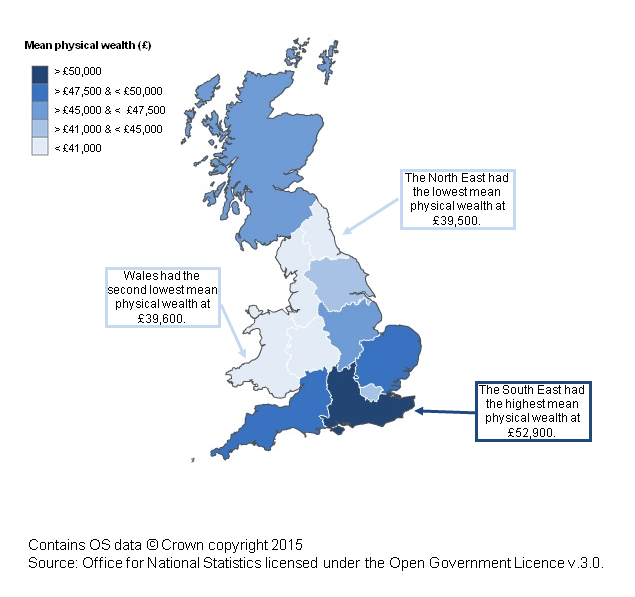
Source: Wealth and Assets Survey - Office for National Statistics
Download this image Figure 4.11b: Mean household physical wealth: by region of residence
.png (125.4 kB) .xls (19.5 kB)
Physical wealth by household type
Figure 4.12 shows household physical wealth according to the type of household. This is split into 10 categories of household types. Households comprising of couples with no children, where 1 person is over and the other under 60/651 had the highest household physical wealth, with a mean value of £66,900 in July 2012 to June 2014. Couple households with non-dependent children had the second highest mean average physical wealth (£61,100).
In July 2012 to June 2014, the lowest value of mean household physical wealth was seen for lone parent households with dependent children (£25,200). Single person households where the householder was under 60/65 had the second lowest mean average physical wealth (£25,800).
Mean physical wealth values were noticeably higher for couple households compared with single person households. Part of this can again be explained by the number of individuals living in the household. A couple household will contain more individuals who are able to accumulate wealth and increase physical asset holdings.
Figure 4.12: Mean household physical wealth, by household type
Great Britain, July 2010 to June 2014
Source: Wealth and Assets Survey - Office for National Statistics
Download this chart Figure 4.12: Mean household physical wealth, by household type
Image .csv .xlsNotes for household physical wealth by main household characteristics
- 60/65 – refers to women aged up to 60 and men aged up to 65.
9. Household physical wealth by individual characteristics
This section looks at some main characteristics of individuals living in households by physical wealth bands. It is important to remember that analysis presents individual characteristics by the total physical wealth of the household that the individual lives within. In certain instances it is possible that this wealth is more likely attributed to other individuals living within that household.
Sex and marital status
The percentage of married individuals living in households in the lowest physical wealth band in July 2012 to June 2014 was lower than any other marital status group (5% of both men and women lived in households with physical wealth less than £10,000 - Table 4.13). There are a number of reasons which might help to explain this. For instance, married individuals might be able to spend more on physical assets with their combined incomes than certain other marital status groups (for example, single individuals). Also, married individuals are, on average, older than individuals who are cohabiting or single (see Introduction and demographic chapter), thus allowing them to have accumulated more physical wealth over time. A higher percentage of separated individuals than any other marital status group lived in households in the lowest physical wealth band (32% of men and 27% of women). This could partly be explained through the transient nature of this marital status, whereby the physical contents may not yet have been split equally between the separated couple.
Married individuals were the most likely to live in households with physical wealth of £80,000 or more. Just under 1 in 5 married individuals lived in households with enough physical wealth to belong to the highest wealth band (19% for married men and 18% for married women). Individuals whose marital status was divorced were the least likely to live in households with physical wealth in the highest band (5% of men and 4% of women).
Table 4.13: Individuals by sex and marital status, by household physical wealth
| Great Britain | ||||||||
| % | ||||||||
| Less than £10,000 | £10,000 but < £20,000 | £20,000 but < £30,000 | £30,000 but < £40,000 | £40,000 but < £60,000 | £60,000 but < £80,000 | £80,000 or more | All Households | |
| Men | ||||||||
| Married2 | 5 | 10 | 12 | 13 | 23 | 19 | 19 | 100 |
| Cohabiting3 | 16 | 17 | 15 | 13 | 18 | 11 | 10 | 100 |
| Single4 | 17 | 17 | 13 | 12 | 16 | 13 | 11 | 100 |
| Widowed | 19 | 17 | 13 | 15 | 17 | 10 | 10 | 100 |
| Divorced | 30 | 21 | 14 | 11 | 13 | 6 | 5 | 100 |
| Separated5 | 32 | 19 | 13 | .. | 13 | .. | .. | 100 |
| All men | 13 | 14 | 13 | 13 | 19 | 15 | 14 | 100 |
| Women | ||||||||
| Married2 | 5 | 10 | 12 | 13 | 23 | 19 | 18 | 100 |
| Cohabiting3 | 16 | 17 | 14 | 14 | 18 | 11 | 10 | 100 |
| Single4 | 18 | 16 | 13 | 12 | 17 | 12 | 12 | 100 |
| Widowed | 14 | 18 | 16 | 14 | 16 | 13 | 8 | 100 |
| Divorced | 19 | 20 | 14 | 16 | 15 | 11 | 4 | 100 |
| Separated5 | 27 | 20 | 15 | 12 | 10 | 7 | 8 | 100 |
| All women | 13 | 14 | 13 | 13 | 19 | 15 | 13 | 100 |
| All Persons | 13 | 14 | 13 | 13 | 19 | 15 | 14 | 100 |
| Source: Wealth and Assets Survey, Office for National Statistics | ||||||||
| Notes: | ||||||||
| 1. Includes civil partnerships. | ||||||||
| 2. Includes same sex couples. | ||||||||
| 3. Includes persons of any age. | ||||||||
| 4. Includes civil partnership separations/dissolutions. | ||||||||
| 5. ".." - Estimates that have been suppressed due to fewer than 30 unweighted cases. | ||||||||
Download this table Table 4.13: Individuals by sex and marital status, by household physical wealth
.xls (57.3 kB)Age
The highest percentage of individuals living in households in the lowest physical wealth band was amongst the 16 to 24 year old age group (18% of such individuals lived in households with physical wealth less than £10,000) (Table 4.14). Younger people will have had less time to accumulate physical assets. Individuals aged 55 to 64 years were least likely to live in households with physical wealth in the lowest band.
Individuals aged between 55 to 64 years had the highest percentage living within households with physical wealth of £80,000 or more (19%). 15% of those aged 16 to 24 lived in households with total physical wealth of £80,000 or more (likely to still be living in the parental home), which fell to 7% for those aged 25 to 34 years (the age at which many move out from the parental home), who were least likely to live in households with the highest amounts of physical wealth.
Table 4.14: Individuals by age, by household physical wealth
| Great Britain | ||||||||
| % | ||||||||
| Less than £10,000 | £10,000 but < £20,000 | £20,000 but < £30,000 | £30,000 but < £40,000 | £40,000 but < £60,000 | £60,000 but < £80,000 | £80,000 or more | All Households | |
| Under 16 | 15 | 17 | 13 | 13 | 19 | 12 | 11 | 100 |
| 16-24 | 18 | 13 | 12 | 12 | 17 | 14 | 15 | 100 |
| 25-34 | 17 | 20 | 16 | 14 | 16 | 9 | 7 | 100 |
| 35-44 | 12 | 14 | 12 | 14 | 21 | 14 | 12 | 100 |
| 45-54 | 9 | 11 | 11 | 12 | 20 | 18 | 18 | 100 |
| 55-64 | 8 | 11 | 10 | 12 | 22 | 18 | 19 | 100 |
| 65+ | 10 | 12 | 14 | 12 | 20 | 17 | 15 | 100 |
| All Persons | 13 | 14 | 13 | 13 | 19 | 15 | 14 | 100 |
| Source: Wealth and Assets Survey, Office for National Statistics | ||||||||
Download this table Table 4.14: Individuals by age, by household physical wealth
.xls (55.3 kB)Education level
Table 4.15 shows the percentage of individuals living in households with different values of physical wealth by education level. The percentage of individuals educated at degree level or above living in households with physical wealth of £80,000 or more (the highest physical wealth band) was 21% – 14 percentage points higher than individuals reporting no educational qualifications.
Of individuals with degree level qualifications or above, 8% lived in households with physical wealth amounting to £10,000 or less. This compares with 22% of individuals reporting no qualifications.
Table 4.15: Individuals by education level, by household physical wealth
| Great Britain | ||||||||
| % | ||||||||
| Less than £10,000 | £10,000 but < £20,000 | £20,000 but < £30,000 | £30,000 but < £40,000 | £40,000 but < £60,000 | £60,000 but < £80,000 | £80,000 or more | All Households | |
| Degree Level or above | 8 | 11 | 10 | 12 | 22 | 17 | 21 | 100 |
| Other qualifications | 11 | 13 | 13 | 13 | 20 | 16 | 14 | 100 |
| No qualifications | 22 | 19 | 15 | 12 | 15 | 10 | 7 | 100 |
| All Persons1 | 12 | 14 | 13 | 13 | 19 | 15 | 14 | 100 |
| Source: Wealth and Assets Survey, Office for National Statistics | ||||||||
| Notes: | ||||||||
| 1. Includes only eligible adults who gave their education level. | ||||||||
Download this table Table 4.15: Individuals by education level, by household physical wealth
.xls (55.3 kB)Economic activity
Table 4.16 shows the percentage of individuals living in households with different values of physical wealth by economic activity. Over 1 in 5 of self-employed individuals (22%) lived in households with physical wealth of £80,000 or more. This is 7 percentage points higher than employees and 15 percentage points higher than unemployed individuals living in households within the highest band of physical wealth.
The percentage of individuals living in households within the lowest physical wealth band was highest for those who were economically inactive due to sickness or disability and for those who were unemployed (31%). Self-employed individuals were the least likely to live in households with physical wealth of less than £10,000 (7%).
Table 4.16: Individuals by economic activity, by household physical wealth
| Great Britain | |||||||||
| % | |||||||||
| Less than £10,000 | £10,000 but < £20,000 | £20,000 but < £30,000 | £30,000 but < £40,000 | £40,000 but < £60,000 | £60,000 but < £80,000 | £80,000 or more | All Households | ||
| Economically Active | |||||||||
| In Employment | 9 | 13 | 12 | 14 | 21 | 16 | 15 | 100 | |
| Employee | 9 | 13 | 13 | 14 | 21 | 16 | 15 | 100 | |
| Self Employed | 7 | 10 | 11 | 13 | 20 | 17 | 22 | 100 | |
| Unemployed | 30 | 19 | 13 | 10 | 11 | 10 | 7 | 100 | |
| Economically Inactive | |||||||||
| Student | 23 | 14 | 12 | 10 | 15 | 11 | 16 | 100 | |
| Looking after family/home | 25 | 19 | 13 | 11 | 14 | 8 | 10 | 100 | |
| Sick / disabled1 | 31 | 21 | 14 | 10 | 9 | 7 | 7 | 100 | |
| Retired | 10 | 12 | 13 | 12 | 20 | 18 | 15 | 100 | |
| Other Inactive | 19 | 16 | 12 | 14 | 15 | 13 | 12 | 100 | |
| All Persons | 13 | 14 | 13 | 13 | 19 | 15 | 14 | 100 | |
| Source: Wealth and Assets Survey, Office for National Statistics | |||||||||
| Notes: | |||||||||
| 1. Combined figure for temporarily sick / injured and long term sick and disabled. | |||||||||
Download this table Table 4.16: Individuals by economic activity, by household physical wealth
.xls (56.8 kB)Socio-economic Group
A quarter of individuals (25%) classified in the group ‘large employers and higher managerial’ lived in households with physical wealth of £80,000 or more (Table 4.17). Individuals working in semi routine occupations were the least likely to live in a household within the highest physical wealth band (7%).
The percentage of individuals living in households within the lowest physical wealth band was highest for those who were working in routine occupations (35%). Individuals working in the classifications ‘large employers and higher managerial’ and ‘higher professional’ were the least likely to live in households with physical wealth of less than £10,000 (4% and 6% respectively).
Table 4.17: Individuals by socio-economic classification, by household physical wealth
| Great Britain | ||||||||
| % | ||||||||
| Less than £10,000 | £10,000 but < £20,000 | £20,000 but < £30,000 | £30,000 but < £40,000 | £40,000 but < £60,000 | £60,000 but < £80,000 | £80,000 or more | All Households | |
| Large employers and higher managerial | 4 | 8 | 10 | 10 | 23 | 20 | 25 | 100 |
| Higher professional | 6 | 10 | 11 | 13 | 23 | 18 | 18 | 100 |
| Lower managerial and professional | 9 | 13 | 12 | 14 | 21 | 17 | 14 | 100 |
| Intermediate occupations | 9 | 12 | 11 | 13 | 20 | 16 | 18 | 100 |
| Small employers and own account workers | 12 | 14 | 14 | 13 | 20 | 16 | 11 | 100 |
| Lower supervisory and technical | 15 | 19 | 14 | 14 | 17 | 12 | 9 | 100 |
| Semi-routine occupations | 20 | 18 | 15 | 14 | 15 | 11 | 7 | 100 |
| Routine occupations | 35 | 17 | 14 | 8 | 10 | 8 | 9 | 100 |
| Never worked/long term unemployed | 17 | 15 | 13 | 11 | 18 | 14 | 13 | 100 |
| All Persons2 | 13 | 14 | 13 | 13 | 19 | 15 | 14 | 100 |
| Source: Wealth and Assets Survey, Office for National Statistics | ||||||||
| Notes: | ||||||||
| 1. Includes only adults who are 16 years old and above, not in full time education and gave sufficient information to determine socio-economic group. | ||||||||