Table of contents
1. Introduction
Wealth is an important component of the economic well-being of households, as a household's resources can be influenced by its stock of wealth. However, data on wealth is sparse and consequently measures of household income are often used as the sole gauge of economic well-being. The increase in home ownership, the move from traditional roles and working patterns, a higher proportion of the population now owning shares and contributing to investment schemes as well as the accumulation of wealth over the life cycle, particularly through pension participation, have all contributed to the changing composition of wealth. To understand the economic well-being of households it is increasingly necessary to look further than a simple measure of household income.
The Wealth and Assets Survey (WAS) is a longitudinal household survey, which aims to address gaps identified in data about the economic well-being of households by gathering information on, amongst other things, level of savings and debt, saving for retirement, how wealth is distributed across households and factors that affect financial planning.
Back to table of contents2. This report
This is the main report covering the fourth wave of the survey, the fieldwork period for which was July 2012 to June 2014. Over the 2-year period the WAS achieved a sample size of 20,247 private households.
The measure of household wealth is split into 4 components for this report: property, physical, financial, and private pension wealth. Chapter 2 brings together all 4 of these components of wealth while Chapters 3 to 6 look at the individual components.
Chapter 2: Total wealth – This chapter looks at the sum of net property wealth, net financial wealth, physical wealth and private pension wealth.
Chapter 3: Property wealth – This chapter looks at the value of any property privately owned in the UK or abroad (gross, and net of any liabilities on the properties).
Chapter 4: Physical wealth – This chapter looks at the value of contents of the main residence and any other property of a household including collectables and valuables (such as antiques or artworks), vehicles and personalised number plates.
Chapter 5: Financial wealth – This chapter starts by looking at the value of formal and informal financial assets held by adults, and of children’s assets. The chapter then looks at total gross financial wealth, financial liabilities and net financial wealth. Net financial wealth is calculated by subtracting from financial asset values the value of any financial liabilities.
Chapter 6: Private pension wealth – This chapter looks at the value of all pensions that are not state basic retirement or state earnings related. In addition, it considers the value of private pension schemes in which individuals had retained rights (in other words, from which they would receive an income in the future) or from which they were receiving an income (including pension income, based on a former spouse’s pension membership).
Chapter 7: Extended analyses – This chapter looks in a little more details at a few specific areas previously analysed on separate occasions for earlier periods of the survey: Wealth and Income; Wealth of the wealthiest; Debt Burden including personal well-being.
Chapter 8: Technical chapter – The remaining chapter provides a summary of technical information to assist users in interpreting and using the survey estimates. This includes; descriptions of the survey design and methodology; procedures used in the collection of data; derivation and quality of the estimates; and definitions and main concepts.
External quality assurance of WAS estimates
To assist with the interpretation of results derived from the WAS, where possible, attempts have been made to compare estimates with other sources. These ‘quality assurance’ reports have been included as annexes and accompany each of the component wealth chapters. Estimates have been compared against a variety of sources including other social surveys (for example, the Family Resources Survey), the census, HM Revenue and Customs data on Iindividual savings account (ISA) holdings and house purchase data from the Land Registry.
Measures of central tendency
As wealth is highly skewed towards the top – the survey was designed to pick up the very wealthy as well as the less wealthy. However, this does mean that the sample now contains some very wealthy outliers. All such cases are thoroughly checked – but they are included in the survey results. Given the skewed nature of wealth data, and the impact that outliers can have on parametric estimates, Wealth in Great Britain 2012 to 2014 does not generally report mean values, instead using the median values to report central tendency (with the exception of physical wealth estimates for which the median valued is meaningless).
The largest component of physical wealth is the value of households’ goods and contents in their main residence. The way respondents are asked to value these differs from other valuation methods used in WAS. Respondents find this hard to estimate precisely, so are asked to give ‘the approximate replacement value of household contents, which ‘is the approximate cost of replacing the items now, and may be similar to the insured value’. Respondents are asked to select one of 10 bands for the value of household goods starting with ‘less than £5,000’ and ending at ‘£200,000 or more’. In order to estimate a precise value for household goods and contents for each household, which can then be used to produce estimates of total physical wealth and total household wealth, the mid-point of each band is taken to be the actual value (for example, all households in the band £5,000 but less than £10,000 would be assigned a precise value of £7,500) with the open ended upper band ‘£200,000 or more’ band being valued at £300,000. Since this is the case, the preferred method is to present the mean for goods and contents instead of the median.
Equivalisation
Equivalisation is a standard methodology that adjusts measures to account for different demands on resources, by considering the household size and composition. For the first time net equivalised income is presented alongside wealth. However, measures of wealth have not been equivalised.
To calculate equivalised income each member of the household is given an equivalence value. The first adult is given a value of 0.67 while a 2nd adult gets a value of 0.33 to account for the use of joint amenities. For larger households, each additional person over 14 is given a smaller value of 0.33. Children under the age of 14 are given a value of 0.2 to take account of their lower living costs.
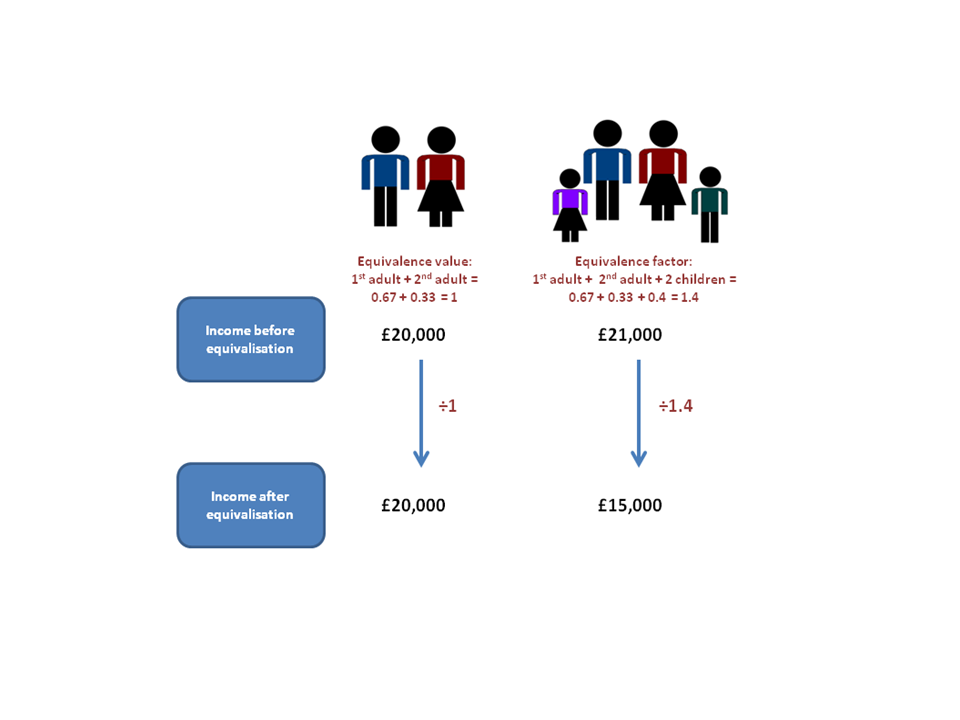
Equivalising wealth estimates is not as straight forward. For some purposes international guidelines recommend that total household wealth could be equivalised in the same way as income. But this is not recommended for the components of wealth. Therefore this report presents all figures on the same basis with no wealth equivalisation. More details can be found in the Chapter 8 – Technical chapter (335.5 Kb Pdf).
Accounting for inflation
All estimates within the Wealth in Great Britain 2012 to 2014 report are presented as current values (that is, the value at time of interview) and have not been adjusted for inflation. Like equivalisation, deflating wealth estimates is not as straight- forward as for other economic estimates. More details can be found in the Chapter 8 – Technical chapter (335.5 Kb Pdf).
Significance testing
Due to the complexity of the data, for example, the use of imputed values and complex weighting, only a very limited amount of high level significance testing has been undertaken, which is presented in the Technical chapter of this report (335.5 Kb Pdf). None of the estimates commented on in the following chapters have been tested for significance.
Definitions and conventions
Rounding and accuracy – Figures and percentages presented in the analytical text and tables of this report have been rounded and discrepancies may occur between sums of the component items and totals. This will also occur where variables allow more than one response to be reported. Published percentages were calculated prior to rounding and therefore discrepancies may also exist between these percentages and those that could be calculated from the rounded figures.
Billion – This represents one thousand million.
Trillion – This represents one million million.
Wave 1 half sample
A methodological decision at wave one (July 2006 to June 2008) of the WAS to reduce respondent burden resulted in a selection of questions, including components of physical wealth, to be asked only of a subset of households. This decision had implications for the estimation of aggregate total wealth. This subsequent ‘half sample’ was sufficiently large to produce robust results and does not affect the reliability of the wealth distributions at a household level. Estimates of total household wealth are therefore based upon data from this half-sample of 17,316 households. To estimate aggregate total wealth, the full sample has been used for property wealth, financial wealth and private pension wealth (to correspond with the estimates presented in the separate chapters). However, estimates of aggregate physical wealth are based on responses for the half sample (17,316 households) which have been adjusted using a ‘rating up factor’ in addition to our standard weighting procedures. For subsequent periods of the survey, each household were asked the full suite of questions on the components of net wealth. Consequentially later estimates of total household and aggregate total wealth are both based upon the full responding sample.
Back to table of contents3. Characteristics of the sample (demographics)
This section illustrates some summary characteristics of the households and household members responding during the period July 2012 to June 2014 of the Wealth and Assets Survey (WAS).
In total, 20,247 households across Great Britain were interviewed, encompassing 38,301 individuals aged 16 or over.
Households have been categorised by their equivalised income, region and household type. Individuals have been categorised by their region, age, sex and marital status, as well as employment status, education level and socio-economic classification.
Regional distribution of households and individuals
Table 1.2 shows the distribution of the WAS sample of individuals and households by region of residence, that is, the region of a households’ main residence. The achieved sample varied in terms of the percentage of respondents in the different regions, for example, 14% of the achieved sample lived in the South East compared with only 5% in the North East. The differences between regions will in part be a reflection of regional variations in response.
Table 1.2: The WAS sample, by region of residence
| Great Britain | ||||||
| Individuals | Households | |||||
| Sample Frequency | Sample Percentage (%) | Weighted Percentage (%) | Frequency | Percentage (%) | Weighted Percentage (%) | |
| North East | 2072 | 4 | 4 | 923 | 5 | 4 |
| North West | 5505 | 12 | 11 | 2383 | 12 | 11 |
| Yorkshire & Humber | 4438 | 9 | 9 | 1921 | 9 | 9 |
| East Midlands | 4119 | 9 | 7 | 1754 | 9 | 7 |
| West Midlands | 4068 | 9 | 9 | 1778 | 9 | 9 |
| East of England | 4793 | 10 | 9 | 2082 | 10 | 10 |
| London | 4318 | 9 | 13 | 1776 | 9 | 12 |
| South East | 6655 | 14 | 14 | 2866 | 14 | 14 |
| South West | 3987 | 9 | 9 | 1801 | 9 | 9 |
| England | 39955 | 86 | 86 | 17284 | 85 | 86 |
| Wales | 2443 | 5 | 5 | 1073 | 5 | 5 |
| Scotland | 4057 | 9 | 9 | 1890 | 9 | 9 |
| Great Britain | 46455 | 100 | 100 | 20247 | 100 | 100 |
| Source: Office for National Statistics | ||||||
| Notes: | ||||||
| 1. The region in which respondents main residence lies. | ||||||
Download this table Table 1.2: The WAS sample, by region of residence
.xls (27.6 kB)Household type
Table 1.3 shows the distribution of households by household type. Households were categorised into 1 of 10 household types according to the number of people living in the household, family type and ages of the respondents. The largest group were those households with married or cohabiting couples with dependent children (19%) and the smallest were those households with a lone parent and non-dependent children (3%). The percentage of households consisting of married or cohabiting couples with dependent children was more than 3 times greater than the proportion of households consisting of lone parent households with dependent children.
Table 1.3: The WAS sample, by household type
| Great Britain | ||||
| Households | ||||
| Sample Frequency | Sample Percentage (%) | Weighted Frequency | Weighted Percentage (%) | |
| Single person over SPA | 3,618 | 18 | 3,970,300 | 15 |
| Single person below SPA | 2,229 | 11 | 3,211,100 | 13 |
| Couple over SPA | 3,411 | 17 | 2,840,500 | 11 |
| Couple below SPA | 2,184 | 11 | 2,865,700 | 11 |
| Couple, one over one below SPA | 964 | 5 | 827,300 | 3 |
| Couple and dependent children | 3,833 | 19 | 5,771,700 | 23 |
| Couple and non-dependent children only | 1,286 | 6 | 2,102,900 | 8 |
| Lone parent and dependent children | 1,116 | 6 | 1,506,800 | 6 |
| Lone parent and non-dependent children only | 674 | 3 | 1,136,600 | 4 |
| More than 1 family, other household types | 932 | 5 | 1,382,200 | 5 |
| All Households | 20,247 | 100 | 25,615,200 | 100 |
| Source: Office for National Statistics | ||||
| Notes: | ||||
| 1. 60/65 refers to women up to the age of 60 and men up to the age of 65. | ||||
Download this table Table 1.3: The WAS sample, by household type
.xls (26.1 kB)Sex and marital status
Table 1.4 demonstrates the marital status and sex of individuals living in Great Britain based on the WAS sample. In the period July 2012 to June 2014, 45% of the sample were married. Over a tenth of the sample were widowed or divorced (11%).
Table 1.4: Individuals by gender and marital status
| Great Britain | |||||||||
| Sample Frequency | Sample Percentage (%) | Weighted Percentage (%) | |||||||
| Men | Women | All persons | Men | Women | All persons | Men | Women | All persons | |
| Married1 | 10489 | 10511 | 21000 | 23 | 23 | 45 | 20 | 21 | 41 |
| Cohabiting2 | 1802 | 1776 | 3578 | 4 | 4 | 8 | 4 | 4 | 8 |
| Single | 8393 | 7750 | 16143 | 18 | 17 | 35 | 21 | 18 | 39 |
| Widowed | 813 | 1848 | 2661 | 2 | 4 | 6 | 1 | 4 | 5 |
| Divorced | 871 | 1564 | 2435 | 2 | 3 | 5 | 2 | 3 | 5 |
| Separated3 | 260 | 378 | 638 | 1 | 1 | 1 | 1 | 1 | 1 |
| All Persons | 22628 | 23827 | 46455 | 49 | 51 | 100 | 49 | 51 | 100 |
| Source: Office for National Statistics | |||||||||
| Notes: | |||||||||
| 1. Includes civil partnerships. | |||||||||
| 2. Includes same sex couples. | |||||||||
| 3. Includes persons of any age. | |||||||||
Download this table Table 1.4: Individuals by gender and marital status
.xls (26.1 kB)Age
Table 1.5 represents the distribution of the sample by age. The largest group were individuals aged 65 and above (24%). Half of the sample were aged 45 years or older.
Table 1.5: Individuals by age
| Great Britain | |||
| Sample Frequency | Sample Percentage (%) | Weighted Percentage (%) | |
| Under 16 | 8,154 | 18 | 19 |
| 16-24 | 4,334 | 9 | 12 |
| 25-34 | 4,147 | 9 | 14 |
| 35-44 | 5,355 | 12 | 13 |
| 45-54 | 6,688 | 14 | 14 |
| 55-64 | 6,646 | 14 | 11 |
| 65+ | 11,131 | 24 | 17 |
| All Persons | 46,455 | 100 | 100 |
| Source: Wealth and Assets Survey, Office for National Statistics | |||
Download this table Table 1.5: Individuals by age
.xls (25.1 kB)By age and marital status
Table 1.6 represents the distribution of the sample by age and marital status.
Table 1.6: Individuals by age and marital status
| Great Britain | ||||||||||
| Individuals | ||||||||||
| Sample Frequency | 0 to 15 | 16 to 24 | 25 to 34 | 35 to 44 | 45 to 54 | 55 to 64 | 65 to 74 | 75 to 84 | 85 and over | Total |
| Married1 | 0 | 68 | 1,551 | 3,309 | 4,344 | 4,586 | 4,614 | 2,064 | 333 | 20,869 |
| Cohabiting2 | 0 | 268 | 1,027 | 809 | 792 | 463 | 247 | 55 | 6 | 3,667 |
| Single | 8,154 | 3,989 | 1,458 | 823 | 688 | 477 | 330 | 169 | 54 | 16,142 |
| Widowed | 0 | 1 | 1 | 23 | 84 | 266 | 681 | 1,090 | 515 | 2,661 |
| Divorced | 0 | 5 | 57 | 231 | 608 | 717 | 565 | 216 | 36 | 2,435 |
| Separated | 0 | 5 | 51 | 162 | 174 | 133 | 97 | 51 | 8 | 681 |
| Total | 8,154 | 4,336 | 4,145 | 5,357 | 6,690 | 6,642 | 6,534 | 3,645 | 952 | 46,455 |
| Sample Percentage (%) | 0 to 15 | 16 to 24 | 25 to 34 | 35 to 44 | 45 to 54 | 55 to 64 | 65 to 74 | 75 to 84 | 85 and over | Total |
| Married1 | 0 | 0 | 7 | 16 | 21 | 22 | 22 | 10 | 2 | 100 |
| Cohabiting2 | 0 | 7 | 28 | 22 | 21 | 12 | 7 | 2 | 0 | 100 |
| Single | 51 | 25 | 9 | 5 | 4 | 3 | 2 | 1 | 0 | 100 |
| Widowed | 0 | 0 | 0 | 1 | 3 | 10 | 26 | 41 | 19 | 100 |
| Divorced | 0 | 0 | 2 | 9 | 25 | 29 | 23 | 9 | 1 | 100 |
| Separated | 0 | 1 | 8 | 24 | 25 | 20 | 14 | 8 | 1 | 100 |
| Total | 18 | 9 | 9 | 12 | 14 | 14 | 14 | 8 | 2 | 100 |
| Weighted Percentage (%) | 0 to 15 | 16 to 24 | 25 to 34 | 35 to 44 | 45 to 54 | 55 to 64 | 65 to 74 | 75 to 84 | 85 and over | Total |
| Married1 | 0 | 0 | 13 | 20 | 22 | 19 | 16 | 8 | 1 | 100 |
| Cohabiting2 | 0 | 8 | 37 | 23 | 19 | 9 | 4 | 1 | 0 | 100 |
| Single | 47 | 27 | 12 | 5 | 4 | 2 | 1 | 1 | 0 | 100 |
| Widowed | 0 | 0 | 0 | 1 | 3 | 10 | 22 | 40 | 24 | 100 |
| Divorced | 0 | 0 | 3 | 11 | 27 | 28 | 20 | 9 | 1 | 100 |
| Separated | 0 | 1 | 10 | 27 | 27 | 16 | 11 | 6 | 1 | 100 |
| Total | 19 | 12 | 14 | 13 | 14 | 11 | 9 | 6 | 2 | 100 |
| Source: Office for National Statistics | ||||||||||
| Notes: | ||||||||||
| 1. Includes civil partnerships. | ||||||||||
| 2. Includes same sex couples. | ||||||||||
Download this table Table 1.6: Individuals by age and marital status
.xls (29.2 kB)Education level
The majority of eligible adults had qualifications that were below degree level (54%). More than a quarter (26%) of the sample had achieved degree level or above qualifications and 18% did not have any qualifications.
Table 1.7: Individuals by education level
| Great Britain, July 2012 to June 2014 | |||
| Individuals | |||
| Sample Frequency | Sample Percentage (%) | Weighted Percentage (%) | |
| Degree level or above | 9,458 | 26 | 25 |
| Other qualifications | 19,927 | 55 | 57 |
| No qualifications | 6,630 | 18 | 18 |
| All Persons | 36,015 | 100 | 100 |
| Source: Office for National Statistics | |||
| Notes: | |||
| 1. Includes only eligible adults who gave their education level. | |||
Download this table Table 1.7: Individuals by education level
.xls (25.1 kB)Economic status
Economic activity can be significant in determining individual and household wealth. Table 1.8 details the samples economic activity and demonstrates that more than half of all eligible adults are employed. Of these, 8% were self employed. Economic inactivity represents 43% of the sample and includes those respondents that are looking after the family or home, sick, disabled or retired. The majority of respondents that were economically inactive were retired (31%).
Table 1.8: Individuals by economic activity
| Great Britain | |||
| Sample Frequency | Sample Percentage (%) | Weighted Percentage (%) | |
| Economically Active | |||
| Employee | 17,028 | 46 | 52 |
| Self Employed | 2,830 | 8 | 7 |
| Unemployed | 1199 | 3 | 4 |
| Economically Inactive | |||
| Student | 708 | 2 | 2 |
| Looking after family/home | 1,433 | 4 | 4 |
| Sick/Disabled2 | 1,487 | 4 | 5 |
| Retired | 11617 | 31 | 23 |
| Other Inactive | 751 | 2 | 2 |
| All Persons | 37,054 | 100 | 100 |
| Source: Office for National Statistics | |||
| Notes: | |||
| 1. Includes only eligible adults who gave their economic activity. | |||
| 2. Data for temporarily sick or disabled has been combined with long term sick or disabled. | |||
Download this table Table 1.8: Individuals by economic activity
.xls (26.1 kB)Socio-economic group
For those individuals that were in work, the highest percentages were in the higher professionals’ classification (21%).
Table 1.9: Individuals by socio-economic classification
| Great Britain, July 2012 to June 2014 | |||
| Individuals | |||
| Sample Frequency | Sample Percentage (%) | Weighted Percentage (%) | |
| Large employers and higher managerial | 4,125 | 11 | 11 |
| Higher professional | 7,438 | 21 | 20 |
| Lower managerial and professional | 4,201 | 12 | 12 |
| Intermediate occupations | 2,710 | 8 | 7 |
| Small employers and own account workers | 1,940 | 5 | 6 |
| Lower supervisory and technical | 4,314 | 12 | 13 |
| Semi-routine occupations | 3,400 | 9 | 11 |
| Routine occupations | 1048 | 3 | 4 |
| Never worked/long term unemployed | 6,858 | 19 | 16 |
| All Persons | 36,034 | 100 | 100 |
| Source: Office for National Statistics | |||
| Notes: | |||
| 1. Includes only eligible adults who gave sufficient information to determine socio-economic group. | |||
| 2. Table 1.9 of the introduction and demographic chapter was loaded with the wrong data. This was amended at 12.00 18/12/2015. | |||