Table of contents
- Main points
- Things you need to know about this release
- Housing affordability worsening in England, but no significant change in Wales
- Housing affordability worsening at quicker rate in flats and newly-built properties
- Areas with higher house prices do not always have higher earnings
- House prices driving worsening affordability in the South East and East of England
- Housing affordability worsened the most in London over the last five years
- Links to related statistics
- Quality and methodology
1. Main points
On average, full-time workers could expect to pay around 7.8 times their annual workplace-based earnings on purchasing a home in England and Wales in 2017, a significant increase of 2.4% since 2016.
Workplace-based housing affordability significantly worsened in England between 2016 and 2017, but there were no significant changes in Wales.
In 2017, full-time employees in England and Wales could typically expect to spend 9.7 times their median gross annual earnings on purchasing a newly-built property and 7.6 times their annual earnings on an existing property.
Copeland, in the North West of England, was the most affordable local authority in England and Wales in 2017, with median house prices being 2.7 times median workplace-based annual earnings.
Kensington and Chelsea was the least affordable local authority in 2017, with median house prices being 40.7 times median workplace-based annual earnings.
Housing affordability has worsened significantly in 69 local authorities in England and Wales over the last five years, with over three-quarters of these being in London, the South East and the East.
2. Things you need to know about this release
Definitions and input data
Housing affordability is calculated by dividing house prices by annual earnings. House prices are taken from the House price statistics for small areas (HPSSAs) produced by the Office for National Statistics (ONS) and refer to the median and lower quartile price paid for residential properties in England and Wales.They are calculated using open data from HM Land Registry, a source of comprehensive record-level administrative data on residential property transactions. Earnings data are from the Annual Survey of Hours and Earnings (ASHE) and refer to median and lower quartile gross annual earnings for full-time employees for a given geographical area. Official statistics about overall household income are not available for all geographical areas presented in these statistics, so earnings data are used.
Our housing affordability statistics do not account for all income. This measure of affordability uses gross earnings of full-time employees, drawn from a sample of HM Revenue and Customs Pay As You Earn (PAYE) records. This means that income recorded through Self Assessment (including income received from self-employment, property rental and investments) and earnings from part-time workers are not included in our measures.
The house price data used in the affordability ratios in this release are based on the HPSSA data published in April 2018. These statistics can be revised quarterly but the annual affordability ratio statistics in this release will not be revised to reflect this each quarter. Instead the entire back series of these affordability ratio statistics will be revised annually, as part of each new release.
Workplace-based and residence-based earnings
There are two housing affordability datasets available, each with a different basis on how earnings are recorded: workplace-based and residence-based. Workplace-based earnings refer to the earnings recorded for the area in which the employee works, whereas the residence-based earnings refer to the area in which the employee lives. All earnings in both datasets refer to gross full-time annual earnings where possible, but annualised weekly earnings are used when annual earnings are not available from ASHE but weekly earnings are. The analysis in this statistical bulletin uses earnings data based on the place of work rather than the place of residence, unless otherwise stated. This measure of affordability indicates the extent to which employees can afford to live where they work, which is not necessarily where they already live. For a discussion on the effect of both workplace-based and residence-based earnings on housing affordability, see our Housing affordability in England and Wales: 2016 publication.
There is a longer time series of affordability ratios available from workplace-based earnings, for which data extends back to 1997, whereas residence-based earnings start at 2002. Annualised weekly earnings are not produced on an identical basis to annual earnings and are therefore not directly comparable. Annualised weekly earnings can be relatively unstable over time and across areas because some areas have a greater number of seasonal employees than others, which can affect the median earnings data at different points in the year. Therefore, care should be taken when comparing a housing affordability ratio derived from annual earnings against a ratio derived from annualised weekly earnings.
The earnings data from ASHE provides a snapshot of earnings at April in each year. The house price statistics from the HPSSAs report the price paid for residential property referring to a 12-month period with April in the middle (year ending September). The smallest areas for which statistics are presented are local authority districts, of which there are 348 in England and Wales. The largest area available is England and Wales overall. Other geographies for which statistics are published in this release are English regions, counties and Wales.
Measuring uncertainty
ASHE data are survey-based and therefore there is a degree of uncertainty in the earnings estimates because they are based on a sample of the population rather than the entire population. Sampling error is estimated through providing the coefficient of variation (CV) for each estimate, which is the ratio of standard error of an estimate to the estimate itself, expressed as a percentage. These can be accessed in the original ASHE datasets and can be used to assess the quality of each estimate. We have retained all estimates, even when the CV is between 10% to 20%, and so it is important to consider the margins of error around the earnings estimates used to derive these housing affordability statistics. There are no confidence intervals available with ASHE data, which is important to consider when making comparisons with earnings. We look at statistical differences over time by looking at the range of plus or minus twice the coefficient of variation around the estimate, as indicated in the ASHE datasets. The true value of earnings values are likely to lie within these values. We use these ranges to determine if an area’s affordability ratio has changed significantly.
Back to table of contents3. Housing affordability worsening in England, but no significant change in Wales
In 2017, full-time employees could typically expect to spend around 7.8 times their workplace-based annual earnings on purchasing a home in England and Wales. The affordability ratio1 increased from 7.6 in 2016, which is a significant increase of 2.4% between 2016 and 2017. This change was driven largely by the decreasing housing affordability in England, where the affordability ratio increased from house prices being 7.7 times annual earnings in 2016, to 7.9 times annual earnings in 2017, which is a significant increase of 2.5%. There were no significant changes in the ratio of median house prices to median annual earnings in Wales between 2016 and 2017. The latest year that the affordability ratio was significantly different from 2017 in Wales, is in 2007, therefore, affordability has only significantly changed over a 10-year period.
Figure 1 shows that in England, house price growth was greater than earnings growth between 2016 and 2017, and in Wales, earnings growth was greater than house price growth. These changes have led to housing becoming less affordable in England and more affordable in Wales. However, the change was not significant for Wales between 2016 and 2017.
Figure 1: Annual change in median house prices and median earnings
England and Wales, 2016 to 2017
Source: House Price Statistics for Small Areas and the Annual Survey of Hours and Earnings, Office for National Statistics
Notes:
- The coefficient of variation (CV) for earnings data taken from the Annual Survey of Hours and Earnings for England, were both classified as precise in England for 2016 and 2017, with the CV being 0.4% for both years.
- The CV for the earnings estimates for Wales in 2016 and 2017 were also classified as precise (2.1% and 2.2% respectively), but sampling error was slightly higher than for England.
- Median house price refers to the median price paid for residential property.
- Median earnings refers to the median workplace-based gross annual full-time earnings.
Download this chart Figure 1: Annual change in median house prices and median earnings
Image .csv .xlsFigure 2 is an interactive map that shows housing affordability ratios over time for each local authority district in England and Wales. It shows that affordability has worsened everywhere since 1997 in England and Wales to some extent, but has worsened at different rates in different areas. Housing affordability has generally worsened at a quicker rate in local authority districts in the south of England than affordability in the north of England and in Wales. Housing affordability has worsened the most in London over the last two decades. This has been driven largely by increasing house prices. Out of the 10 least affordable local authorities in England and Wales, seven were in London, whilst the 10 most affordable local authorities were in the North West, the West Midlands and Wales.
Figure 2: Housing affordability ratio by local authority district
England and Wales, 1997 to 2017
Embed code
Notes
Data for annual earnings are not available before 1999 and for some local authorities in some years. For these years the earnings relate to annualised weekly earnings. Annualised weekly earnings are not produced on an identical basis to annual earnings and so care should be taken when making comparisons. Refer to the dataset accompanying this release for information on which ratios are based on annualised weekly earnings.
Housing affordability ratio refers to the ratio of the median price paid for residential property to the median workplace-based gross annual full-time earnings.
Notes for: Housing affordability worsening in England, but improving in Wales
- In this section, the housing affordability ratios and earnings discussed are based on workplace-based earnings only.
4. Housing affordability worsening at quicker rate in flats and newly-built properties
In 2017, detached properties were the least affordable in both England and Wales, whereas terraced properties were the most affordable. Figure 3 shows the affordability ratios1 by property type and country and shows that housing was significantly2,3 less affordable in England than in Wales for all property types. It is important to note that this does not consider the relative condition of the property.
Figure 3: Housing affordability ratio, by property type and country
England and Wales, 2017
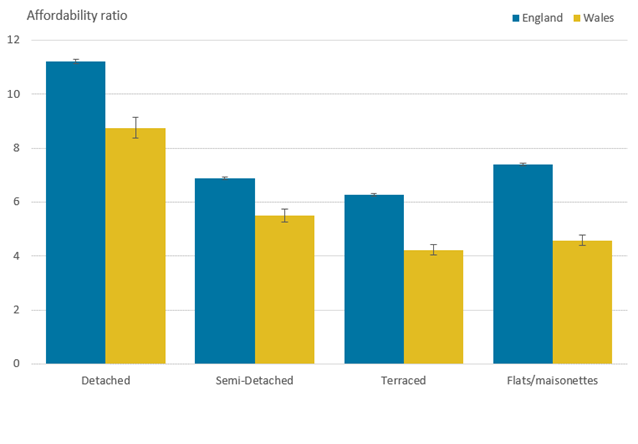
Source: House Price Statistics for Small Areas and the Annual Survey of Hours and Earnings, Office for National Statistics
Notes:
- Housing affordability ratio refers to the ratio of the median price paid for residential property to the median workplace-based gross annual full-time earnings.
Download this image Figure 3: Housing affordability ratio, by property type and country
.png (19.5 kB) .xlsx (27.3 kB)
Figure 4 shows the percentage change in the housing affordability ratio for each property type from 1997 to 2017 for England and Wales. The affordability ratio has more than doubled for every property type in England from 1997 to 2017, but that was not the case in Wales. Housing affordability for all property types has worsened at a quicker rate in England than in Wales.
Flats and maisonettes have had the largest change in affordability over time in both England and Wales, but the increase was larger in England (141.5%) than in Wales (85.8%). This is likely to reflect the influence of increasing prices for flats in London, which has driven the larger increase in England overall.
The affordability of terraced properties has seen the second-largest change in England, but has seen the smallest change in Wales. This is because the increase in the median price paid for terraced properties in Wales (201.4%) is smaller than the increase for terraced properties in England (283.1%), between 1997 and 2017.
Figure 4: Change in housing affordability ratio by property type
England and Wales, 1997 to 2017
Source: House Price Statistics for Small Areas and the Annual Survey of Hours and Earnings, Office for National Statistics
Notes:
- Data for annual earnings are not available before 1999. For these years the earnings relate to annualised weekly earnings. Annualised weekly earnings are not produced on an identical basis to annual earnings and so care should be taken when making comparisons.
- Housing affordability ratio refers to the ratio of the median price paid for residential property to the median workplace-based gross annual full-time earnings.
Download this chart Figure 4: Change in housing affordability ratio by property type
Image .csv .xlsIn 2017, full-time employees in England and Wales could expect to spend 9.7 times their median gross annual earnings on purchasing a newly-built dwelling. Purchasing an existing dwelling in England and Wales in 2017 was significantly more affordable, with house prices of existing dwellings being on average 7.6 times earnings.
Figure 5 shows that newly-built dwellings were less affordable than existing dwellings in every year except 2009 and 2010. This was around the time of the most recent economic downturn, during which the median price paid for both existing dwellings and newly-built dwellings decreased. The affordability of newly-built dwellings has worsened at a quicker rate than existing dwellings since 2011.
Figure 5: Housing affordability ratio for newly-built and existing dwellings
England and Wales, 1997 to 2017
Source: House Price Statistics for Small Areas and the Annual Survey of Hours and Earnings, Office for National Statistics
Notes:
- Data for annual earnings are not available before 1999. For these years the earnings relate to annualised weekly earnings. Annualised weekly earnings are not produced on an identical basis to annual earnings and so care should be taken when making comparisons.
- Housing affordability ratio refers to the ratio of the median price paid for residential property to the median workplace-based gross annual full-time earnings.
Download this chart Figure 5: Housing affordability ratio for newly-built and existing dwellings
Image .csv .xlsNotes for: Housing affordability worsening at quicker rate in flats and newly-built properties
In this section, the housing affordability ratios and earnings discussed are based on workplace-based earnings only.
We have calculated significant differences by applying plus or minus twice the coefficient variation (CV) of the earnings data, as the Annual Survey of Hours and Earnings confirms the true value is likely to lie within these limits. For example, for estimated earnings of £30,000 with a CV of 5%, we would expect the true population average to be within the range £27,000 to £33,000. We then divide the median house price by the lower and upper earnings limits to derive lower and upper limit affordability ratios.
Significant differences in the housing affordability ratio does not necessarily mean that there are significant differences in earnings, but instead the earnings in relation to house prices at a given time is significantly different.
5. Areas with higher house prices do not always have higher earnings
In 2017, Kensington and Chelsea was the least affordable area to buy a property in England and Wales, both when workplace-based and residence-based earnings were used. It had the highest ratio of median house price to median workplace-based gross annual earnings, with house prices being 40.7 times earnings. House prices in Kensington and Chelsea were 28.9 times residence-based earnings in 2017. Kensington and Chelsea had the highest median house price in 2017 of £1.3 million, but it was more affordable for residents of Kensington and Chelsea, who may not necessarily work there, rather than for employees in the borough who may not necessarily live there.
Copeland, in the North West of England, was the most affordable local authority in 2017, both when workplace-based and residence-based earnings were used. It had the lowest ratio of median house price to median workplace-based gross annual earnings, with house prices being 2.7 times earnings. House prices in Copeland were 3.0 times residence-based earnings in 2017, therefore, it was more affordable when workplace-based earnings were used to calculate the housing affordability ratio. This means that it was more affordable to purchase a property in Copeland if you worked there but may live elsewhere, in comparison with those who live in Copeland, but may not work there.
The least affordable local authority has seen increases in the ratio, therefore, affordability has worsened, whilst the most affordable local authority has improved. The housing affordability gap between the most and least affordable local authorities has continued to widen since 2015.
Although Copeland was the most affordable local authority in England and Wales, it does not mean that this local authority had the lowest house prices or the highest earnings; rather it has the highest earnings in relation to house prices. Figure 6 shows the correlation between the median price paid for residential property and median gross annual earnings1 for each local authority in England and Wales in 2017.
Figure 6: Median earnings and median house prices by local authority
England and Wales, 2017

Source: House Price Statistics for Small Areas and the Annual Survey of Hours and Earnings, Office for National Statistics
Notes:
- Data for annual earnings are not available before 1999 and for some local authorities in some years. For these years the earnings relate to annualised weekly earnings. Annualised weekly earnings are not produced on an identical basis to annual earnings and so care should be taken when making comparisons. Refer to the dataset accompanying this release for information on which ratios are based on annualised weekly earnings.
- The England and Wales median affordability ratio line is based on x= y*7.78, as 7.78 is the ratio of median house price to median annual earnings for England and Wales in 2017.
- Median house price refers to the median price paid for residential property.
- Median earnings refers to the median workplace-based gross annual full-time earnings.
Download this image Figure 6: Median earnings and median house prices by local authority
.png (74.9 kB) .xlsx (39.6 kB)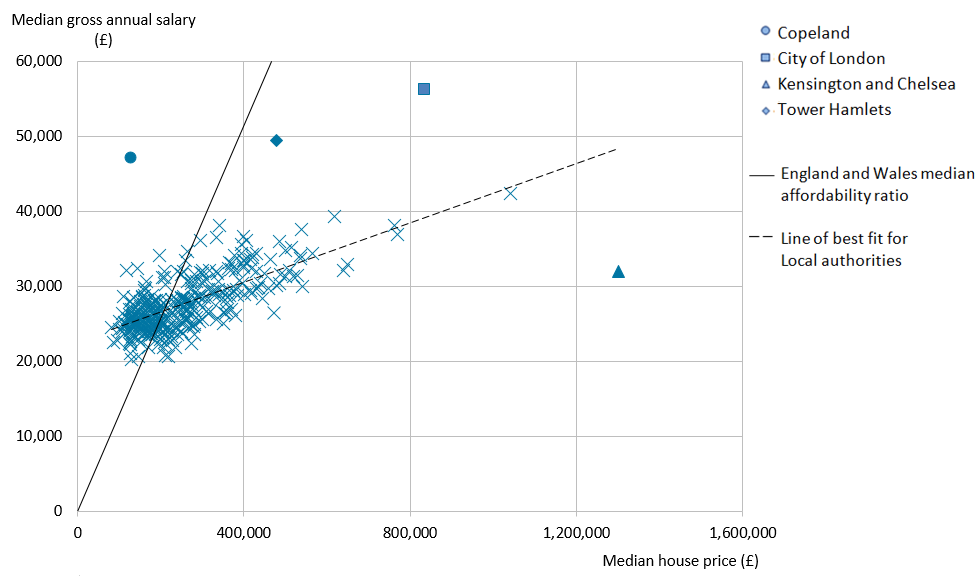
There is a positive correlation between the median price paid for residential property and the median gross annual salary. This means that generally, the higher the earnings of a local authority’s employees, the higher the house prices. However, not all local authorities follow this trend. Local authorities plotted above the England and Wales median affordability ratio line on Figure 6 can be considered relatively more affordable than the average for England and Wales, whilst those below this line can be seen as relatively less affordable.
Buying a house in Kensington and Chelsea was relatively less affordable in 2017 compared with all other local authorities. For those working in Kensington and Chelsea, the median gross annual salary was £31,950, whilst the median house price was £1.3 million. With median house prices being around 40 times the median gross annual earnings, it suggests that income from other sources in addition to employee earnings would contribute towards affording to live in these areas. However, homeowners in Kensington and Chelsea may work in other areas where earnings are higher, which is reflected by the residence-based earnings being higher than workplace-based earnings.
Copeland, in the North West of England, appears above the national average line, with a relatively high median annual salary and a relatively low median house price, making it relatively affordable to own a property here. The median annual salary was £47,221, which is in the highest 1% of all local authorities; whereas the median house price was £128,000, which falls in the lowest 10% of local authorities. In Copeland there are a large number of relatively high-paid, skilled jobs at the Sellafield nuclear power station, which could partly explain why properties appear more affordable in this area.
Tower Hamlets, in London, falls above the line of best fit for all local authorities. Although there are relatively high median house prices in Tower Hamlets of £479,000, which falls in the top 10% of all local authorities. Tower Hamlets may appear more affordable because of the relatively high workplace-based median annual salary of £49,479, which falls in the highest 1% of all local authorities. However, the annual salary of residents in Tower Hamlets was significantly lower in 2017 than the salaries of employees in the borough. Therefore, housing is less affordable for the residents of Tower Hamlets. When we look at Tower Hamlets in comparison with the median affordability ratio line for England and Wales, Tower Hamlets falls below the England and Wales average, indicating it is a relatively less affordable local authority given the national trend.
City of London is another local authority that falls below the England and Wales median affordability ratio line, but above the line of best fit for all local authorities. However, the affordability ratio for this borough is based on a relatively small number of residential property sales, so it is harder to determine whether this reflects the true level of housing affordability in this area.
Notes for: Areas with higher house prices do not always have higher earnings
- In this section, the housing affordability ratios and earnings discussed are based on workplace-based earnings, unless otherwise stated.
6. House prices driving worsening affordability in the South East and East of England
Between 2016 and 2017, there were two regions in England and Wales that had significant changes in the ratio of median house price to median workplace-based annual earnings. The East of England had an increase in ratio1 of 7.8%, from 9.0 in 2016 to 9.7 in 2017. The South East had an increase in ratio of 5.1%, from 9.8 to 10.3. All the regions in England and Wales had an increasing ratio and therefore worsening affordability over this year, except for the North East and Wales, although only the South East and East had significant changes.
Figure 7 shows the percentage change in house prices and earnings separately for each English region and in Wales between 2016 and 2017. It shows that house prices and earnings increased in all English regions and Wales, but the two regions with the largest increase in house prices (the East (10%) and the South East (6.9%)), were the two regions with the significant differences over the year. This suggests that house prices are driving the significant worsening in affordability.
Figure 7: Change in median house prices and median earnings by region
England and Wales, 2016 to 2017
Source: House Price Statistics for Small Areas and the Annual Survey of Hours and Earnings, Office for National Statistics
Notes:
- Median house price refers to the median price paid for residential property.
- Median earnings refers to the median workplace-based gross annual full-time earnings.
Download this chart Figure 7: Change in median house prices and median earnings by region
Image .csv .xlsEarnings increased for all regions and Wales, but to a smaller extent than house prices in many regions, with the largest increase being around 2.9% in London. There were two areas in which the percentage change in earnings was greater than the percentage change in house prices and these areas therefore had improving housing affordability. These were the North East and Wales, however, these changes in affordability were not significant.
House prices increased in 94% of the local authorities in England and Wales between 2016 and 2017, with 206 local authorities having house price increases of 5% or more. All local authorities in the East and South East of England had increasing house prices, apart from South Bucks, in the South East, with a decreasing median house price of 0.9% from £540,000 in 2016 to £535,000 in 2017.
Notes for: House prices driving worsening affordability in the South East and East of England
- In this section, the housing affordability ratios and earnings discussed are based on workplace-based earnings only.
7. Housing affordability worsened the most in London over the last five years
There were 69 local authorities in England and Wales that had significant differences1,2 in the ratio of median house prices to median workplace-based annual earnings over five years, between 2012 and 2017. Over three-quarters of these local authorities were in London, the South East and East of England. There were no significant differences found over this time period for local authorities in the North East or Wales.
In 2017, of the 10 least affordable3 local authorities, seven were in London. All but five London boroughs had significant worsening of affordability since 2012. Figure 8 shows the housing affordability ratios for the 10 local authorities that have had the highest percentage change between 2012 and 2017, and eight of these are London boroughs.
Figure 8: Housing affordability ratio for the 10 local authorities with the largest percentage change in affordability
England and Wales, 2012 to 2017

Source: House Price Statistics for Small Areas and the Annual Survey of Hours and Earnings, Office for National Statistics
Notes:
- Local authorities are ordered by the percentage difference in the ratio of median house price to median annual earnings between 2012 and 2017.
- There is no coefficient of variation available for Epsom and Ewell in 2012, therefore error bars cannot be produced for this local authority in this year.
- Housing affordability ratio refers to the ratio of the median price paid for residential property to the median workplace-based gross annual full-time earnings.
Download this image Figure 8: Housing affordability ratio for the 10 local authorities with the largest percentage change in affordability
.png (45.5 kB) .xlsx (40.4 kB)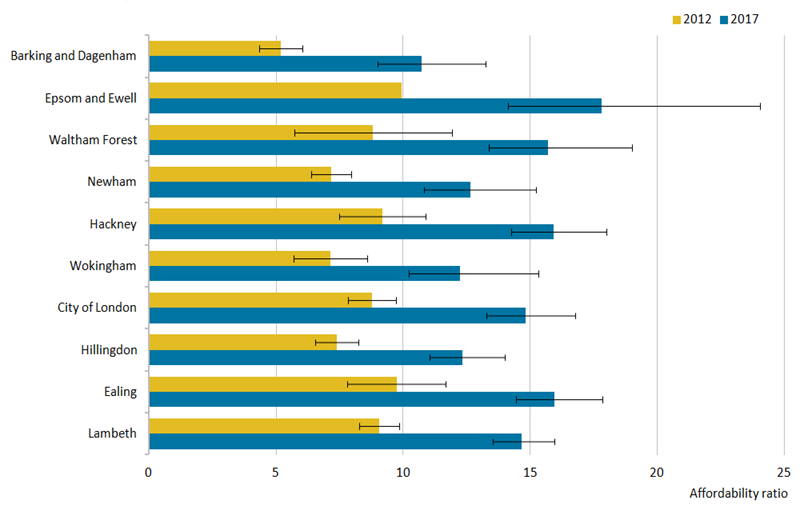
Barking and Dagenham in London had the largest percentage increase in affordability ratio, meaning that this local authority has worsened in affordability the most over the last five years. In Barking and Dagenham, the worsening affordability predominantly resulted from a 77.3% increase in median house prices since 2012.
Figure 9 shows the affordability ratio for the two most affordable local authorities in London in 2017 when looking at workplace-based affordability and how this has changed over time. From 2006 through to 2016, Barking and Dagenham was the most affordable local authority in London, however, the affordability ratio has increased steadily over time and it has become less affordable than Tower Hamlets in 2017.
Here, the workplace-based affordability ratio was 5.2 in 2012, but increased by 106.6% to 10.72 in 2017. Tower Hamlets was the second most affordable London local authority in 2012, with an affordability ratio of 6.7, but this increased by 43.8% to a ratio of 9.68 in 2017, which was a slower increase in comparison with Barking and Dagenham.
Figure 9: Housing affordability ratio for the two most affordable London local authorities in 2017
2002 to 2017
Source: House Price Statistics for Small Areas and the Annual Survey of Hours and Earnings, Office for National Statistics
Notes:
- Data for annual earnings are not available before 1999 and for some local authorities in some years. For these years the earnings relate to annualised weekly earnings. Annualised weekly earnings are not produced on an identical basis to annual earnings and so care should be taken when making comparisons. Refer to the dataset accompanying this release for information on which ratios are based on annualised weekly earnings.
- Housing affordability ratio refers to the ratio of the median price paid for residential property to the median workplace-based gross annual full-time earnings.
Download this chart Figure 9: Housing affordability ratio for the two most affordable London local authorities in 2017
Image .csv .xlsFigure 9 also highlights that although Tower Hamlets was the most affordable London borough in 2017 based on workplace-based earnings, this was not the case when residence-based earnings were used. Tower Hamlets was the 17th most affordable local authority in London when residence-based earnings were used, emphasising that the annual salary of residents in Tower Hamlets was generally lower than the salaries of employees in the borough.
Tower Hamlets had a 58.5% increase in house prices between 2012 and 2017, and had the fourth-highest number of net additional dwellings out of local authorities in England, with a net increase of 9,758 dwellings. Although house prices have increased in this local authority, over 65% of the London boroughs saw a greater percentage increase over the five-year period. The high demand for residential properties could have been met by a high number of net additional dwellings in this area, potentially allowing the median price paid to not increase as much as other local authorities with fewer net additional dwellings.
However, out of the 10 local authorities with the largest number of net additional dwellings between 2012 and 2017, six had significantly worsening housing affordability. A high level of housing supply in an area could contribute to housing affordability by meeting high demand, but in London, even the areas with high house building generally had worsening affordability over time, so other factors are likely to contribute to overall housing affordability.
Notes for: Housing affordability worsened most in London over the last five years
We have calculated significant differences by applying plus or minus twice the coefficient variation (CV) of the earnings data, as the Annual Survey of Hours and Earnings confirms the true value is likely to lie within these limits. For example, for estimated earnings of £30,000 with a CV of 5%, we would expect the true population average to be within the range £27,000 to £33,000. We then divide the median house price by the lower and upper earnings limits to derive lower and upper limit affordability ratios.
Significant differences in the housing affordability ratio does not necessarily mean that there are significant differences in earnings, but instead the earnings in relation to house prices at a given time is significantly different.
In this section, the housing affordability ratios and earnings discussed are based on workplace-based earnings, unless otherwise stated.
9. Quality and methodology
The Housing affordability Quality and Methodology Information report contains important information on:
the strengths and limitations of the data and how it compares with related data
uses and users of the data
how the output was created
the quality of the output including the accuracy of the data
Details of the policy governing the release of new data are available in the UK Statistics Authority’s Code of Practice for Statistics.
Back to table of contents