1. Main points
More than three-quarters of middle layer super output areas had an increase in median price paid in year ending September 2017, compared with the previous year.
The number of residential property transactions in England and Wales fell 7.9% to a four-year low of 871,795 in year ending September 2017.
Sales of leaseholds comprised 7.5% of all sales of detached, semi-detached and terraced houses in year ending September 2017 while 15.6% of new houses were sold as leaseholds.
70% of new detached, semi-detached and terraced houses sold in the North West were leaseholds, around 4.5 times the national level.
2. Things you need to know about this release
Definitions and data sources
The house price statistics for small areas (HPSSAs) use data from the HM Land Registry (LR) to provide statistics on the price paid and composition of residential property transactions for properties that were sold in England and Wales. Properties sold at a discount to market level, such as properties sold under the Right to Buy scheme, are excluded from the LR data.
The data series in the HPSSAs is revised quarterly back to year ending March 2011 and these data supersede all previously published HPSSA data, to ensure that:
residential property transactions added to or edited in the LR price paid data (PPD) are included, especially in more recent periods to which changes are more likely to relate
if a geography change is made the entire series reflects the new structure, avoiding geographic breaks in the time series
HPSSA data prior to year ending March 2011 were last updated on 20 December 2017.
The smallest areas for which statistics are presented are lower layer super output areas (LSOAs), of which there are 34,753 in England and Wales, each containing around 600 households. More detailed statistics are presented for other geographies including the slightly larger middle layer super output areas (MSOAs). There are 7,201 MSOAs in England and Wales, each containing around 3,000 households. Statistics for super output areas therefore provide a detailed geographic understanding of housing trends for properties that were sold at market value.
Differences to other housing statistics
HPSSAs provide a different set of statistics to the UK House Price Index (UK HPI). The UK HPI is weighted to reflect the mix of properties sold in the previous year, which is broadly representative of the mix of properties in the overall dwelling stock. The HPSSAs are not mix-adjusted but use rolling years to better reflect the actual mix of property sold than is possible with a shorter period and so avoids seasonal effects. This means that the UK HPI provides a measure of the changing value of properties in the housing market, whereas the HPSSAs measure the price paid for properties sold in a given period. Therefore the two sets of statistics provide different figures.
The HPSSAs report the non-adjusted average transactional values down to the small area level and are therefore particularly useful when identifying the change in price for properties actually sold in a given period and area. HPSSAs can also be used to identify changes in the number of property transactions, housing market value and the composition of transactions by property type.
Her Majesty’s Revenue and Customs Quarterly Stamp Duty Statistics also produce Local Authority District and Westminster Parliamentary Constituency level data showing the number of property transactions in each Stamp Duty Land Tax (SDLT) band. These statistics relate to a slightly different subset of transactions than the HPSSAs. The Quarterly Stamp Duty Statistics include transactions of £40,000 or more and include some types of transactions that are excluded in the HPSSAs, such as transactions that took place with a buy-to-let mortgage. These differences mean that the number of transactions reported in the HPSSAs is lower than the number of transactions reported in the Quarterly Stamp Duty Statistics.
Effect of changes to Stamp Duty Land Tax
The 2017 budget announced immediate exemption of Stamp Duty Land Tax for first-time buyers for purchases up to £300,000 in value and reduced tax for those purchasing for the first time at up to £500,000. Any impact this has on the number of transactions or price paid will appear in the statistics for the year ending December 2017, which will be published in June 2018.
Back to table of contents3. Residential property transactions in England and Wales fall to four-year low
The number of residential property transactions recorded by HM Land Registry in England and Wales has fallen 7.9% to 871,795 in year ending September 2017 from 946,317 in the previous year. This is the lowest number recorded since year ending September 2013, when 731,754 transactions were recorded. This reflects the downward trend in reported house buyer and vendor activity (PDF 602KB).
Figure 1 shows that the number of property transactions for all property types was lower in the year ending September 2017 compared with the previous year. Property transactions for flats and maisonettes have decreased by the most, with a drop of 15.5% to 161,773 in the year ending September 2017. The number of property transactions decreased sharply for all property types before the economic downturn in 2009 and have since partially recovered.
Figure 1: Number of residential property transactions by property type
England and Wales, years ending September 1996 to 2017
Source: Office for National Statistics and HM Land Registry
Download this chart Figure 1: Number of residential property transactions by property type
Image .csv .xlsFigure 2 shows the percentage of middle layer super output areas (MSOA) in which the number of property transactions increased compared with the previous year. In the year ending September 2017, 33% of MSOAs had an increase in the number of property transactions since the previous year, which is down from 59% for the year ending September 2016. This was the lowest it has been since the year ending September 2009, during the economic downturn, although this is well above the downturn low.
Figure 2: Percentage of middle layer super output areas in which the number of property transactions increased since the previous year
England and Wales, years ending September 1997 to 2017
Source: Office for National Statistics and HM Land Registry
Download this chart Figure 2: Percentage of middle layer super output areas in which the number of property transactions increased since the previous year
Image .csv .xlsIn the year ending September 2017, the median price paid for residential properties in MSOAs in England and Wales ranged from £32,000 (within County Durham) to £2,900,000 (within Westminster). The MSOA in County Durham had the lowest median price paid for the seventh consecutive quarter, despite increasing since year ending March 2017. The MSOA in Westminster has had the highest median price paid for the entire time series, except in year ending June 2005.
Figure 3 shows a map of the median price paid for MSOAs in England and Wales in year ending September 2017. The map shows that the areas of highest median prices paid were mainly in London and parts of the South East and East of England. There were 60 MSOAs in which the median price paid was greater than £925,000 in the year ending September 2017. Out of these 60 MSOAs, 54 were in London (this represents 5.5% of London MSOAs). The North West had the most MSOAs (179) with a median price paid in the lowest category on the map in year ending September 2017. This lowest category represents the lowest priced 10% of transactions in England and Wales.
Figure 3: Median price paid for all dwellings by middle layer super output areas
England and Wales, year ending September 2017

Source: Office for National Statistics, Ordnance Survey and HM Land Registry under the Open Government Licence v3.0. Contains OS data © Crown copyright 2018
Notes:
- The numbers in brackets on the legend show the number of areas that fall in each range.
Download this image Figure 3: Median price paid for all dwellings by middle layer super output areas
.png (261.2 kB)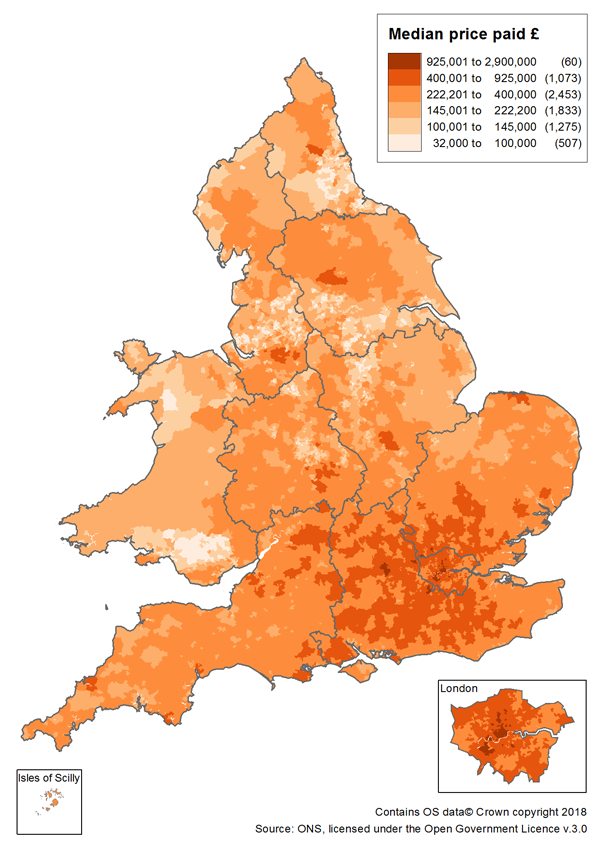
In the year ending September 2017, the median price paid for residential properties increased in 76% of MSOAs in England and Wales, stayed the same in 9.5% and decreased in the rest. In the same period, house price inflation in the headline measure of house prices, the UK House Price Index (HPI), was 4.88% in England and Wales overall. Figure 4 shows that the percentage of MSOAs in which the median price paid increased has remained relatively stable in the last four years, with only a three percentage point drop in the last year. This follows a relatively large decrease during and immediately after the economic downturn in 2009. This trend for England and Wales is similar in its constituent countries and regions.
Figure 4: Percentage of middle layer super output areas in which median property price paid increased since the previous year
England and Wales, years ending September 1997 to 2017
Source: Office for National Statistics and HM Land Registry
Download this chart Figure 4: Percentage of middle layer super output areas in which median property price paid increased since the previous year
Image .csv .xlsHousing market value is the total value of residential property transactions for an area. It is driven by a combination of property prices and the number of property transactions. This can be used to provide an overview of the scale of the property transaction economy. These housing market value statistics are presented in nominal terms, which mean that they have not been adjusted to take account of price inflation and so they present the simple total transactional value of all property sales.
The total housing market value in England and Wales for the year ending September 2017 was £253 billion. This is a decrease of just over £12 billion on the previous year and the first time it has fallen since the year ending September 2011. Figure 5 shows indices of the total housing market value in nominal terms, which was lower in the year ending September 2017 than the peak before the economic downturn in 2009, both for England and Wales and for London, although this was higher than the downturn low. London’s total housing market value has decreased more sharply than in England and Wales over the past year.
Figure 5: Total nominal value of property transactions decreased more in London than in England and Wales
London, England and Wales, years ending September 1996 to 2017
Source: Office for National Statistics and HM Land Registry
Notes:
- Total nominal value is calculated by multiplying the mean price paid by the number of transactions. This is expressed as an index in this chart, where 100 is the total nominal value in year ending September 2007.
Download this chart Figure 5: Total nominal value of property transactions decreased more in London than in England and Wales
Image .csv .xls4. New properties increasingly sold as leasehold
In addition to the house price statistics presented in this report, the HM Land Registry price paid data also provides information about the number of transactions of leasehold properties. Leasehold properties are those that are owned for a fixed period of time, under an agreement with the landlord, usually known as the freeholder. Whilst these data provide information about trends in the sales of leasehold properties, they do not contain information about the reasons for the sale of leaseholds or information about who owns the land on which the properties are built.
In England and Wales, just over 24% of all property transactions were sold under leasehold contracts in the year ending September 2017. Three quarters of all these leasehold transactions were flats and maisonettes. For houses (detached, semi-detached or terraced properties), 7.5% were sold as leasehold.
New houses were up to four times as likely to be sold as leasehold than houses sold from existing stock, depending on house type. The UK government recently announced plans to “cut out unfair and abusive practices within the leasehold system, including a ban on leaseholds for almost all new build houses” in England. The Welsh Government also recently announced new measures to tackle leasehold concerns in Wales. This section uses Land Registry price paid data to find out more about transactions of leasehold properties.
Figure 6 shows the percentage of property transactions that were leasehold, by house type, in the year ending September 2017, for new houses and those sold from the existing stock. For new houses, around 15% sell as leaseholds, with small variation between the proportions for the three different house types. Transactions from the existing stock of houses are less likely to be leasehold than for transactions identified as being new, ranging from detached houses (4%) to terraced houses (9%).
Figure 6: Percentage of property transactions that were leasehold by house type
England and Wales, year ending September 2017
Source: Office for National Statistics and HM Land Registry
Download this chart Figure 6: Percentage of property transactions that were leasehold by house type
Image .csv .xlsAs the tenure is often set when a property is first sold, this suggests that current trends in the sale of new properties as leaseholds could be different from historic trends, and that the selling of properties other than flats and maisonettes as leasehold is more common now than it has been in the past. New detached houses, for example, are now four times more likely to be sold as leasehold as those sold from the existing stock.
However, we can’t be certain from these data alone that properties from the existing stock were not sold as leasehold originally and later converted to freehold in subsequent transactions. Data are available back to 1995 for property transactions and this can give insight into whether the current picture is representative of recent history or if new trends in the sale of leasehold properties are emerging.
Figure 7 compares the percentage of leasehold transactions of detached houses since 1996, comparing transactions identified as being newly built with transactions from the existing stock. The percentage of existing detached properties sold as leasehold has been stable at between 3% and 4% over the entire time series. The percentage of leaseholds for new detached properties was slightly higher than for existing properties in the late 1990s, but increased in the early 2000s and reached 8% by 2008. The percentage of new detached houses selling as leasehold has almost doubled again from 8% in 2012 to 15% in 2017.
Figure 7: Percentage of detached property transactions that were leasehold
England and Wales, years ending September 1996 to 2017
Source: Office for National Statistics and HM Land Registry
Download this chart Figure 7: Percentage of detached property transactions that were leasehold
Image .csv .xlsFigure 8 shows a similar, albeit later, trend for the increase in sales of leasehold semi-detached properties. In 2014 the percentage of new semi-detached properties sold as leaseholds started to rise from 10% to its highest level of 16% in 2017, whilst the percentage of existing semi-detached properties sold as leasehold has remained stable.
Figure 8: Percentage of semi-detached property transactions that were leasehold
England and Wales, years ending September 1996 to 2017
Source: Office for National Statistics and HM Land Registry
Download this chart Figure 8: Percentage of semi-detached property transactions that were leasehold
Image .csv .xlsFigure 9 shows that the percentage of new terraced properties sold as leaseholds has also increased, particularly in recent years when the percentage has reached its highest level (16% in year ending September 2017). Unlike detached and semi-detached properties, however, leasehold was more common in properties sold from the existing housing stock than in new builds prior to 2006 when leasehold then became more common in new terraced properties.
Figure 9: Percentage of terraced property transactions that were leasehold
England and Wales, years ending September 1996 to 2017
Source: Office for National Statistics and HM Land Registry
Download this chart Figure 9: Percentage of terraced property transactions that were leasehold
Image .csv .xlsNewly built houses in England and Wales have been more likely to be leasehold than houses sold from the existing stock, and the percentage of newly built houses selling as leaseholds has increased in recent years. However, housing trends tend to differ across the country. Figure 10 shows the percentage of transactions of new properties that are leasehold for each house type within each English region and Wales. The proportion of leasehold properties for houses varies across the regions of England and Wales, from a relatively small percentage in the South East of England (1% to 4%) to relatively common in the North West of England (68% to 70%). The North West had a higher proportion of sales of new properties as leaseholds than any other area for all house types.
Figure 10: Percentage of transactions of newly built properties that were for leasehold houses
English regions and Wales, year ending September 2017
Source: Office for National Statistics and HM Land Registry
Download this chart Figure 10: Percentage of transactions of newly built properties that were for leasehold houses
Image .csv .xlsFigure 11 shows that the percentage of property transactions from the existing stock that were leaseholds is relatively small outside of the north of England, and the North West in particular. This could reflect the northern cities’ tendency to have “historic” leasehold tenures with a negligible or no ground rent where properties were built on land owned by industry, churches and landowners.
Figure 11: Percentage of transactions of existing properties that were for leasehold houses
English regions and Wales, year ending September 2017
Source: Office for National Statistics and HM Land Registry
Download this chart Figure 11: Percentage of transactions of existing properties that were for leasehold houses
Image .csv .xlsFigure 12 compares the percentage of transactions of leasehold property for new houses against the percentage for existing houses, for both England and Wales overall and the North West region. It shows that the increase in new houses sold as leasehold was far greater in the North West than in England and Wales overall. In the year ending September 2017, 70% of new houses sold in the North West were leaseholds, compared with 16% in England and Wales.
Figure 12: Percentage of property transactions that were for new and existing leasehold houses
England and Wales, North West region, years ending September 1996 to 2017
Source: Office for National Statistics and HM Land Registry
Download this chart Figure 12: Percentage of property transactions that were for new and existing leasehold houses
Image .csv .xlsIn the North West many local authorities have a high proportion of transactions of newly built houses sold as leasehold. For example, all transactions of new houses in Oldham in the year ending September 2017 were leasehold. This compares with 67% of transaction of existing houses sold as leasehold. In the local authorities of Bury, Trafford and Salford, more than 95% of the newly built houses were sold under leasehold in the same period with transactions for existing houses between 29% and 56% leasehold.
These data suggest an increasing trend for new houses to be sold as leaseholds, particularly in the North West of England, not just reflecting the higher historic leasehold levels in these areas.
Notes for: New properties increasingly sold as leasehold
- For accompanying data to this section see the supplementary datasets on the sale of leasehold and freehold properties.
6. What’s changed in this release?
We have changed our revisions policy. In this release we have revised the time series back to year ending March 2011. In previous releases we revised the entire series of HPSSA data.
We have updated the Local Enterprise Partnerships geography (in the sub-national files) to change the code for the Greater Cambridge and Greater Peterborough LEP, which has changed from E37000013 to E37000042.
We have also carried out some ad hoc analysis of sales of leasehold properties. Data for these analyses are available in the supplementary datasets for this release. These have been calculated for the entire time series back to year ending December 1995. For years prior to year ending March 2011, the total number of property transactions may differ slightly from those in the standard HPSSA data, which were not revised for years prior to that date. We will consider producing these additional statistics on a regular basis in the future.
Back to table of contents7. Quality and methodology
The House Price Statistics for Small Areas Quality and Methodology Information report contains important information on:
the strengths and limitations of the data and how it compares with related data
uses and users of the data
how the output was created
the quality of the output including the accuracy of the data