Table of contents
- Main points
- Things you need to know about this release
- Median price paid falls in least expensive area
- Price paid for newly built detached properties lower than existing properties
- Housing market activity remained subdued after Stamp Duty change
- Links to related ONS statistics
- New for this release
- Quality and methodology
1. Main points
In the year ending June 2016, the median price paid for residential property in the most expensive small area in England and Wales was £2,950,000, within the Westminster area. This area was also the most expensive one year ago when it had a higher median price paid of £3,321,250.
The median price paid in the least expensive small area in year ending June 2016 was £27,000. This area, within County Durham, is down from £55,500 one year ago.
In England and Wales, detached properties were the only type for which the median price paid for new properties was lower than for existing properties, in year ending June 2016.
The median price paid for newly built flats in England and Wales was 40% higher than the median price paid for existing flats.
Housing market activity has remained relatively subdued since the increase of Stamp Duty for second homes, with the total number of property sales in July 2016 now 7.4% below the historic 5-year average.
Back to table of contents2. Things you need to know about this release
The House Price Statistics for Small Areas (HPSSAs) use data from the Land Registry (LR) to provide statistics on the price paid and composition of residential property transactions for properties that were sold in England and Wales. Properties sold at a discount to market level, such as properties sold under the Right to Buy scheme, are excluded from the data.
Residential property transactions can be added to or edited in the LR Price Paid Data (PPD) retrospectively. This can cause changes to the number of sales and price statistics reported in the HPSSAs. For this reason, the entire series of data in the HPSSAs (back to year ending December 1995) is revised quarterly and these data supersede all previously published HPSSA data. Changes to the LR PPD tend to affect the most recent data more than historic data, which generally remains unchanged.
The smallest areas for which statistics are presented are middle layer super output areas (MSOAs), of which there are 7,201 in England and Wales. The largest area available is England and Wales overall. Statistics for MSOAs provide a more detailed geographic understanding of housing trends. It can be useful to view them in the context of the larger areas in which they sit, such as local authorities, regions and the country as a whole.
HPSSAs provide a different set of statistics to the UK House Price Index (UK HPI). The UK HPI is weighted to reflect the actual mix of properties sold in the previous year, which is broadly representative of the mix of properties in the overall dwelling stock. The HPSSAs are not mix-adjusted and so they refer to the actual price paid for property. This means that the UK HPI provides a measure of the changing value of properties in the housing market whereas the HPSSAs measure the price paid for properties sold in a given period. Therefore the 2 sets of statistics provide different figures.
The HPSSAs report the non-adjusted average transactional values down to the small area level and are therefore particularly useful when identifying the change in price for properties actually sold in a given period and area.
Back to table of contents3. Median price paid falls in least expensive area
The median price paid for residential property in middle layer super output areas (MSOAs) in the year ending June 2016 ranged from £27,000 (within the County Durham local authority district) to £2,950,000 (within Westminster). The MSOA in which the median price paid was highest has stayed the same since the year ending September 2005.
The median price paid in the least expensive MSOA has fallen from £55,500 one year ago when it was the 30th least expensive MSOA. Median price paid has been steadily decreasing in this part of County Durham and is now less than half of its post-economic downturn peak of £60,500 seen in year ending March 2015. The decrease in median price paid may, in part, be caused by increases in the number of sales of existing terraced properties with a relatively low price paid.
Between year ending June 2015 and year ending June 2016, there were more MSOAs in England and Wales that had an increase in median price paid than had a decrease. Almost four-fifths of all MSOAs had an increase in median price paid for all properties.
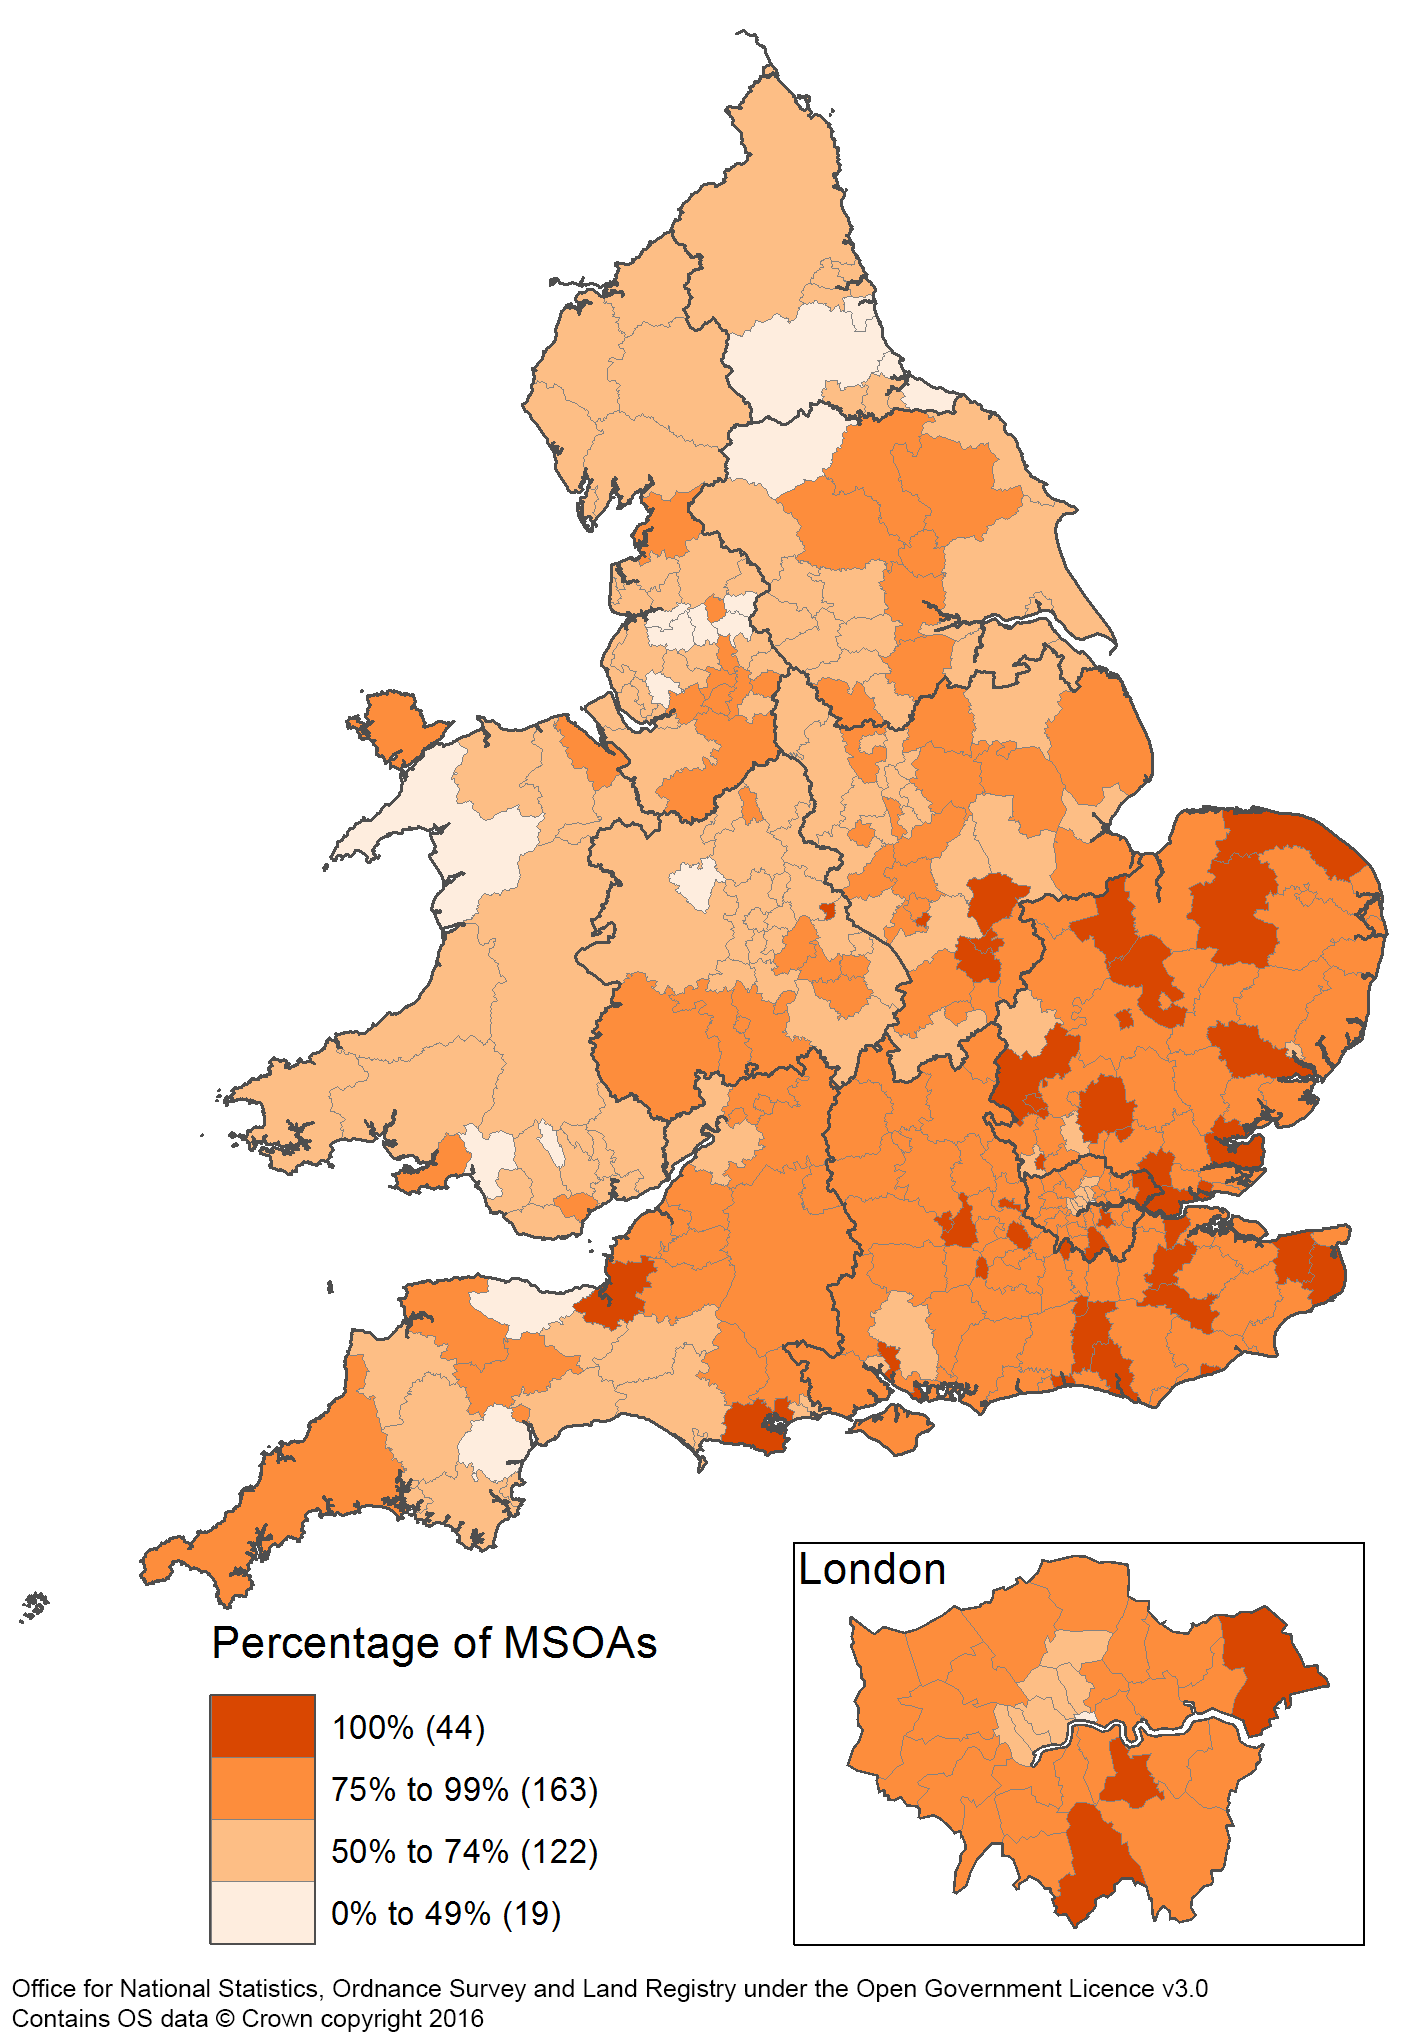
Figure 1 shows the percentage of MSOAs in each local authority which had an increase in median price paid compared with the previous year. It shows the majority of local authorities had 50% or more of their component MSOAs with an increasing price paid. There were 44 local authorities in which all MSOAs had an increase in median price since the previous year. Of these, 39 were in the south and east of England.
There were 16 local authorities in which less than half the component MSOAs had an increase in median price paid since the previous year. These are predominantly in the north of England and in Wales.
Figure 1: Percentage of middle layer super output areas where the median price paid increased compared with the previous year, by local authority, England and Wales
Year ending June 2016
Download this image Figure 1: Percentage of middle layer super output areas where the median price paid increased compared with the previous year, by local authority, England and Wales
.png (147.7 kB)
4. Price paid for newly built detached properties lower than existing properties
Figure 2 shows the difference between the median price paid for newly built properties against that of existing properties, by property type. The difference in price paid has varied over time and the price paid for new flats, terraces and semi-detached properties was higher than that of the existing stock in year ending June 2016.
Since the economic downturn, the price difference between new and existing properties has increased the most for flats. In year ending September 2009, the median price paid for new flats was 6% lower than the median price paid for existing flats and by the year ending June 2016, the price of new flats was 40% higher than existing flats. However, this difference is lower than the pre-downturn peak of 67% in the year ending September 1999.
Figure 2: Percentage difference between median price paid for new properties and existing properties, by property type, England and Wales
Year ending December 1995 to year ending June 2016
Source: Office for National Statistics and Land Registry
Notes:
- Q1 refers to Quarter 1 (Jan to Mar); Q2 refers to Quarter 2 (Apr to June); Q3 refers to Quarter 3 (July to Sept); and Q4 refers to Quarter 4 (Oct to Dec).
Download this chart Figure 2: Percentage difference between median price paid for new properties and existing properties, by property type, England and Wales
Image .csv .xlsChanges in the relative price of new and existing property reflect, to some extent, changes in the characteristics of new properties compared with the characteristics of the existing dwelling stock. For example, new flats could be getting more expensive than existing flats partly because they are getting larger on average and are likely to be in generally better condition than existing flats. If the existing dwelling stock contains a lot of relatively poor condition 1 bedroom flats and new flats are predominantly high quality 2 bedroom flats, then the price paid for new stock is likely to be higher than the existing stock in a given area. Whilst the HPSSA data shows the price paid for different types of properties, it does not contain information about the characteristics of sold properties within each type.
Figure 3 shows the 5 most and the 5 least expensive major towns and cities in England and Wales in terms of median price paid for new flats. It shows the percentage difference between the median price paid for new and existing flats. In the towns and cities with the highest median price paid for new flats, newly built flats were more expensive than those sold from the existing stock. However, in the towns and cities with the lowest median price paid for new flats, newly built flats were more likely to sell for less than those in the existing stock. Out of the 5 least expensive towns and cities for new flats, Bradford was the only one in which the price of new flats exceeded the price of existing flats (17% difference).
Figure 3: Percentage difference between the price paid for new and existing flats, major towns and cities in England and Wales
Year ending June 2016
Source: Office for National Statistics and Land Registry
Download this chart Figure 3: Percentage difference between the price paid for new and existing flats, major towns and cities in England and Wales
Image .csv .xlsFigure 4 shows the 7 towns and cities where the median price paid for new flats was more than double the median price paid for existing flats. Of these, 6 are cities in the north of England and the other is in the West Midlands.
Figure 4: Towns and cities where the median price paid for new flats was more than twice the median price paid for existing flats, England and Wales
Year ending June 2016
Source: Office for National Statistics and Land Registry
Download this chart Figure 4: Towns and cities where the median price paid for new flats was more than twice the median price paid for existing flats, England and Wales
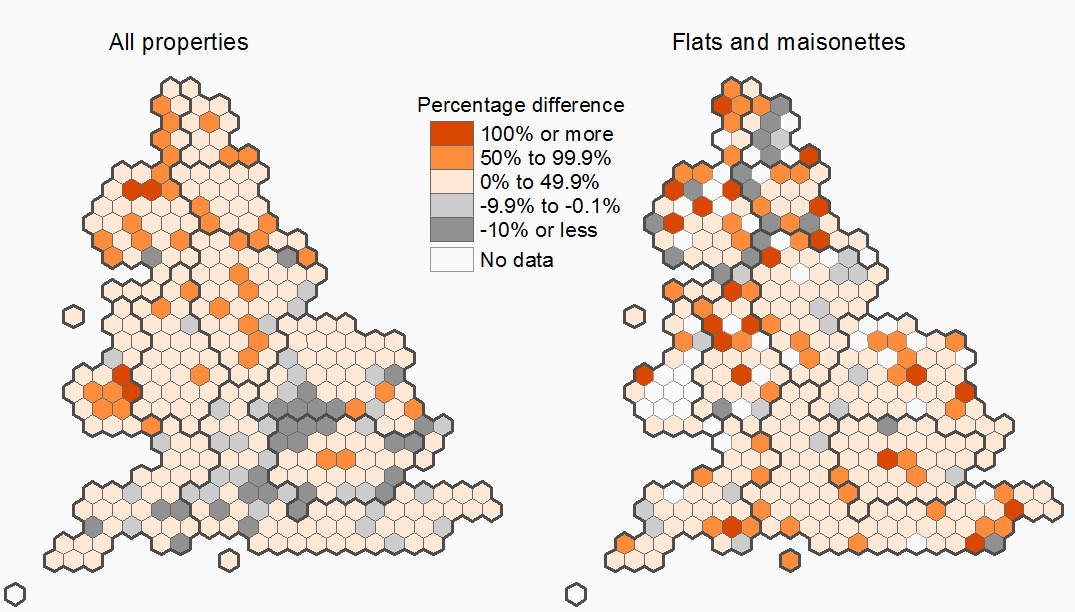
Image .csv .xlsFigure 5 shows the percentage difference between the median price paid for new properties and the median price paid for existing properties in year ending June 2016. It presents each local authority district (LAD) as a hexagon so that all LADs appear the same size, which helps to make comparisons. Presenting the data in this way means that the locations of LADs are not geographically precise, but are positioned relative to other LADs.
The map shows that in the vast majority of LADs, the median price paid for new properties was greater than the median price paid for existing properties. However, there were 29 LADs in which the median price paid for all new properties was at least 10% lower than the median price paid for all existing properties. Out of these 29 LADs, only Trafford is in the north of England.
For flats and maisonettes, there were 18 LADs in which the median price paid for new flats was at least 10% lower than the median price paid for existing flats. Out of these 18 LADs, 13 are in the north of England.
Figure 5: Percentage difference of the median price between new and existing dwellings for all property types and for flats by local authority district, England and Wales
Year ending June 2016
Source: Office for National Statistics and Land Registry under the Open Government Licence v3.0.
Notes:
Values for all properties range from a minimum of -31% to a maximum of 147%
Values for flats and maisonettes range from a minimum of -44% to a maximum of 295%
Download this image Figure 5: Percentage difference of the median price between new and existing dwellings for all property types and for flats by local authority district, England and Wales
.png (45.5 kB)
This suggests that despite new flats generally being more expensive than existing flats, areas in which new flats were less expensive are more likely to be in the north. In Liverpool for example, the median price paid for new flats (£64,950) was 44% lower than the median price paid for existing flats (£115,000). This could reflect a combination of different types of flats being built now to those built previously and the changing level of demand for new flats in the north influencing the median price paid.
There were 4 LADs in which the median price paid for all new properties was at least double the median price paid for all existing properties. This compares with 22 LADs in which the median price paid for new flats was at least double the median price paid for existing flats.
Back to table of contents5. Housing market activity remained subdued after Stamp Duty change
Figure 6 shows that the number of property sales, on a monthly basis, has remained below the historic level following the changes to Stamp Duty Land Tax in April 2016. Despite monthly increases in the number of sales since April, they have remained around 5,000 sales below the average for the previous 5 years. This is in contrast to the number of property sales in the months before the Stamp Duty changes, during which the number of sales was higher than the 5-year average.
Figure 6: Number of residential property sales by individual month and monthly historic 5-year average, England and Wales
August 2015 to July 2016
Source: Office for National Statistics and Land Registry
Notes:
- The 5-year average is for the 5 previous years, for example April 2016 is compared with the 5-year average for the month of April in years 2011 to 2015.
Download this chart Figure 6: Number of residential property sales by individual month and monthly historic 5-year average, England and Wales
Image .csv .xlsData from the Council of Mortgage Lenders shows that the number of mortgage completions for buy-to-let mortgages has remained subdued since the introduction of new Stamp Duty rules in April 2016. The number of mortgage completions for both first-time buyers and home-movers has shown signs of recovery in recent months.
Figure 7 shows the percentage difference between the number of sales for each property type compared with the 5-year average. It shows that the number of sales of all 4 property types remained below their historic monthly averages between April and July 2016. The number of sales of flats has continued to decline against the historic monthly average, falling from 20% below the 5-year average in April to 22% below average in July. Sales of the other 3 property types began to increase relative to their historic averages over this period.
Figure 7: Percentage difference between number of property sales in a single month and the 5-year average by property type, England and Wales
May 2015 to April 2016
Source: Office for National Statistics and Land Registry
Notes:
- The 5 year average is for the 5 previous years, for example April 2016 is compared with the 5 year average for the month of April in years 2011 to 2015.
Download this chart Figure 7: Percentage difference between number of property sales in a single month and the 5-year average by property type, England and Wales
Image .csv .xlsWhilst the April change to the Stamp Duty rules has had an impact on the number of property sales, there is currently no evidence of any effect of the EU referendum on the HPSSAs.
Back to table of contents7. New for this release
This release adds new data to cover the year ending June 2016 and updated figures for the whole time series.
This publication also provides an update on the article published in the previous release, which provided analysis of the effects of Stamp Duty Land Tax changes in April 2016. This section of the bulletin uses monthly data (not normally available in the HPSSAs) to provide an initial indication of the impact of these changes to July 2016, rather than the quarterly rolling year data presented in the rest of this statistical bulletin which only cover the period up to year ending June 2016. Data for individual months are published as supplementary data alongside the regular data, but will not be updated in future releases.
Back to table of contents8. Quality and methodology
The House price statistics for small areas Quality and Methodology Information document contains important information on:
the strengths and limitations of the data and how it compares with related data
users and uses of the data
how the output was created
the quality of the output including the accuracy of the data
Details of the policy governing the release of new data are available in the UK Statistics Authority’s Code of Practice for Offical Statistics.
Back to table of contents