Table of contents
- Main points
- Statistician’s quote
- Things you need to know
- More than 8 out of 10 adults in Great Britain use the internet daily or almost daily
- Mobile or smartphones are the most popular devices used by adults to access the internet
- 3 out of 4 adults access the internet ‘on the go’
- Activities completed on the internet
- Growth in online shopping
- Internet security, awareness and storage
- Household internet access
- Household internet access across Great Britain
- Your views matter
- Main issues specific to this bulletin
- Quality and Methodology
1. Main points
The internet was used daily or almost daily by 82% of adults (41.8 million) in Great Britain in 2016, compared with 78% (39.3 million) in 2015 and 35% (16.2 million) in 2006.
In 2016, 70% of adults accessed the internet ‘on the go’ using a mobile phone or smartphone, up from 66% in 2015 and nearly double the 2011 estimate of 36%.
New analysis on the use of smart TVs show 21% of adults used them to connect to the internet in 2016.
In 2016, 77% of adults bought goods or services online, up from 53% in 2008, but only up 1 percentage point from 2015.
Clothes or sports goods were purchased by 54% of adults, making them the most popular online purchase in 2016.
Speed of delivery was a problem encountered by 42% of the 16 to 24 year olds who had bought online compared with 15% of those aged 65 and over.
In 2016, 89% of households in Great Britain (23.7 million) had internet access, an increase from 86% in 2015 and 57% in 2006.
Back to table of contents2. Statistician’s quote
"Regular internet use continues to rise, with more than 8 in 10 people going online almost every day in 2016.
However, many older people are still to catch up with the digital revolution, with nearly half of single pensioners still having no internet access at all."
Kate Davies, Surveys and Economic Indicators Division, Office for National Statistics
Back to table of contents3. Things you need to know
The Internet Access Survey results are derived from the Opinions and Lifestyle Survey (OPN). Estimates for 2016 in this release refer to data collected in the January, February and April 2016 modules of the OPN.
We first collected statistics on internet access in 1998. Since then, various changes have been made to the Internet Access Survey, including the publication of annual results since 2006. Where possible, comparisons over time are made in this release. However, the available coverage for time series comparisons varies, as the questions included in the survey change each year.
Comparisons made between estimates in this release and the annual Internet Users publication should be undertaken with caution.
'On the go' refers to access to the internet, away from home or work.
A Smart TV is classified as being a TV that directly connects to the internet via a cable or wifi, not via a separate device.
Back to table of contents4. More than 8 out of 10 adults in Great Britain use the internet daily or almost daily
In 2016, 82% of adults (41.8 million) in Great Britain used the internet every day or almost every day. This was an increase from 78% in 2015 and more than double the reported estimate of 35% in 2006, when directly comparable records began (Figure 1) .
Figure 1: Daily internet use by adults, 2006 to 2016, Great Britain
Source: Office for National Statistics
Notes:
- Base: Adults aged 16+ in Great Britain
Download this chart Figure 1: Daily internet use by adults, 2006 to 2016, Great Britain
Image .csv .xls5. Mobile or smartphones are the most popular devices used by adults to access the internet
Mobile or smartphones are used to access the internet by 71% of adults in Great Britain. Desktop computers are down in popularity with only 40% of adults using these to access the internet in 2016. Smart TVs are becoming a convenient way to access the internet with 21% of adults going online this way in 2016 (Figure 2).
Figure 2: Devices used to access the internet, 2016, Great Britain

Source: Office for National Statistics
Notes:
- Base: Adults aged 16+ in Great Britain
Download this image Figure 2: Devices used to access the internet, 2016, Great Britain
.png (163.0 kB) .xls (26.6 kB)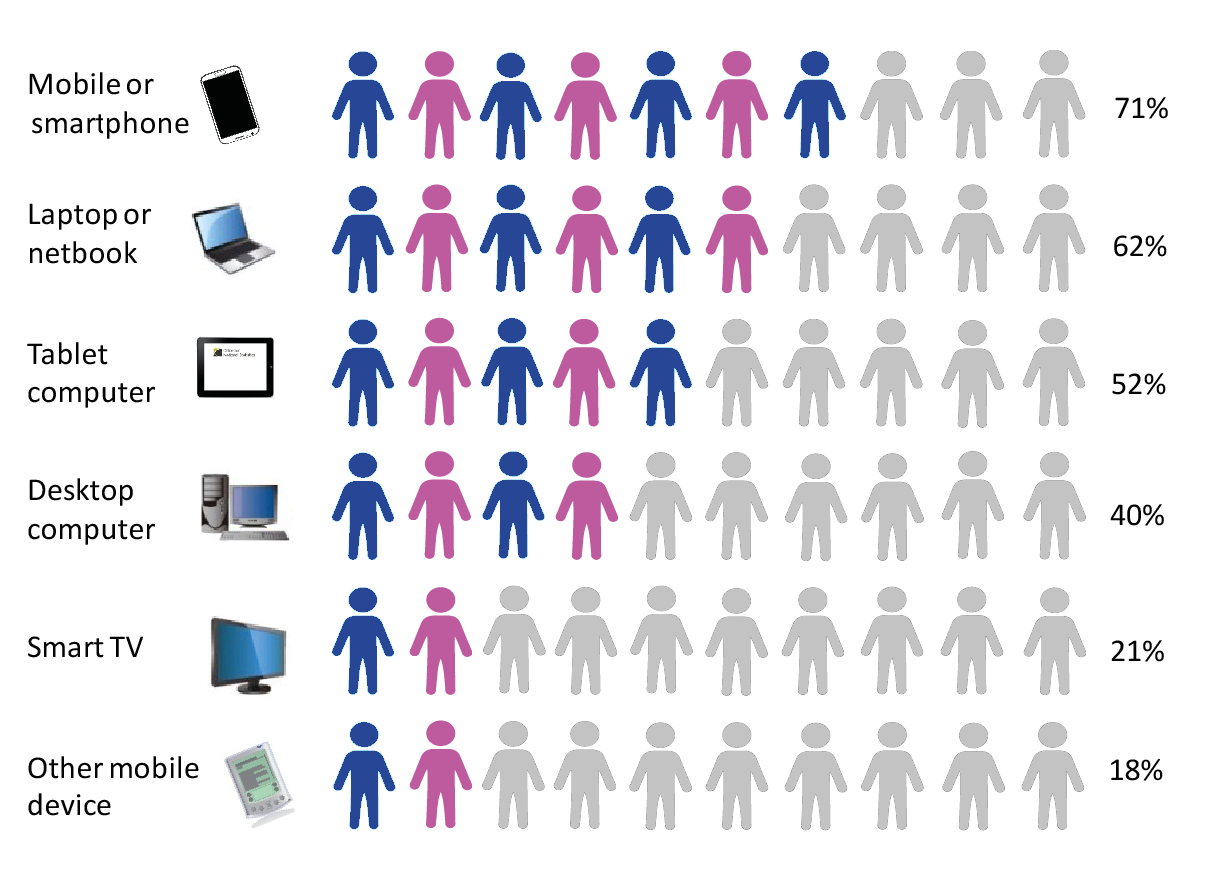
6. 3 out of 4 adults access the internet ‘on the go’
In 2016, 75% of adults had used the internet ‘on the go’ using a mobile phone or smartphone, portable computer or handheld device (Figure 3). Almost all adults aged 16 to 24 (97%) had accessed the internet ‘on the go’, compared with only 33% of those aged 65 years and over.
The most common type of device used to access the internet ‘on the go’ was a mobile phone or smartphone (70%), followed by portable computer such as a laptop or tablet (36%). Other handheld devices (eg MP3 or e-book reader) were used to access the internet by 12% of adults.
While the use of mobile phones or smartphones to access the internet 'on the go' continues to increase (from 66% in 2015 to 70% in 2016) the use of portable computers has decreased substantially (from 45% in 2015 to 36% in 2016).
Figure 3: Internet use 'on the go' 1 by device, 2013 to 2016, Great Britain
Source: Office for National Statistics
Notes:
- Base: Adults aged 16+ in Great Britain
- "On the go" refers to accessing the internet away from home or work.
Download this chart Figure 3: Internet use 'on the go' ^1^ by device, 2013 to 2016, Great Britain
Image .csv .xls7. Activities completed on the internet
Of the internet activities surveyed in 2016, the most popular activity completed online by adults was sending/receiving emails (79%). This was an increase of 3 percentage points from 76% in 2015 and a rise of 22 percentage points since the 2007 estimate of 57%, when directly comparable records began (Figure 4).
The second most common internet activity in 2016 was finding information about goods and services, undertaken by 76% of adults in 2016, the largest increase from 2015 of 7 percentage points. In 2007 the estimate was 58%.
All internet activities that were surveyed in 2007 and again in 2016 have seen an increase. Reading online news, newspapers or magazines showed the largest increase, 60% of adults in 2016, 3 times the proportion doing so in 2007 (20%). Internet banking (60%) and looking for health-related information (51%) have also seen large increases from 2007, rising 30 and 33 percentage points respectively.
Figure 4: Internet activities by year, 2007, 2015 and 2016, Great Britain
Source: Office for National Statistics
Notes:
- Base: Adults aged 16+ in Great Britain
Download this chart Figure 4: Internet activities by year, 2007, 2015 and 2016, Great Britain
Image .csv .xlsOnline activities analysed by age group shows sending/receiving emails and finding information on goods and services were the top 2 activities carried out by all age groups over 35. Those aged 35 to 44 reported highest use of email at 90%, while 53% of the oldest age group (those aged 65 and over) used email.
Adults aged 16 to 24 were most likely to engage in leisure or recreation activities, such as social networking (91%), listening to music (87%) or watching video content from sharing services (77%). Adults aged 25 to 34 reported the highest level of use in some ‘day-to-day’ activities such as use of internet banking (87%) and reading online news, newspapers or magazines (76%). Adults aged 65 and over also reported use of online activities including reading online news (34%) and using services related to travel (31%) (Figure 5).
Figure 5: Internet activities by age group, 2016, Great Britain
Source: Office for National Statistics
Notes:
- Base: Adults aged 16+ in Great Britain
Download this chart Figure 5: Internet activities by age group, 2016, Great Britain
Image .csv .xlsUse of the internet for social networking continued to grow and has become part of many adults’ everyday lives, rising to 63% in 2016. This was an increase from 61% in 2015 and 45% in 2011. Social networking is widespread in all age groups, up to and including those aged 55 to 64, where 51% of adults reported use. Of those aged 65 and over, 23% used social networks, an increase of 8 percentage points from 2015. Of the adults who have purchased online, 9% made a purchase through an advert from a social media website or app.
For the majority of the internet activities surveyed, there was little difference in the proportion of men and women carrying out the activities. Exceptions to this were watching video content from sharing services, which was carried out by 54% of men, compared with 40% of women.
Making an appointment with a doctor or other healthcare practitioner via a website has increased from the 2014 estimate by 5 percentage points to 15% in 2016. Previously there was no change between 2012 and 2014 as both years’ estimates were 10%.
In 2016 new estimates were collected on activities carried out on a smart TV. Watching internet streamed TV via a smart TV was carried out by 18% of adults. Using a smart TV for internet browsing via a browser app and using other apps were both carried out by 5% of adults. Looking at these activities by age group shows that more than a quarter (27%) of those aged 25 to 34 had watched internet streamed TV on a smart TV (Figure 6).
Figure 6: Activities carried out on a smart TV by age group, 2016, Great Britain
Source: Office for National Statistics
Notes:
- Base: Adults (aged 16+) in Great Britain
Download this chart Figure 6: Activities carried out on a smart TV by age group, 2016, Great Britain
Image .csv .xls8. Growth in online shopping
In 2016, more than three quarters (77%) of adults reported buying goods or services online in the last 12 months, a slight increase of 1.5 percentage points from 2015 and an increase of 24 percentage points from the 2008 estimate of 53%.
Online shopping has grown in popularity since 2008; those aged 55 to 64 had seen the largest increase of 33 percentage points over this period to 77% in 2016. Nearly 9 in 10 adults aged under 55 have shopped online within the last 12 months. Nearly half (45%) of adults aged 65 and over have also done so, an increase of 29 percentage points from 2008.
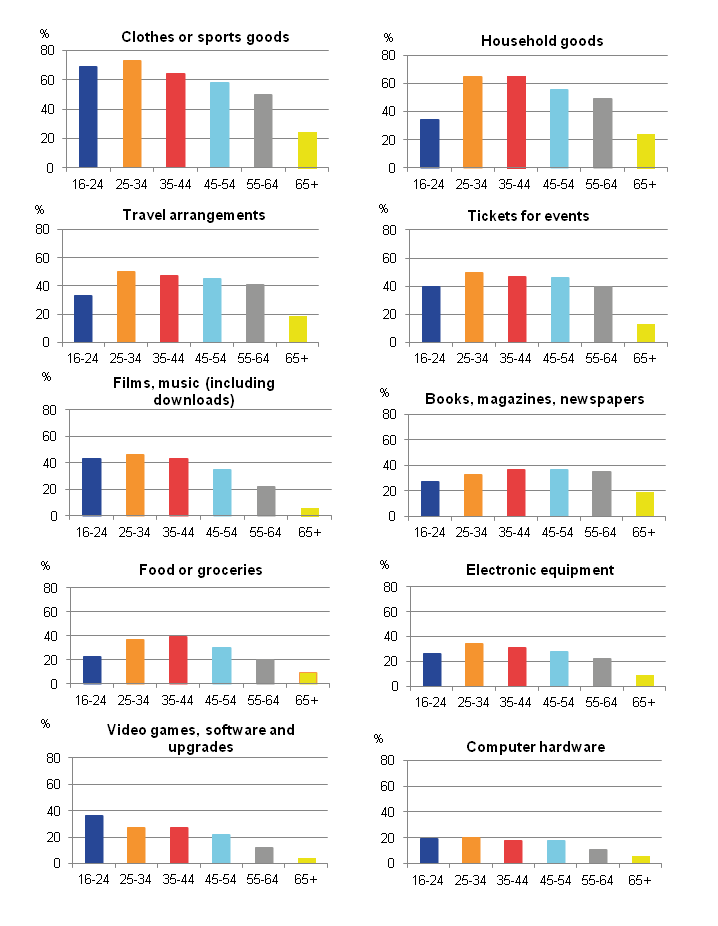
Clothes or sports goods were still the most popular online purchase in 2016, bought by 54% of adults. Those aged 25 to 34 were most likely to buy these items (73%). Household goods (for example, furniture, toys etc) were the next most popular items, purchased online by 48% of adults. Travel arrangements and tickets for events were both purchased online by 38% of adults. Since 2015, holiday accommodation purchases have increased the most, up by 5 percentage points to 42% in 2016.
There are differences between age groups in goods and services bought online. Figure 7 focuses on the differences between the age groups. The largest difference was for clothes or sports goods, with 73% of adults aged 25 to 34 purchasing these, compared to 24% of those aged 65 and over.
In 9 of the 14 categories surveyed, adults aged 25 to 34 reported the highest (or joint highest) rate of internet shopping.
Figure 7: Online purchases by age group, 2016, Great Britain
Source: Office for National Statistics
Notes:
- Base: Adults aged 16+ in Great Britain
Download this image Figure 7: Online purchases by age group, 2016, Great Britain
.png (12.3 kB) .xls (20.0 kB)
Of those adults who had bought over the internet in the last 3 months, 30% had done so 11 times or more, while 20% had done so only once or twice. Adults aged 35 to 44 purchased most often, with 38% buying online 11 times or more in the last 3 months.
Figure 8: Frequency of online shopping, by age group, 2016, Great Britain
Source: Office for National Statistics
Notes:
- Base: Adults aged 16+ who have purchased over the internet in the last 3 months in Great Britain
Download this chart Figure 8: Frequency of online shopping, by age group, 2016, Great Britain
Image .csv .xlsIn 2016, adults were asked if they used information from retailers’ websites, price comparison websites or reviews from others as considerations before they purchased online within the last 12 months (Figure 9). Adults in all age groups from 25 to 64 reported similar rates of use of information from retailers', producers' or service providers' websites, in the range of 55% to 59%. Those aged 16 to 24 and 65 and over reported lowest use of this information, at 49%. The most popular use of reviews by others was by the 25 to 34 age group, at 53%. Price comparison sites were not a popular choice for the 16 to 24 age group with 48% reporting that they rarely or never used these before purchasing, compared with 23% of those aged 45 to 55.
Figure 9a: Considerations made before shopping online by age group, 2016, Great Britain
Use of information from retailers', producers' or service providers' websites
Source: Office for National Statistics
Notes:
- Base: Adults aged 16+ who have purchased over the internet in the last 12 months in Great Britain
Download this chart Figure 9a: Considerations made before shopping online by age group, 2016, Great Britain
Image .csv .xls
Figure 9b: Considerations made before shopping online by age group, 2016, Great Britain
Use price or product comparison websites or apps
Source: Office for National Statistics
Notes:
- Base: Adults aged 16+ who have purchased over the internet in the last 12 months in Great Britain
Download this chart Figure 9b: Considerations made before shopping online by age group, 2016, Great Britain
Image .csv .xls
Figure 9c: Considerations made before shopping online by age group, 2016, Great Britain
Use reviews by others
Source: Office for National Statistics
Notes:
- Base: Adults aged 16+ who have purchased over the internet in the last 12 months in Great Britain
Download this chart Figure 9c: Considerations made before shopping online by age group, 2016, Great Britain
Image .csv .xlsAdults who had bought or ordered goods or services online were asked about problems they may have encountered. Generally, problems experienced were similar across all age groups with the exception of speed of delivery being slower than indicated, which was a bigger reported issue for the younger age groups than the older age groups. The most common problem encountered was technical failure of website during ordering or payment, at 32%. Problems with fraud were encountered by 5% of adults who had purchased online, in 2016. However, 44% of those who had purchased online reported that they had not encountered any problems.
Although fewer of those aged 65 and over purchased online compared with the 16 to 24 age group, the majority of the older age group reported no problems with their purchase experience.
In 2016, when purchasing online the location of seller was predominantly in the UK, at 93%, with sellers in other EU countries at 28% and the rest of the world at 27%. Since 2015, EU sellers have seen a 3 percentage point increase while UK and the rest of the world sellers are up by 1 percentage point.
Back to table of contents9. Internet security, awareness and storage
In 2016, adults were asked about awareness of internet security issues. Of those who had used the internet in the last 12 months, 67% were aware that cookies can be used to trace online activity and 40% had changed internet browser settings to prevent or limit the amount of cookies (Figure 10).
Figure 10: Internet security awareness, by age group, 2016, Great Britain
Source: Office for National Statistics
Notes:
- Base: Adults aged 16+ who have used the internet in the last 12 months in Great Britain
Download this chart Figure 10: Internet security awareness, by age group, 2016, Great Britain
Image .csv .xlsRespondents were asked about providing personal information online and how they managed access to their personal information on the internet. Personal details, contact details and payment details had been provided by 8 in 10 adults who had used the internet in the last 12 months (Figure 11).
Regarding activities carried out to manage personal information online in 2016, more than half (52%) of adults who had used the internet in the last 12 months refused to allow the use of personal information for advertising purposes and checked that the website requesting personal information was a secure website (51%) (Figure 12).
Figure 11: Personal information provided online by age group, 2016, Great Britain
Source: Office for National Statistics
Notes:
- Base: Adults aged 16+ who have used the internet in the last 12 months in Great Britain
Download this chart Figure 11: Personal information provided online by age group, 2016, Great Britain
Image .csv .xls
Figure 12: Activities used to manage personal information online by age group, 2016, Great Britain
Source: Office for National Statistics
Notes:
- Base: Adults aged 16+ who have used the internet in the last 12 months in Great Britain
Download this chart Figure 12: Activities used to manage personal information online by age group, 2016, Great Britain
Image .csv .xlsThe awareness of internet storage space has grown in recent years with services such as iCloud, Dropbox and Google Drive available for free. In 2016, 40% of adults had used such services, unchanged from 2015.
The youngest age groups, adults aged 16 to 24 and 25 to 34, had the highest proportion using internet storage space, at 54%.
Back to table of contents10. Household internet access
Figure 13: Households with internet access, 1998 to 2016, Great Britain
Source: Office for National Statistics
Notes:
- Estimates were published on a quarterly basis from 1988 to 2004. See http://webarchive.nationalarchives.gov.uk/20160105160709/http://www.ons.gov.uk/ons/rel/rdit2/internet-access---households-and-individuals/historical-internet-access/index.html
- 2015 and 2016 estimates relate to January, February and April. Previous estimates relate to January to March, except 1998 which relates to April to June and 2005 which relates to May.
- During 2005, estimates were published at irregular intervals as Topic Based Summaries. These are no longer available on the ONS website.
Download this chart Figure 13: Households with internet access, 1998 to 2016, Great Britain
Image .csv .xlsIn 2016, 89% of households in Great Britain (23.7 million) had an internet connection. This was up from 86% in 2015 and 57% in 2006 (as shown in Figure 13). Household internet access has increased since we first began collecting these statistics in 1998.
There were changes in the survey source, periodicity and coverage between 1998 and 2005. This means that the estimates prior to 2006 are not directly comparable with the annual estimates from 2006 onwards, but they have been provided as our best available indication of growth over this period.
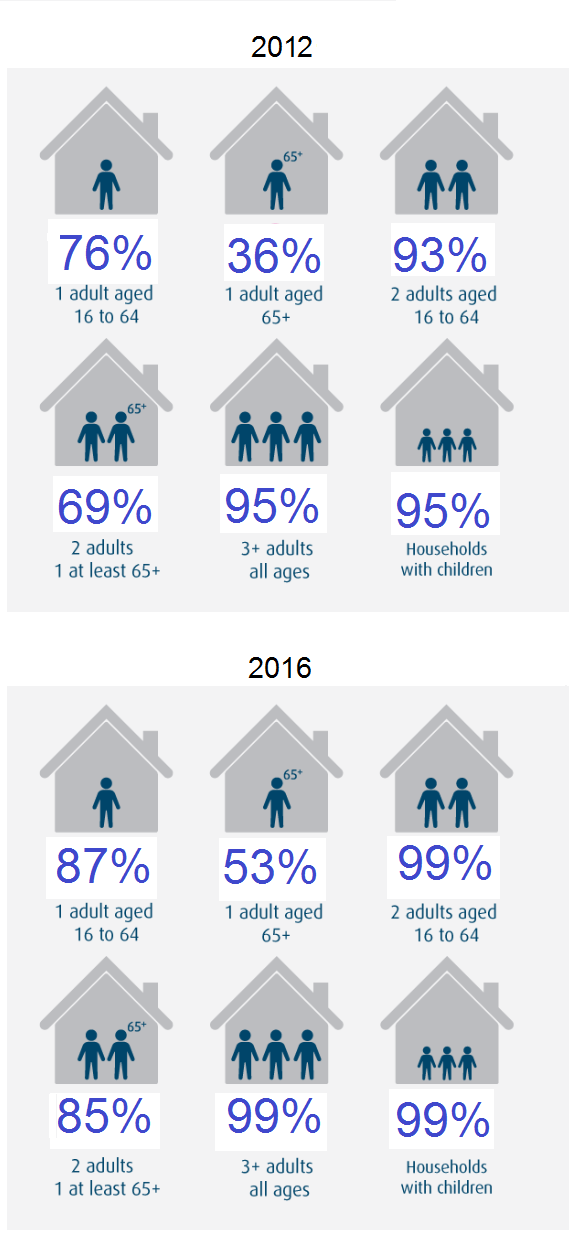
Figure 14: Internet connection by household composition in Great Britain, 2012 and 2016
Source: Office for National Statistics
Notes:
- Base: Households in Great Britain
Download this image Figure 14: Internet connection by household composition in Great Britain, 2012 and 2016
.png (130.3 kB) .xls (18.9 kB)
Internet access varies depending on household composition. Nearly all households with children have an internet connection (99%). Access to the internet by single adult households varies considerably depending on age. For households with one adult aged 65 or over, only 53% had internet access. In contrast 87% of households with only one adult aged 16 to 64 years, had internet access (Figure 14). The vast majority of households with internet access had fixed broadband, such as DSL, cable or optical fibre (93%). Mobile broadband via mobile phone networks was used by 30% of households, as an internet connection.
In 2016, of the 11% of households in Great Britain with no internet access, 21% reported that this was due to a lack of skills. Further barriers reported included equipment costs being too high and access costs being too high (both 9%), while 59% of households without internet access reported that this was because they didn’t need it.
Back to table of contents11. Household internet access across Great Britain
Internet access by households across Great Britain was highest in London and the South East of England at 94%. Since 2006 household internet access in Great Britain has increased by 31 percentage points, with increases seen across all regions and countries. The largest rise was in Scotland increasing from 48% in 2006 to 87% in 2016. Differences in household internet access across the regions and countries have narrowed. In 2006 the difference between the highest (66%) and lowest (48%) was 18 percentage points, compared with a difference of 10 percentage points in 2016 (Figures 15 and 16).
Figure 15: Household internet access by country or region, 2006 and 2016, Great Britain

Source: Office for National Statistics
Notes:
- Base: Households in Great Britain.
Download this image Figure 15: Household internet access by country or region, 2006 and 2016, Great Britain
.png (334.4 kB) .xls (28.2 kB)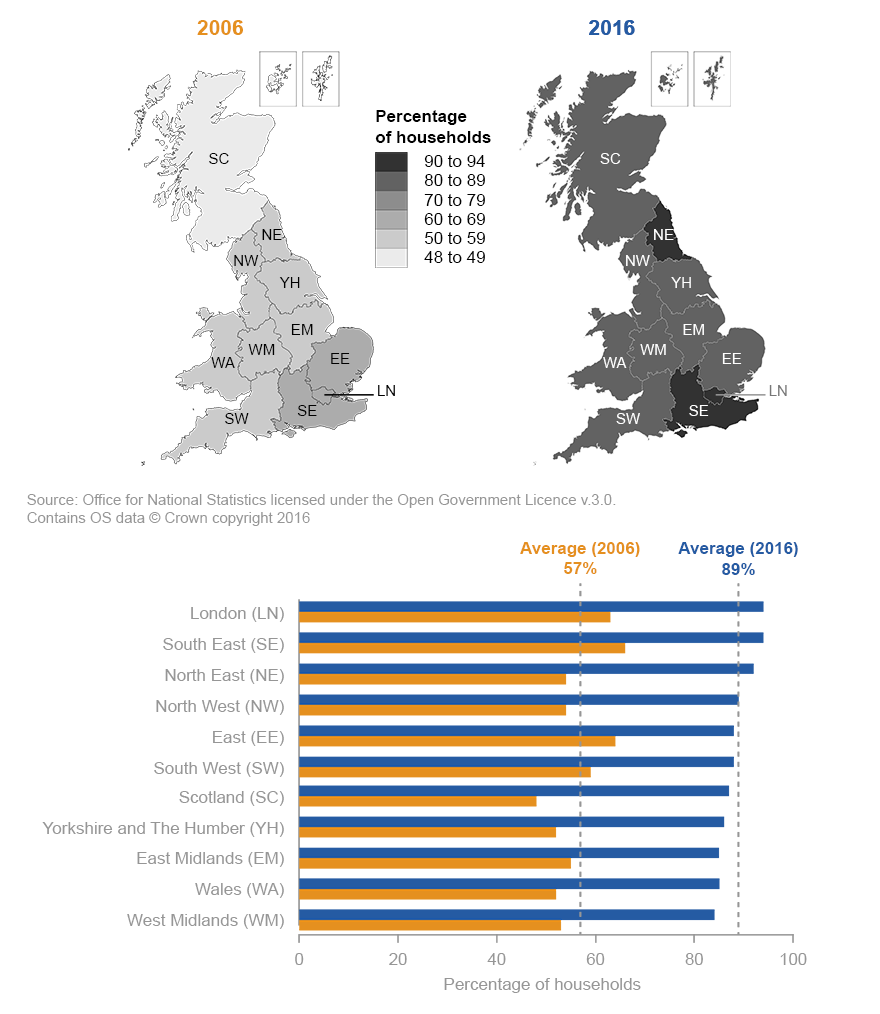
Figure 16: Percentage point change in household internet access by country or region, Great Britain 2006 to 2016
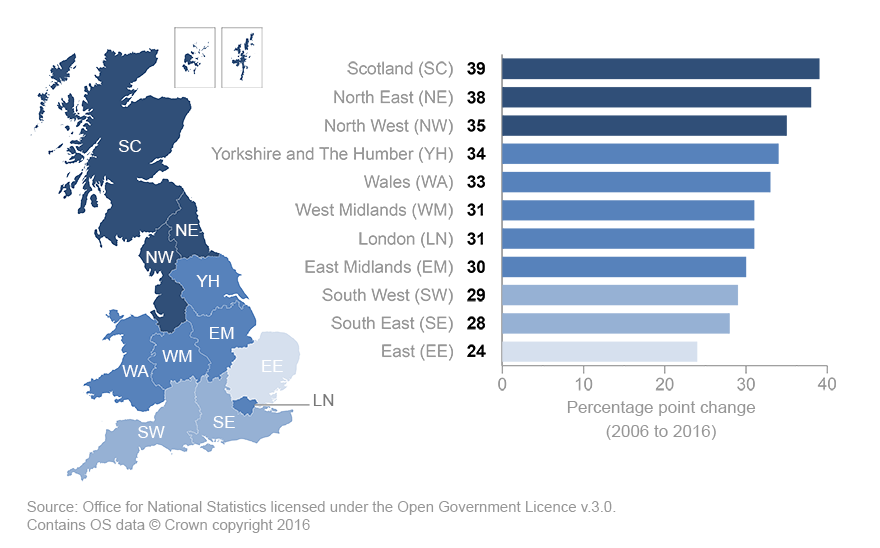
Source: Office for National Statistics
Notes:
- Base: Households in Great Britain
Download this image Figure 16: Percentage point change in household internet access by country or region, Great Britain 2006 to 2016
.png (257.7 kB) .xls (27.6 kB)
12. Your views matter
We are constantly aiming to improve this release and its associated commentary. We would welcome any feedback you might have and would be particularly interested in knowing how you make use of the data to inform your work. Please contact us via email: esociety@ons.gov.uk or telephone Cecil Prescott on +44 (0)1633 456767.
Back to table of contents13. Main issues specific to this bulletin
This statistical bulletin contains information about how adults use the internet and households with internet access. The source of this information is the Opinions and Lifestyle Survey (OPN). The OPN is a multi-purpose survey developed by us for use by government departments, other public bodies, charities, academics and the media. It provides a fast, cost effective and reliable way of obtaining information on topics too brief to warrant their own survey. A random sample of about 1,800 adults aged 16 and over, living in private households throughout Great Britain, is selected each month the survey takes place. After accounting for refusals and where no contact can be made, approximately 1,000 interviews are conducted each month. For general information on the survey, telephone +44 (0)1633 455810, email: opinions@ons.gov.uk.
The annual release of estimates of internet access began in 2006. Internet access results were originally published from 1998 onwards. Between 1998 and 2006, the results were published more frequently, but were based on smaller sample sizes. There were also various changes made to the survey in this earlier period. Some historical internet access estimates published before 2006 are available on our website. However, any comparisons between estimates in this release and those published prior to 2006 should be made with caution.
Back to table of contents14. Quality and Methodology
A quality report for the internet access is available on our website.
The voluntary nature of the survey means that people who do not wish to take part in the survey can refuse to do so.
The sample is designed to ensure that the results of the survey represent the population. The risk of the survey not being representative is likely to increase with every refusal or non-contact with a sampled household (survey non-response). One measure of the quality of survey results is therefore the response rate. The response rate for 2016 was 54%, the rate of refusals was 36% and 8% of the sample could not be contacted.
Rounding
Comparisons of estimates over time may be impacted by independently rounded estimates.
Calibration
Weights are used in the analysis of the OPN survey data, for both households and for individuals. Each respondent to the survey is assigned a weight, which is the number of adults or households that this person represents. These weights are derived by calibration, using population estimates for age group by sex and region. The weights are used to improve the accuracy of results by compensating for different response rates for different groups and by reducing the random variation in estimates. As the responses are weighted to population estimates, weighted totals of individuals by age group, sex and region from the survey are guaranteed to match the fixed population totals. However, there are no fixed control totals for the numbers of households, and therefore, estimates relating to the numbers of household with internet access are survey estimates, which are subject to sample variation.
Users and uses of the data
Eurostat (the statistical office of the European Commission) is a key user of these statistics. The UK provides estimates to Eurostat in accordance with the Regulation (EC) No 808/2004 of the European Parliament and of the Council. Eurostat publish comparable data for EU (European Union) countries on the Information Society area of their website.
Within the UK there is also wide interest in these statistics from government and other public bodies, researchers, charities, academics and the media.
The internet access estimates are used to provide information that is consistent with other EU member states, as part of progress towards measuring EU benchmarking indicators. These EU indicators compare the development and use of information and communications technology (ICT) across EU member states, and help to provide a better understanding of the adoption of ICT and the internet by households and individuals at an EU level.
ICT is considered as critical for improving the competitiveness of European industry and, more generally, to meet the demands of society and the economy. Broadband is considered to be important when measuring access to, and use of, the internet, as it offers users the possibility to rapidly transfer large volumes of data and keep access lines open. The take-up of broadband is a key ICT policy-making indicator. Widespread access to the internet via broadband is regarded as essential for the development of advanced services on the internet, such as e-business, e-government or e-learning.
The EU policy framework for ICT is the Digital Agenda for Europe, which is part of the Europe 2020 strategy for smart, sustainable and inclusive growth. It outlines policies and actions aimed at maximising the benefit of the digital era to all sections of society and economy.
International comparison
A comparable survey is run in all countries of the EU and also in some non-EU countries. The measurement of household internet access and adults’ use of the internet is under continuing review and development. Eurostat plays a leading role in this, and each year leads a process whereby the data requirements for the internet access survey in all EU countries are reviewed and updated. Comparative data for EU countries can be found on Eurostat’s website.
Back to table of contents