Table of contents
1. Introduction
From November 2017, the Office for National Statistics (ONS) and Public Health England (PHE) partnership will produce sub-national cancer survival estimates for the Index of cancer survival for Clinical Commissioning Groups in England bulletin (National Statistics). This follows on from working in partnership to collaboratively produce the national cancer survival estimates as published in June 2017.
This report compares the methods that will be applied (from November 2017) in producing these sub-national survival statistics to methods used previously. It does not consider the methodology applied to national cancer survival estimates.
Back to table of contents2. Collaboration
This publication is produced in partnership with Public Health England Cancer Survival Team, part of the National Cancer Registration and Analysis Service (NCRAS).
Back to table of contents

3. Relevance to policy
The official statistics on cancer survival form an evidence base to inform cancer policy and programmes that aim to improve cancer outcomes. The statistics are commissioned by the Department of Health and are used to:
help inform government policy on cancer
provide non-government bodies with accurate and timely data on the disease
provide citizens with accessible data on the disease to help inform debate
To ensure the data are relevant, Office for National Statistics (ONS) and Public Health England (PHE) strive to produce estimates that are timely, accurate and accessible.
Given that a significant gap remains in survival compared with the European average, the Department of Health identified cancer as a specific improvement area for preventing people dying prematurely in the National Strategy (announced in 2011). In 2015, a new five year cancer strategy for England (PDF, 4.90MB) was developed by the Independent Cancer Taskforce. This sets out recommendations for how the NHS can improve cancer outcomes for patients. The new strategy is being reviewed by government bodies.
Survival estimates are used to formulate, monitor and assess health policy and healthcare provision and planning. These estimates feed into the Clinical Commissioning Group (CCG) Indicator Set, which:
“Provides clear, comparative information for CCGs, Health and Wellbeing Boards, local authorities, patients and the public about the quality of health services commissioned by CCGs and the associated health outcomes. The indicators are useful for CCGs and Health and Wellbeing Boards in identifying local priorities for quality improvement and to demonstrate progress that local health systems are making on outcomes.”
The CCG indicator set also contributes to the National Health Service (NHS) Outcomes Framework, which focuses on measuring health outcomes and includes one-year and five-year net survival from colorectal, breast and lung cancers. The NHS Five Year Forward View (2015) set out: “that improvements in outcomes will require action on three fronts: better preventions, swifter access to diagnosis, and better treatment and care for all those diagnosed with cancer.”
Back to table of contents4. Overview of methodological aspects
The cancer survival index provides a convenient, single number that summarises the overall pattern of cancer survival in each Clinical Commissioning Group (CCG), for all cancers combined, for each calendar year. It combines the net survival estimates for each sex, age group and type of cancer: colorectal, lung and breast cancer (in women) separately and all other cancers combined, excluding non-melanoma skin cancer and prostate cancer.
The following elements of cancer survival methodology are compared in Table 1:
the cancer registrations that are included in the analysis (exclusion and inclusion criteria)
the type of survival estimator
the weights used to age-standardise the estimates
the version of International Coding Definition (ICD) used to define cancer sites
the geographic breakdowns included
Table 1: Summary of methods used in the cancer survival index
| Method | Rationale | Outcome |
|---|---|---|
| Exclusion and inclusion criteria | We will continue to use the same criteria that have been historically applied. The method is outlined in the Control of data quality for population – based cancer survival analysis paper (Li R 2014). These are supplemented by further data quality checks proposed by the European Network of Cancer Registrations (ENCR) (Martos C 2014) | No change in method |
| Survival estimation method | We will continue to estimate survival using flexible parametric models for each combination of cancer type, geography and sex. The best-fitting model was historically selected using the Akaike Information Criterion (AIC). We will combine this with model selection using the Bayesian Information Criterion (BIC) and additionally use scaling tests to check for oversensitivity in model selection via AIC and BIC. | No change in modelling approach used for survival estimation. For model selection, we will be using AIC and BIC, with scaling tests. |
| Weights used to age-standardise the estimates | The weights historically used were based on the proportions of cancer diagnoses in England and Wales from 1996 to 1999 in each age group, sex and type of cancer. | We will be moving to weights based on the International Classification of Survival Standard (ICSS) (Corazziari I 2004) for age-standardisation, with additional weighting applied to standardise for sex and cancer type. |
| ICD coding version | Currently, the tumour sites in all ONS's cancer survival, incidence and mortality bulletins are defined using the International Classification of Diseases 10th Revision (ICD10-O2) (Table A9, Appendix 4). Clinical practice and evidence now suggests that a move to ICD-O3 would produce more homogenous cohorts. | No change in method at present. Being considered for future publications. |
| Geographic breakdown | We will continue to produce one-year, five-year and ten-year survival for England, and one-year survival for CCGs. | We will also be producing one-year, five-year and 10-year survival estimates for Sustainability and Transformation Partnerships (STPs) as an intermediate geography between England and CCGs. This replaces the NHS Area Team level, which was last published on 16 December 2014. |
Summary of the International Cancer Survival Standard for age-standardisation
In summary, the main change to methods is the adoption of new weights based on the International Classification of Survival Standard (ICSS). The benefits of incorporating the ICSS weights are:
they are publicly and readily available
these weights are widely used, for example, in the UK by Northern Ireland and Scotland and internationally by the United States National Cancer Institute and by the International Cancer Benchmark Partnership
since they are not specific to a certain country or diagnosis period, these weights could be used more widely in other countries wishing to take the same approach for an all cancers survival index
the ICSS weights continue to vary by tumour type reflecting age distributions of the different cancers
the cancer survival in England statistical bulletin was published in June 2017 with changes in methodology, including the use of the ICSS weights; this change to the index of cancer survival for Clinical Commissioning Groups will bring consistency across Office for National Statistics (ONS) cancer survival estimates.
Adjusting for age, sex and cancer type
To produce the all-cancers combined index, the data need to be standardised by age, sex and cancer type to allow for comparisons across the different populations. ICSS weights (see Table A2) are used to standardise for age, with additional weighting applied to standardise for sex and cancer type. The final ICSS-based weights used can be found in Table A3.
When studying diseases in a population, many of the diseases and their effects are closely related to age. Although comparing survival rates for specific age-groups can be informative, it is often useful to be able to have a summary of survival for every patient in the population diagnosed with a type of cancer. Comparisons using a summary estimate made over time or between geographies can be misleading if the age profiles of the underlying populations are different.
For both the all-cancers survival index and three-cancers survival index, all values were adjusted using the same set of standard weights. This means that the survival index can be compared over time, because the index is adjusted for any changes in the profile of cancer patients by age, sex or type of cancer. This adjustment, or age-sex-cancer type standardisation, is necessary because survival varies widely by all three factors meaning that, without standardisation, changes in survival could result from changes in the profile of cancer patients. For example, overall cancer survival in a given CCG could change simply because of changes in the profile of its cancer patients, even if survival at each age, for each cancer and in each sex did not change.
The survival estimates must be interpreted with care. They do not reflect the survival prospects for any individual cancer patient; they represent the survival for all cancer patients in a given area in a given period of time. The survival estimates also should not be compared across geographies.
Assessing the impact of methodology changes
The data from the most recent Index of cancer survival publication will be used to assess the impact of methodology changes for adults diagnosed in 1999 to 2014 and followed up to 2015.
We have firstly reproduced the survival estimates published in December 2016 (see Table 2) by replicating the weights used. The previous weights were derived from cancer registrations in England and Wales in 1996 to 1999. These data are not publicly available, therefore proportions from registrations in England within the same time period have been recalculated.
Then to assess the impact of the change in weighting, survival estimates using ICSS-based weights have been produced (see Table 3). The weights associated with both analyses can be found in Tables A1 and A3 of Appendix 1.
Survival estimates for the years 2000 onwards will also be published within the November 2017 Index of cancer survival for Clinical Commissioning Groups in England bulletin (published on 29 November 2017), but they might be different to the estimates presented in this paper. This is because a new model is created for each bulletin that relies on data from a different period, which can change the survival estimates of the index for individual years.
What is the impact of changes in aspects of the methodology on sub-national survival estimates?
England level comparison
Table 2 shows the impact from replicating the weights for 1996 to 1999 based on cancer registrations in England only for 1999 and 2014.
The absolute differences range from negative 1.9% to positive 0.3% for breast, lung and colorectal cancer in 1999, with the all-cancers survival estimates being 1.7% lower compared with the published result for England.
Whilst for 2014, the absolute differences range from negative 1.5% to positive 0.4% for the three separate cancers, with the all-cancers survival estimate being less than 1% different (negative 0.8%) compared with the published estimate.
This indicates that there is only a small decrease in all-cancers one-year survival due to small changes to the underlying data (for example, resulting from late registration of cancer diagnoses or more complete follow-up) and/or the use of weights based on England data only.
Table 2: Comparison of one-year survival estimates, adults (aged 15 to 99 years) diagnosed from 1999 to 2014 and followed up to 2015, England
| With (1) the previously published estimates and (2) updated data from Public Health England using replicated 1996 to 1999 weights | ||||||
| 2016 published estimates (1) | PHE dataset and PHE replicated weights (2) | Comparison of survival estimates (2) – (1) | ||||
|---|---|---|---|---|---|---|
| 1999 | 2014 | 1999 | 2014 | 1999 | 2014 | |
| (%) | (%) | (%) | (%) | (%) | (%) | |
| All cancers | 60.6 | 70.4 | 58.9 | 69.6 | -1.7 | -0.8 |
| Breast | 92.8 | 96.5 | 93.1 | 96.9 | 0.3 | 0.4 |
| Colorectal | 69.0 | 77.2 | 68.1 | 76.8 | -0.9 | -0.4 |
| Lung | 24.3 | 36.8 | 22.4 | 35.3 | -1.9 | -1.5 |
| Three main cancers1 | 63.6 | 71.5 | 61.6 | 70.0 | -2.0 | -1.5 |
| Source: Office for National Statistics, National Cancer Registration and Analysis Service – Public Health England | ||||||
| Notes: | ||||||
| 1. The three main cancers are breast (women), colorectal and lung cancer. | ||||||
Download this table Table 2: Comparison of one-year survival estimates, adults (aged 15 to 99 years) diagnosed from 1999 to 2014 and followed up to 2015, England
.xls (27.6 kB)Table 3 shows the impact from applying the ICSS-based weights for the 1999 and 2014 estimates of the cancer survival index.
This indicates that the adoption of the ICSS-based weights does not substantially impact the survival estimates. The all-cancers one-year survival estimate remained the same for 1999 at 60.6%, whilst the ICSS-based estimate was only 1.1% greater than the published result for 2014.
The absolute differences range from negative 0.6% to positive 2.9% for breast, lung and colorectal cancer for 1999, with the range of these differences being smaller for 2014. The largest differences between the original and ICSS-based estimates are evident for colorectal cancer, with estimates being 2.9% higher in the ICSS-based estimates for both 1999 and 2014.
Colorectal and lung cancer survival estimates increase slightly using ICSS-based weights as these give slightly greater weight to the survival estimates for those aged 15 to 64 years than the Public Health England (PHE) replicated 1996 to 1999 weights.
The differences of the previously published estimates and the ICSS-based estimates for five-year and 10-year survival can be found in Appendix 2, whilst the underlying differences in patient counts can be found in Appendix 3.
Table 3: Comparison of one-year survival estimates, adults (aged 15 to 99 years) diagnosed from 1999 to 2014 and followed up to 2015, England
| With (1) the previously published estimates and (3) updated data from Public Health England using the ICSS-based weights | ||||||
| 2016 published estimates (1) | PHE dataset and ICSS-based weights (3) | Comparison of survival estimates (3) – (1) | ||||
|---|---|---|---|---|---|---|
| 1999 | 2014 | 1999 | 2014 | 1999 | 2014 | |
| (%) | (%) | (%) | (%) | (%) | (%) | |
| All cancers | 60.6 | 70.4 | 60.6 | 71.5 | 0.0 | 1.1 |
| Breast | 92.8 | 96.5 | 92.2 | 96.5 | -0.6 | 0.0 |
| Colorectal | 69.0 | 77.2 | 71.9 | 80.1 | 2.9 | 2.9 |
| Lung | 24.3 | 36.8 | 25.4 | 39.1 | 1.1 | 2.3 |
| Three main cancers1 | 63.6 | 71.5 | 63.2 | 71.9 | -0.4 | 0.4 |
| Source: Office for National Statistics, National Cancer Registration and Analysis Service – Public Health England | ||||||
| Notes: | ||||||
| 1. The three main cancers are breast (women), colorectal and lung cancer. | ||||||
Download this table Table 3: Comparison of one-year survival estimates, adults (aged 15 to 99 years) diagnosed from 1999 to 2014 and followed up to 2015, England
.xls (27.6 kB)The minimal differences between the applied methods for the one-year all-cancers index can be viewed across the full time series from 1999 to 2014 in Figure 1.
Figure 1: Comparison of one -year survival for adults diagnosed from 1999 to 2014 and followed up to 2015 in England using different standardisation methodology
Source: Office for National Statistics, National Cancer Registration and Analysis Service – Public Health England
Notes:
- Replicated published estimates are based on England 1996 to 1999 weights.
Download this chart Figure 1: Comparison of one -year survival for adults diagnosed from 1999 to 2014 and followed up to 2015 in England using different standardisation methodology
Image .csv .xlsCCG level comparison
As a result of adopting the ICSS-based weighting, when we consider all the combinations of survival estimates (due to different cancer sites, years of diagnosis and so on), all the replicated results had an absolute difference of less than 9% as evidenced in Table 4.
For example for 2014, the majority (60%) of the replicated results for one-year survival for all cancers only differed from the comparable published estimate by between 1% and 3%. This is equivalent to 126 out of 209 CCGs.
Of the individual cancer type results, the ICSS-based results for breast cancer were most closely replicated to the published results, with the large majority of the estimates being within plus or minus 1% difference. Whilst the 2014 results diverged the most for lung cancer with 28 out of the 209 CCGs having a survival estimate using the new ICSS-based weighting that is more than 5% higher than the equivalent published estimate, up to a maximum of 7.8% higher.
Table 4: Difference between published results and replicated results calculated using International Cancer Survival Standards (ICSS)-based weights
| Cancer Type | Cohort | Number of CCGs (% of CCGs) where the published results are | |||||
|---|---|---|---|---|---|---|---|
| more than 3% lower | between 1% and 3% lower | between 1% lower and 1% higher | between 1% and 3% higher | between 3% and 5% higher | More than 5% higher | ||
| than ICSS-based results | |||||||
| All cancers | 1999 | 16 (8%) | 50 (24%) | 75 (36%) | 65 (31%) | 3 (1%) | 0 (0%) |
| 2014 | 0 (0%) | 1 (0%) | 80 (38%) | 126 (60%) | 2 (1%) | 0 (0%) | |
| Breast | 1999 | 45 (22%) | 83 (40%) | 69 (33%) | 10 (5%) | 2 (1%) | 0 (0%) |
| 2014 | 0 (0%) | 37 (18%) | 164 (78%) | 8 (4%) | 0 (0%) | 0 (0%) | |
| Colorectal | 1999 | 2 (1%) | 13 (6%) | 35 (17%) | 81 (39%) | 78 (31%) | 14 (7%) |
| 2014 | 0 (0%) | 4 (2%) | 11 (5%) | 102 (49%) | 92 (39%) | 10 (5%) | |
| Lung | 1999 | 4 (2%) | 5 (2%) | 25 (12%) | 81 (39%) | 94 (40%) | 11 (5%) |
| 2014 | 1 (0%) | 4 (2%) | 21 (10%) | 51 (24%) | 132 (50%) | 28 (13%) | |
| Three main cancers 1 | 1999 | 9 (4%) | 61 (29%) | 117 (56%) | 22 (11%) | 0 (0%) | 0 (0%) |
| 2014 | 0 (0%) | 6 (3%) | 146 (70%) | 57 (27%) | 0 (0%) | 0 (0%) | |
| Source: Office for National Statistics, National Cancer Registration and Analysis Service – Public Health England | |||||||
| Notes: | |||||||
| 1. The three main cancers are breast (women), colorectal and lung cancer. | |||||||
Download this table Table 4: Difference between published results and replicated results calculated using International Cancer Survival Standards (ICSS)-based weights
.xls (29.7 kB)Funnel plots offer a rapid visual presentation of variation in one-year survival estimates between CCGs, showing how they compare with one-year survival in England and taking account of the inherent variability (precision) of each survival estimate.
Figure 2 compares the replicated estimates for 2014 with the published estimates as an example. On the whole, the results are similar with the distribution of CCGs around the England average being alike.
With the application of new methodology, the England average for one-year survival in 2014 has only increased by 1.1% from 70.4% in the published results to 71.5% in the replicated estimate. Furthermore, there is now a greater number of CCGs with better precision.
Figure 2a: A comparison of the funnel plot of the one-year survival index (%) for all cancers combined for Clinical Commissioning Groups in England, adults (aged 15 to 99 years) diagnosed in 2014
Published estimates
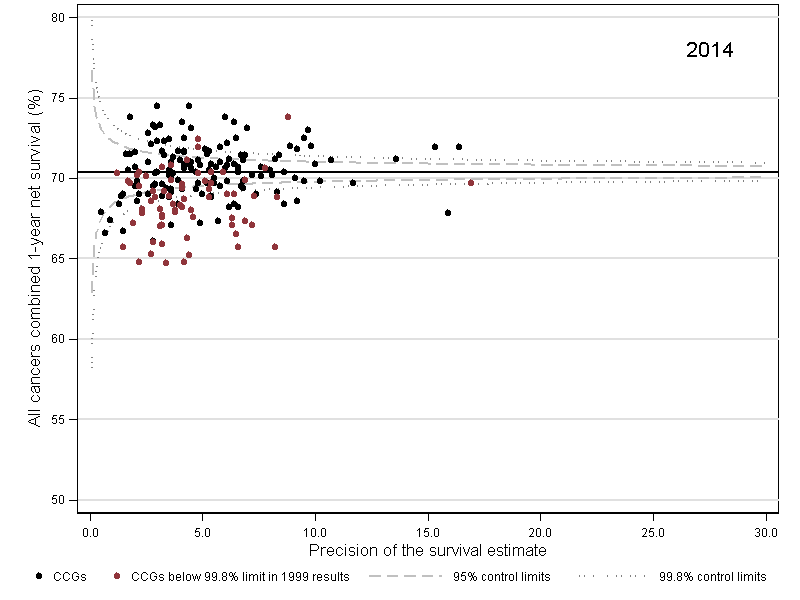
Source: Office for National Statistics, National Cancer Registration and Analysis Service – Public Health England
Download this image Figure 2a: A comparison of the funnel plot of the one-year survival index (%) for all cancers combined for Clinical Commissioning Groups in England, adults (aged 15 to 99 years) diagnosed in 2014
.png (30.3 kB)
Figure 2b: A comparison of the funnel plot of the one-year survival index (%) for all cancers combined for Clinical Commissioning Groups in England, adults (aged 15 to 99 years) diagnosed in 2014
Replicated estimates based on ICSS-based weights
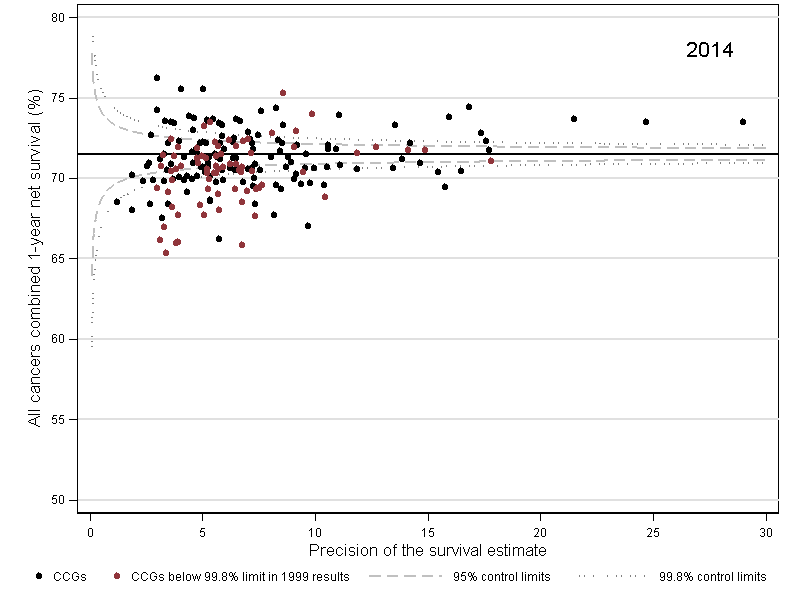
Source: Office for National Statistics, National Cancer Registration and Analysis Service – Public Health England
Download this image Figure 2b: A comparison of the funnel plot of the one-year survival index (%) for all cancers combined for Clinical Commissioning Groups in England, adults (aged 15 to 99 years) diagnosed in 2014
.png (30.0 kB)
In the published results, the one-year survival index for all-cancers ranged from 52.4% to 66.2% across all 209 CCGs in 1999, compared with 49.7% to 66.5% when the estimates have been replicated using ICSS-based weights. Whilst in 2014, the one-year all-cancers survival index ranged from 64.7% to 74.5% compared with 65.3% to 76.2% with the updated weights.
This equates to a 2.9 percentage point increase in the range for 1999 and a 1.1 percentage point increase for 2014. However, by cancer type, the range of estimates for 2014 results has decreased for 2014 in some instances: by 0.1 percentage point for breast but mostly by 4.7 percentage points for colorectal.
The range of these estimates is similar across the cancers as evidenced in Figure 3, which compares the variation of one-year survival estimates by cancer type for 1999 and 2014. This provides a quick visual representation of the distribution of results being similar. Further information on interpreting a box plot can be found in Appendix 5.
Figure 3: Comparison of the variation of Clinical Commissioning Group results for one-year survival for all cancers, England, 1999 and 2014
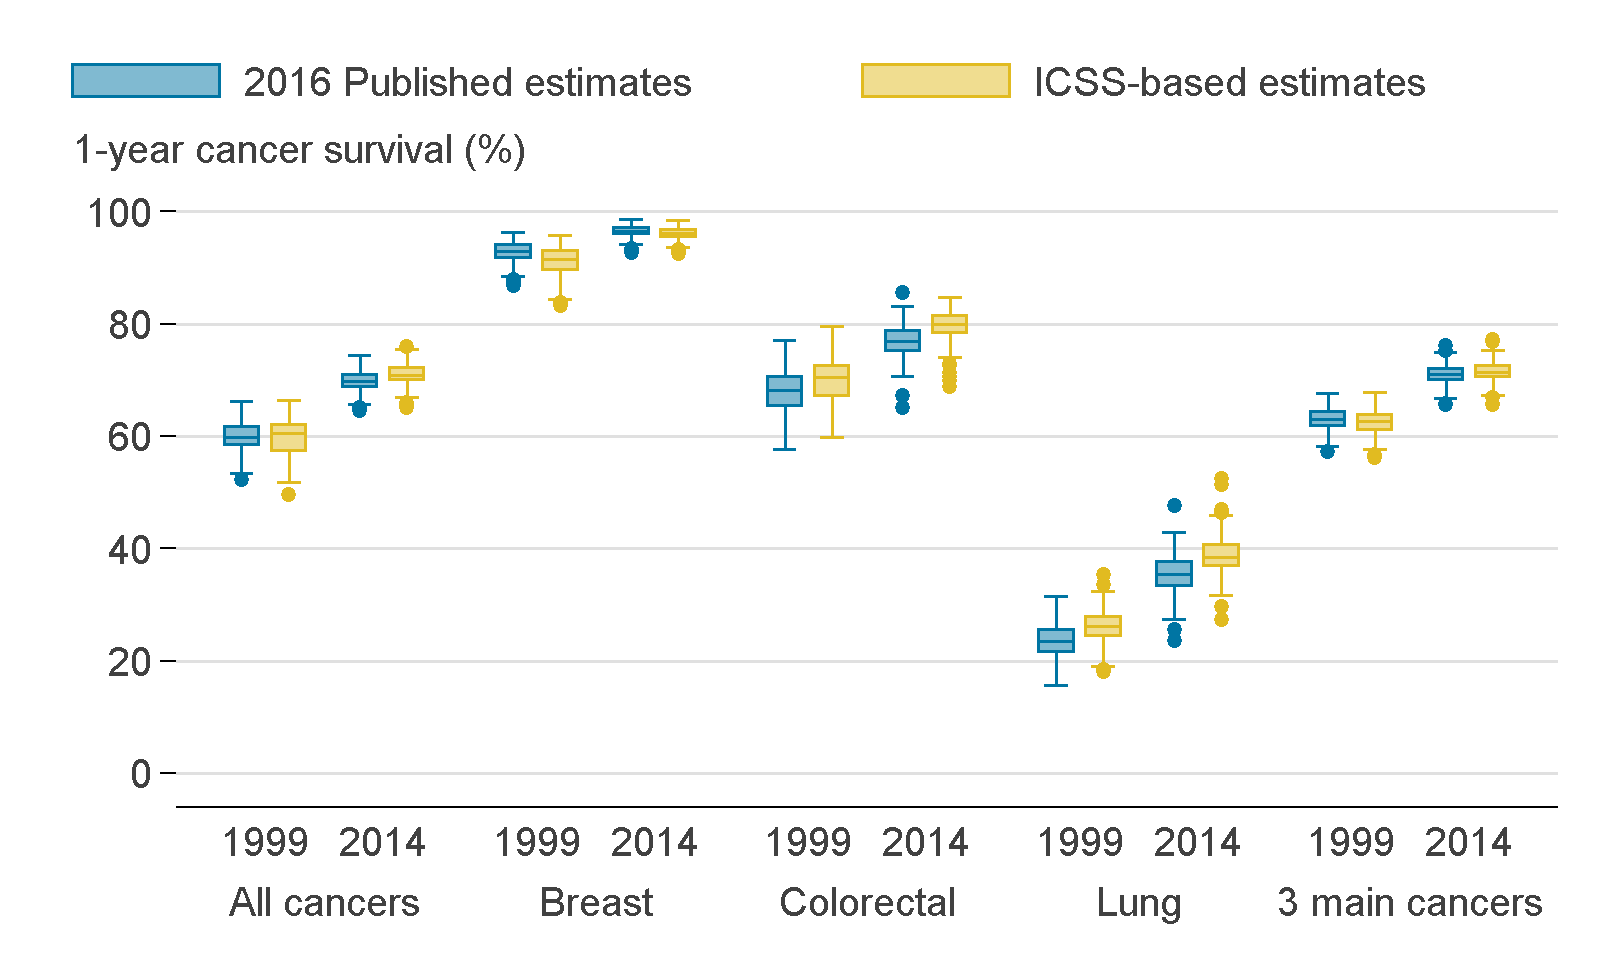
Source: Office for National Statistics, National Cancer Registration and Analysis Service – Public Health England
Download this image Figure 3: Comparison of the variation of Clinical Commissioning Group results for one-year survival for all cancers, England, 1999 and 2014
.png (77.6 kB)
Why does the change in weighting systems result in these differences in the survival estimates?
The change in weighting system results in relatively small differences in the survival estimates. These differences are because a slightly larger or smaller weight is given to each age, sex and cancer type specific survival estimate using the ICSS-based weights compared with the England 1996 to 1999 weights.
The survival of breast, colorectal and lung cancer patients is typically expected to reduce with age (all other considerations being equal). Breast cancer patients diagnosed under the age of 65 years do not experience significantly different age-related survival in contrast to those diagnosed with colorectal and lung cancers.
The differences observed are related to the different weights awarded to patients at different ages. In lung cancer, the published estimates standardise to 0.2% of patients being diagnosed between the ages of 15 and 44 years, whereas the ICSS standardises to 1.2% of patients being diagnosed between the ages of 15 and 44 years. For colorectal cancer, the respective figures for the published estimates are 0.4% and 1.2%.
For breast cancer, the published estimates weighting system gives 9.6% to those aged 65 and over, whereas the ICSS standardises with 7.5% to those aged 65 and over.
For colorectal and lung cancers, the differential in weights given to younger ages is reflected in the size of the increase in survival when the weighting system changes to give a larger emphasis on ages that have better survival. By contrast, the extra emphasis on age groups that exhibit poorer survival explains why breast cancer survival rates decrease slightly when the weighting system changes.
Overall conclusion of effect
A change to using ICSS-based weights results in a small increase in the all-cancers one-year survival index for England. There are also relatively small increases in the survival estimates for individual cancer types. There are some larger changes for individual CCGs, due to the small number of cases diagnosed each year in each age, sex, cancer type and CCG group. However, all CCG differences were smaller than 6% for the all-cancers index and smaller than 9% for individual cancer types. Variation between CCGs was similar.
Back to table of contents5. Which publications will be impacted
To date, we have published a suite of national and sub-national cancer survival publications.
The method changes outlined in this paper will only impact the Index of cancer survival for Clinical Commissioning Groups in England publication.
Improvements in methodology will also be applied to the Geographic patterns of cancer survival in England publication, which will bring the methodology in line with the National Statistics. More information regarding these changes is available.
We have also published national cancer survival estimates at the England level in partnership with Public Health England (PHE), which includes:
6. References
Corazziari I, Quinn M, Capocaccia R (2004), ‘Standard cancer patient population for age standardising survival ratios’, European Journal of Cancer, Volume 40, pages 2,307 to 2,316
Lambert PC and Royston P (2009), ‘Further development of flexible parametric models for survival analysis’, Stata Journal, Volume 9, pages 265 to 290
Li, R and others (2014), ‘Control of data quality for population-base cancer survival analysis’, Cancer Epidemiology, Volume 38, pages 314 to 320
Martos C and others (2014), ‘A proposal on cancer data quality checks: one common procedure for European cancer registries’, European Commission, Joint Research Centre
Royston P, Parmar MK (2002), ‘Flexible parametric proportional-hazards and proportional-odds models for censored survival data, with application to prognostic modelling and estimation of treatment effects’, Stat Med, Volume 21, Issue 15, pages 2,175 to 2,197
Quaresma M, Coleman MP and Rachet B (2014), ‘Funnel plots for population-based cancer survival: principles, methods and applications’, Stat Med, Volume 33, pages 1,070 to 1,080
7. Appendix 1: Weighting
Table A1: Replicating the weights used in the previous publication, registrations in England, 1996 to 1999
| Cancer type | Age group | Male | Female |
|---|---|---|---|
| Breast | 15-44 | - | 0.019 |
| 45-54 | - | 0.038 | |
| 55-64 | - | 0.036 | |
| 65-74 | - | 0.032 | |
| 75-99 | - | 0.043 | |
| Colorectal | 15-44 | 0.002 | 0.002 |
| 45-54 | 0.006 | 0.004 | |
| 55-64 | 0.014 | 0.009 | |
| 65-74 | 0.026 | 0.018 | |
| 75-99 | 0.028 | 0.034 | |
| Lung | 15-44 | 0.001 | 0.001 |
| 45-54 | 0.006 | 0.004 | |
| 55-64 | 0.018 | 0.009 | |
| 65-74 | 0.037 | 0.021 | |
| 75-99 | 0.038 | 0.023 | |
| Other | 15-44 | 0.024 | 0.025 |
| 45-54 | 0.027 | 0.027 | |
| 55-64 | 0.049 | 0.041 | |
| 65-74 | 0.079 | 0.065 | |
| 75-99 | 0.088 | 0.105 | |
| Source: Office for National Statistics, National Cancer Registration and Analysis Service – Public Health England | |||
Download this table Table A1: Replicating the weights used in the previous publication, registrations in England, 1996 to 1999
.xls (27.6 kB)Table A2: International cancer patient population for age-standardising survival ratios
| Population Weights | ||||||
|---|---|---|---|---|---|---|
| Age Standard for Survival | ICSS 1 | ICSS 2 | ICSS 3 | |||
| 15 – 44 years | 0.07 | 0.28 | 0.6 | |||
| 45 – 54 years | 0.12 | 0.17 | 0.1 | |||
| 55 – 64 years | 0.23 | 0.21 | 0.1 | |||
| 65 – 74 years | 0.29 | 0.2 | 0.1 | |||
| 75 – 99 years | 0.29 | 0.14 | 0.1 | |||
| Age Standard for Survival | Population Weights | |||||
| ICSS 4 | ||||||
| 15 – 54 years | 0.19 | |||||
| 55 – 64 years | 0.23 | |||||
| 65 – 74 years | 0.29 | |||||
| 75 – 84 years | 0.23 | |||||
| 85 – 99 years | 0.06 | |||||
| Groups | Sites | |||||
| ICSS 1 | All sites except for those listed in the below groups: | |||||
| ICSS 2 | Nasopharynx, Soft Tissue, Melanoma, Cervix, Brain, Thyroid and Bone | |||||
| ICSS 3 | Testis, Hodgkin, Acute lymphoblastic leukaemia | |||||
| ICSS 4 | Prostate | |||||
| Source: Corazziari I, et al. 2004. “Standard cancer patient population for age standardising survival ratios.” European Journal of Cancer 15: 2307-2316. | ||||||
Download this table Table A2: International cancer patient population for age-standardising survival ratios
.xls (29.7 kB)Table A3: Cancer patient population for standardising by cancer site and sex for the all-cancers combined index
| ICSS-based weights | |||||||||
|---|---|---|---|---|---|---|---|---|---|
| Cancer type | Age group | Male | Female | ||||||
| Age weight | Sex weight | Cancer type weight | Final ICSS- based weight | Age weight | Sex weight | Cancer type weight | Final ICSS- based weight | ||
| Breast | 15-44 | - | - | - | - | 0.070 | 1.000 | 0.167 | 0.012 |
| 45-54 | - | - | - | - | 0.120 | 1.000 | 0.167 | 0.020 | |
| 55-64 | - | - | - | - | 0.230 | 1.000 | 0.167 | 0.038 | |
| 65-74 | - | - | - | - | 0.290 | 1.000 | 0.167 | 0.048 | |
| 75-99 | - | - | - | - | 0.290 | 1.000 | 0.167 | 0.048 | |
| Colorectal | 15-44 | 0.070 | 0.500 | 0.167 | 0.006 | 0.070 | 0.500 | 0.167 | 0.006 |
| 45-54 | 0.120 | 0.500 | 0.167 | 0.010 | 0.120 | 0.500 | 0.167 | 0.010 | |
| 55-64 | 0.230 | 0.500 | 0.167 | 0.019 | 0.230 | 0.500 | 0.167 | 0.019 | |
| 65-74 | 0.290 | 0.500 | 0.167 | 0.024 | 0.290 | 0.500 | 0.167 | 0.024 | |
| 75-99 | 0.290 | 0.500 | 0.167 | 0.024 | 0.290 | 0.500 | 0.167 | 0.024 | |
| Lung | 15-44 | 0.070 | 0.500 | 0.167 | 0.006 | 0.070 | 0.500 | 0.167 | 0.006 |
| 45-54 | 0.120 | 0.500 | 0.167 | 0.010 | 0.120 | 0.500 | 0.167 | 0.010 | |
| 55-64 | 0.230 | 0.500 | 0.167 | 0.019 | 0.230 | 0.500 | 0.167 | 0.019 | |
| 65-74 | 0.290 | 0.500 | 0.167 | 0.024 | 0.290 | 0.500 | 0.167 | 0.024 | |
| 75-99 | 0.290 | 0.500 | 0.167 | 0.024 | 0.290 | 0.500 | 0.167 | 0.024 | |
| Other | 15-44 | 0.070 | 0.500 | 0.500 | 0.018 | 0.070 | 0.500 | 0.500 | 0.018 |
| 45-54 | 0.120 | 0.500 | 0.500 | 0.030 | 0.120 | 0.500 | 0.500 | 0.030 | |
| 55-64 | 0.230 | 0.500 | 0.500 | 0.058 | 0.230 | 0.500 | 0.500 | 0.058 | |
| 65-74 | 0.290 | 0.500 | 0.500 | 0.073 | 0.290 | 0.500 | 0.500 | 0.073 | |
| 75-99 | 0.290 | 0.500 | 0.500 | 0.073 | 0.290 | 0.500 | 0.500 | 0.073 | |
| Source: Office for National Statistics, National Cancer Registration and Analysis Service – Public Health England | |||||||||
Download this table Table A3: Cancer patient population for standardising by cancer site and sex for the all-cancers combined index
.xls (30.2 kB)8. Appendix 2: Survival comparisons
Table A4: Comparison of five-year survival estimates, adults (aged 15 to 99 years) diagnosed from 1999 to 2014 and followed up to 2015, England
| With 1) the previously published estimates and (3) updated data from Public Health England using the ICSS-based weights | ||||||
| 2016 Published estimates (1) | PHE dataset and ICSS-based weights (3) | Comparison of Survival Estimates (3) – (1) | ||||
|---|---|---|---|---|---|---|
| 1999 | 2010 | 1999 | 2010 | 1999 | 2010 | |
| (%) | (%) | (%) | (%) | (%) | (%) | |
| All cancers | 42.5 | 49.9 | 42.3 | 51.1 | -0.2 | 1.2 |
| Breast | 78.5 | 85.8 | 78.3 | 86.3 | -0.2 | 0.5 |
| Colorectal | 48.6 | 57.1 | 50.2 | 59.9 | 1.6 | 2.8 |
| Lung | 6.5 | 10.1 | 7.1 | 12.6 | 0.6 | 2.5 |
| Three main cancers1 | 46.3 | 52.8 | 45.2 | 52.9 | -1.1 | 0.1 |
| Source: Office for National Statistics, National Cancer Registration and Analysis Service – Public Health England | ||||||
| Notes: | ||||||
| 1.The three main cancers are breast (women), colorectal and lung cancer. | ||||||
Download this table Table A4: Comparison of five-year survival estimates, adults (aged 15 to 99 years) diagnosed from 1999 to 2014 and followed up to 2015, England
.xls (27.6 kB)Table A5: Comparison of 10-year survival estimates, adults (aged 15 to 99 years) diagnosed from 1999 to 2014 and followed up to 2015, England
| With (1) the previously published estimates and (3) updated data from Public Health England using the ICSS-based weights | ||||||
| 2016 Published estimates (1) | PHE dataset and ICSS-based weights (3) | Comparison of Survival Estimates (3) – (1) | ||||
|---|---|---|---|---|---|---|
| 1999 | 2005 | 1999 | 2005 | 1999 | 2005 | |
| (%) | (%) | (%) | (%) | (%) | (%) | |
| All cancers | 36.2 | 40.3 | 36.9 | 42.2 | 0.7 | 1.9 |
| Breast | 69.1 | 74.8 | 70.7 | 77.1 | 1.6 | 2.3 |
| Colorectal | 41.2 | 46.3 | 45.1 | 50.8 | 3.9 | 4.5 |
| Lung | 3.3 | 4.2 | 5.1 | 7.0 | 1.8 | 2.8 |
| Three main cancers1 | 39.5 | 43.5 | 40.3 | 45.0 | 0.8 | 1.5 |
| Source: Office for National Statistics, National Cancer Registration and Analysis Service – Public Health England | ||||||
| Notes: | ||||||
| 1. The three main cancers are breast (women), colorectal and lung cancer. | ||||||
Download this table Table A5: Comparison of 10-year survival estimates, adults (aged 15 to 99 years) diagnosed from 1999 to 2014 and followed up to 2015, England
.xls (27.6 kB)9. Appendix 3: Patients count comparisons
Table A6: Differences in patient counts for one-year survival, England, 1999 and 2014
| 2016 Published estimates (1) | PHE dataset and ICSS-based weights (3) | Comparison of patient counts (3) – (1) | ||||
|---|---|---|---|---|---|---|
| 1999 | 2014 | 1999 | 2014 | 1999 | 2014 | |
| (n) | (n) | (n) | (n) | (n) | (n) | |
| All cancers | 168,217 | 215,605 | 178,001 | 224,261 | 9,784 | 8,656 |
| Breast | 31,293 | 39,688 | 33,244 | 41,486 | 1,951 | 1,798 |
| Colorectal | 25,294 | 29,573 | 26,920 | 30,712 | 1,626 | 1,139 |
| Lung | 26,566 | 31,507 | 28,955 | 33,021 | 2,389 | 1,514 |
| Three main cancers1 | 83,153 | 100,768 | 89,119 | 105,219 | 5,966 | 4,451 |
| Source: Office for National Statistics, National Cancer Registration and Analysis Service – Public Health England | ||||||
| Notes: | ||||||
| 1. The three main cancers are breast (women), colorectal and lung cancer. | ||||||
Download this table Table A6: Differences in patient counts for one-year survival, England, 1999 and 2014
.xls (27.1 kB)Table A7: Differences in patient counts for five-year survival, England, 1999 and 2010
| 2016 Published estimates (1) | PHE dataset and ICSS-based weights (3) | Comparison of Survival Estimates (3) – (1) | ||||
|---|---|---|---|---|---|---|
| 1999 | 2010 | 1999 | 2010 | 1999 | 2010 | |
| (n) | (n) | (n) | (n) | (n) | (n) | |
| All cancers | 168,217 | 199,216 | 178,001 | 207,770 | 9,784 | 8,554 |
| Breast | 31,293 | 36,030 | 33,244 | 37,893 | 1,951 | 1,863 |
| Colorectal | 25,294 | 29,248 | 26,920 | 30,679 | 1,626 | 1,431 |
| Lung | 26,566 | 29,348 | 28,955 | 30,642 | 2,389 | 1,294 |
| Three main cancers1 | 83,153 | 94,626 | 89,119 | 99,214 | 5,966 | 4,588 |
| Notes: | ||||||
| Source: Office for National Statistics, National Cancer Registration and Analysis Service – Public Health England | ||||||
| Notes: | ||||||
| 1. The three main cancers are breast (women), colorectal and lung cancer. | ||||||
Download this table Table A7: Differences in patient counts for five-year survival, England, 1999 and 2010
.xls (27.1 kB)Table A8: Differences in patient counts for 10-year survival, England, 1999 and 2005
| 2016 Published estimates (1) | PHE dataset and ICSS-based weights (3) | Comparison of Survival Estimates (3) – (1) | ||||
|---|---|---|---|---|---|---|
| 1999 | 2005 | 1999 | 2005 | 1999 | 2005 | |
| (n) | (n) | (n) | (n) | (n) | (n) | |
| All cancers | 168,217 | 178,145 | 178,001 | 186,086 | 9,784 | 7,941 |
| Breast | 31,293 | 34,265 | 33,244 | 35,961 | 1,951 | 1,696 |
| Colorectal | 25,294 | 26,449 | 26,920 | 27,694 | 1,626 | 1,245 |
| Lung | 26,566 | 26,764 | 28,955 | 28,435 | 2,389 | 1,671 |
| Thee main cancers1 | 83,153 | 87,478 | 89,119 | 92,090 | 5,966 | 4,612 |
| Source: Office for National Statistics, National Cancer Registration and Analysis Service – Public Health England | ||||||
| Notes: | ||||||
| 1. The three main cancers are breast (women), colorectal and lung cancer. | ||||||
Download this table Table A8: Differences in patient counts for 10-year survival, England, 1999 and 2005
.xls (27.1 kB)10. Appendix 4: Definition of cancers
Table A9: Codes in the International Classification of Diseases, 10th revision (ICD-10)
| Cancer | ICD-10 code |
|---|---|
| Breast | C50 |
| Colorectal | C18 to C20, C21.8 |
| Lung | C33 and C34 |
| All cancers excluding non-melanoma skin cancer and prostate cancer | C00-97 excluding C44 and C61. |
| Source: World Health Organization. International Classification of Diseases and Related Health Problems, Tenth Revision (ICD-10) and International Classification of Diseases for Oncology, Second Edition (ICD-O). Geneva: World Health Organization. | |
Download this table Table A9: Codes in the International Classification of Diseases, 10th revision (ICD-10)
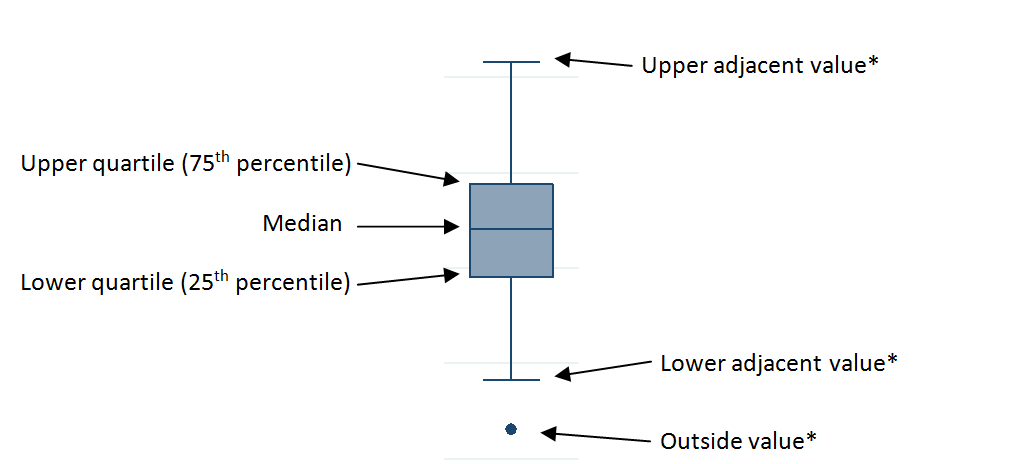
.xls (25.6 kB)11. Appendix 5: Interpretation of a box plot
Figure A1: Example of a box plot
Download this image Figure A1: Example of a box plot
.png (13.0 kB)
If the interquartile range (IQR) equals upper quartile subtract lower quartile, then upper adjacent value, lower adjacent value and outside values are defined as follows:
upper adjacent value: the maximum observed value that is less than upper quartile plus 1.5 multiplied by IQR
lower adjacent value: the minimum observed value that is greater than lower quartile subtract 1.5 multiplied by IQR
outside values: any observed value either greater than upper quartile plus 1.5 multiplied IQR, or less than lower quartile subtract 1.5 multiplied by IQR