Table of contents
- Main points
- Statistician’s comment
- Overview of crime
- Things you need to know about this release
- What is happening to trends in fraud?
- Latest violent crime figures continue to present a complex picture
- Offences involving weapons recorded by the police continue to rise
- What is happening to theft?
- What’s happened to the volume of crime handled by the police?
- Other related figures
- New and upcoming changes to this bulletin
- Quality and methodology
1. Main points
Our assessment of the main data sources is that levels of crime have continued to fall consistent with the general trend since the mid-1990s. However, these figures cover a broad range of offence types and not all offence types showed falls.
The Crime Survey for England and Wales (CSEW) shows that many of the high-volume crimes, such as lower harm violent crime, criminal damage and most types of theft, were either estimated to be at levels similar to the previous year or to have fallen. It also shows that crime is not a common experience for most people, with 8 in 10 adults surveyed by the CSEW not being a victim of any of the crimes asked about in the survey.
Other data sources including police data on the number of crimes recorded, show evidence of increases in some of the less frequently occurring, but higher-harm offences. These rises were relatively low in volume and were more than offset by falls seen across other higher-volume offence types shown by the CSEW.
One of the largest contributions to the decline in estimated crime from the CSEW was in fraud and computer misuse offences, where the first year-on-year comparisons showed a fall of 15%. This is a measure of crimes against the general population and does not cover fraud against businesses. The fall was driven mainly by decreases in consumer and retail fraud, such as offences related to online shopping or fraudulent computer service calls. Estimates of bank and credit account fraud remained at levels similar to the previous year.
Police recorded crime statistics must be interpreted with caution. The police can only record crimes that are brought to their attention and for many types of offence these data cannot provide a reliable measure of levels or trends. However, for some offences, police figures can be useful in informing our understanding of the general picture of crime. This is especially the case for those crimes that generally have high levels of reporting to the police and where audits of recording practices have not highlighted significant concerns about the reliability of the data.
Police recorded crime showed continuing rises in a number of higher-harm violent offences that are not well-measured by the CSEW as they occur in relatively low volumes. This was most evident in offences of knife crime and gun crime; categories that are thought to be relatively well-recorded by the police. The occurrence of these offences tends to be disproportionately concentrated in London and other metropolitan areas.
Police figures also suggest rises in vehicle-related theft and burglary. These are offence types that are less likely to be affected by changes in policing activity and recording practice and are therefore likely to reflect some genuine increases. While these rises have not previously been reflected in the CSEW there are some signs that these increases in vehicle-related thefts may be beginning to appear in the latest estimates.
Back to table of contents2. Statistician’s comment
“These latest figures indicate that levels of crime have continued to fall compared with the previous year, but this picture varied across different types of crime and not all offence types showed falls".
“While overall levels of violent crime were not increasing, there is evidence of rises having occurred in some of the low incidence but more harmful categories such as knife and gun crime".
“The first year-on-year comparisons from new estimates of fraud, one of the most frequently occurring crimes, indicate fewer incidents were experienced by the general population compared with the previous year.”
Mark Bangs, Crime Statistics and Analysis, Office for National Statistics.
Back to table of contents3. Overview of crime
Crime covers a wide spectrum of offences ranging from the most harmful such as murder and serious sexual assault through to minor incidents of criminal damage or petty theft. Given this diversity of circumstances in which crime occurs and the varying frequency at which different types of crime take place, it can never be quantified from any single measure. While we provide a total for each of the main sources of crime statistics, many users are focused on specific types of crime and, as such, much of the analysis and commentary on trends in this bulletin focuses on specific types of crime.
Crime, by its nature, is often hidden and can be inherently difficult to measure; therefore official statistics cannot provide a full count of all crime taking place in society. The Crime Survey for England and Wales (CSEW) has long been considered the most reliable indicator of the more common forms of crime experienced by the general population because it has used a consistent method over time. It also reveals more crime than is recorded by the police because much crime does not come to their attention.
While the CSEW provides a good measure of long-term trends for a selected range of crimes, it does not cover all crimes. In particular, since it is a general population survey it does not cover crimes against businesses or those not resident in households (for example, people living in institutions or short-term visitors). The CSEW is also not well-suited to measuring trends in some of the most harmful crimes, such as serious violence, because they occur in relatively low volumes. For example, for every million people there were around 115 known cases of violent offences involving a gun in the last year. As the CSEW sample size is relatively small, estimates of less frequently-occurring crime types can be subject to substantial variability making it difficult to discern short-term trends.
The other main source used in this bulletin is the number of crimes reported to and recorded by the police. These figures are principally a measure of the level of crime-demand on the police and are useful in assessing how caseload has changed both in volume and nature over time.
As a measure of crime, these police figures must be interpreted with caution as they can only cover cases that are brought to the attention of the police. For many types of offence, police recorded crime data cannot provide a reliable measure of levels or trends in crime as they can be affected by varying policing priorities, activity and changes in crime-recording practices. As a result, police recorded crime data are not designated as National Statistics. However, for some types of crime less affected by the limitations described previously, the police figures can be a useful supplement to the CSEW and provide insight in areas which the survey does not cover well.
Trends in crime
Crimes covered by the CSEW increased steadily from 1981, when the survey began, before peaking in 1995. Since then, there have been substantial falls across most forms of crime covered by the survey. The main drivers have been declines in high-volume property crimes such as vehicle-related theft and criminal damage. While the latest CSEW estimate of 10.6 million crimes against the household population seems like a big number, in the context of the overall population, becoming the victim of crime is not a common experience for most people. The survey shows that the large majority of adults (8 in 10) were not a victim of any of the crimes asked about in the survey in the previous 12 months. Including new estimates of fraud and computer misuse, around 2 in 10 adults were victims of one of the crimes asked about in the latest survey year. This compares with around 4 in 10 adults in 1995, before the survey included fraud and computer misuse in its coverage, illustrating that the likelihood of being a victim has fallen considerably over time (Figure 1).
Figure 1: Crime estimated by the survey has fallen considerably from the peak levels seen in 1995
England and Wales, year ending December 1981 to year ending September 2017
Source: Crime Survey for England and Wales
Notes:
- Crime Survey for England and Wales (CSEW) data on this chart refer to different time periods: a) 1981 to 1999 refer to crimes experienced in the calendar year (January to December) b) from year ending March 2002 onwards the estimates relate to crimes experienced in the 12 months before interview, based on interviews carried out in that financial year (April to March).
- CSEW data relate to adults aged 16 and over or to households.
- Until the Office for Statistics Regulation has had time to assess the new estimates on fraud against the Code of Practice for Statistics estimates will be classified as Official Statistics rather than National Statistics.
- New victimisation questions on fraud and computer misuse were incorporated into the CSEW from October 2015. Up to the year ending September 2017 the questions were asked of half the survey sample. From October 2017 onwards the questions are being asked of a full survey sample.
Download this chart Figure 1: Crime estimated by the survey has fallen considerably from the peak levels seen in 1995
Image .csv .xlsThe latest estimates from the CSEW show that most of the high-volume crimes were either at levels similar to the previous year or showed continued falls. CSEW data show that violent crime, criminal damage and most forms of theft showed no statistically significant change1 compared with the previous year.
These latest estimates include incidents of fraud and computer misuse, which were introduced to the survey in October 2015. As we now have two full years of survey data including these newly measured crime types, we are able to compare these estimates year-on-year. Such comparisons indicate that fraud and computer misuse measured by the CSEW fell by 15% compared with the previous year. These were principally driven by decreases in consumer and retail fraud such as offences related to online shopping or fraudulent computer service calls. Estimates of bank and credit account fraud remained at levels similar to the previous year. The volume of fraud and computer misuse estimated by the CSEW makes this the most prevalent crime covered by the survey; around 1 in 10 adults fell victim in the previous 12 months.
While recent estimates from the CSEW show that most of the higher volume crimes either fell or were at a similar level to the previous year, the police recorded continuing rises in a number of higher-harm violent offences that are not well-measured by the survey. This was most evident in the relatively low volume offences such as knife crime (up 21% to a total of 37,443 recorded offences) and gun crime (up 20% to 6,694 recorded offences). The occurrence of these offences tends to be disproportionately concentrated in London and other metropolitan areas. While it is possible that improved recording and more proactive policing has contributed to this rise, it is our judgement that there have also been genuine increases.
The total number of homicides recorded by the police fell by 1%. However, recent trends have been affected by the recording of incidents where there were multiple victims such as the terrorist attacks in London and Manchester and events at Hillsborough in 1989. If these cases are excluded the latest figures show that there were 57 more homicides than the previous year, a 10% rise up to a total of 650. It is too early to judge whether this represents a change to the long-term downward trend.
While, for many types of offence, police recorded crime figures are not thought to provide a reliable measure of trends in crime, certain crimes are thought to be less affected by changes in policing activity and recording practice. The police recorded rises in a number of these categories including vehicle-related theft offences (up 18%) and burglary (up 8%). These are crime types that generally have high levels of reporting to the police by victims. While recording improvements may have contributed to these rises, the impact of these is thought to be less pronounced than in other crime types, as audits of crime-recording practices have not highlighted significant concerns. Thus, we think increases seen in these offence types are likely to reflect some real changes in crime.
While these rises have not previously been reflected in the CSEW, there are some signs that the increases in vehicle-related thefts are beginning to appear in the latest survey estimates. Further changes are expected to feed through into future CSEW estimates and this would represent a reversal of a long-term decline in such crimes.
Supplementing the CSEW with police recorded crime statistics, the available evidence suggests that crime levels have continued to fall compared with the previous year and that the general public’s risk of being a victim of crime continued to decline. Below the top-line figures lies variation in trends and rates of victimisation by area and personal characteristics. While most high-volume crime types were either estimated to have fallen or be at levels similar to the previous year, police figures show evidence of relatively small upward pressures in some forms of property crime and in some of the lower volume, but highest-harm offences of homicide, and gun and knife crime.
Further information on why the two data sources are showing differing trends was previously published in the methodological note, Why do the two data sources show differing trends? and more information is available in the User Guide to Crime Statistics for England and Wales.
More detailed analysis by crime type is provided in sections 5 to 10 of this bulletin.
Headline CSEW and police recorded crime figures
Table 1a: Crime Survey for England and Wales incidence rates and numbers of incidents for year ending September 2017 and percentage change1
| England and Wales | Adults aged 16 and over/households | |||||||||
| October 2016 to September 2017 compared with: | ||||||||||
|---|---|---|---|---|---|---|---|---|---|---|
| Offence group2 | Oct '16 to Sep '17 | Jan '95 to Dec '95 | Apr '06 to Mar '07 | Apr '11 to Mar '12 | Oct '15 to Sep '16 | |||||
| Rate per 1,000 population3 | Number of incidents (thousands)4 | Number of incidents - percentage change and significance5 | ||||||||
| Violence | 26 | 1,185 | -69 | * | -44 | * | -32 | * | -11 | |
| with injury | 12 | 545 | -76 | * | -51 | * | -40 | * | -12 | |
| without injury | 14 | 640 | -59 | * | -35 | * | -24 | * | -11 | |
| Robbery | 3 | 142 | -58 | * | -55 | * | -42 | * | 0 | |
| Theft offences6 | : | 3,402 | -71 | * | -40 | * | -36 | * | -4 | |
| Theft from the person | 8 | 386 | -43 | * | -31 | * | -36 | * | 6 | |
| Other theft of personal property | 13 | 604 | -71 | * | -46 | * | -43 | * | -21 | * |
| Unweighted base - number of adults | 34,825 | 34,825 | ||||||||
| Domestic burglary | 27 | 664 | -72 | * | -34 | * | -28 | * | -3 | |
| in a dwelling | 19 | 479 | -72 | * | -32 | * | -31 | * | -2 | |
| in a non-connected building to a dwelling | 8 | 185 | -72 | * | -38 | * | -20 | * | -6 | |
| Other household theft | 24 | 580 | -63 | * | -34 | * | -48 | * | -6 | |
| Unweighted base - number of households | 34,755 | 34,755 | ||||||||
| Vehicle-related theft | 46 | 883 | -79 | * | -46 | * | -26 | * | 6 | |
| Unweighted base - number of vehicle owners | 27,847 | 27,847 | ||||||||
| Bicycle theft | 23 | 285 | -57 | * | -38 | * | -36 | * | 1 | |
| Unweighted base - number of bicycle owners | 16,507 | 16,507 | ||||||||
| Criminal damage | 46 | 1,125 | -66 | * | -61 | * | -44 | * | -6 | |
| Unweighted base - number of households | 34,755 | 34,755 | ||||||||
| All CSEW crime6 | : | 5,855 | -69 | * | -46 | * | -37 | * | -6 | * |
| Fraud and computer misuse(OS)7,8 | 102 | 4,742 | .. | .. | .. | -15 | * | |||
| Fraud | 70 | 3,239 | .. | .. | .. | -10 | * | |||
| Bank and credit account fraud | 52 | 2,390 | .. | .. | .. | -3 | ||||
| Consumer and retail fraud9 | 16 | 747 | .. | .. | .. | -20 | * | |||
| Advance fee fraud | 1 | 56 | .. | .. | .. | -53 | * | |||
| Other fraud | 1 | 46 | .. | .. | .. | -57 | * | |||
| Computer misuse | 32 | 1,503 | .. | .. | .. | -24 | * | |||
| Computer virus | 21 | 962 | .. | .. | .. | -26 | * | |||
| Unauthorised access to personal information (including hacking) | 12 | 541 | .. | .. | .. | -19 | ||||
| Unweighted base - number of adults | 16,849 | 16,849 | ||||||||
| All CSEW crime inclusing fraud and computer misuse (OS)10 | .. | 10,597 | .. | .. | .. | -10 | * | |||
| Source: Crime Survey for England and Wales, Office for National Statistics | ||||||||||
| Notes: | ||||||||||
| 1. More detail on further years can be found in Appendix tables A1 and A2. | ||||||||||
| 2. Section 5 of the User Guide provides more information about the crime types included in this table. | ||||||||||
| 3. Rates for violence, robbery, theft from the person and other theft of personal property are quoted per 1,000 adults; rates for domestic burglary, other household theft, and criminal damage are quoted per 1,000 households; rates for vehicle-related theft and bicycle theft are quoted per 1,000 vehicle-owning and bicycle-owning households respectively. | ||||||||||
| 4. Data may not sum to totals shown due to rounding. | ||||||||||
| 5. Statistically significant change at the 5% level is indicated by an asterisk. | ||||||||||
| 6. : denotes not available. It is not possible to construct a rate for all theft offences or CSEW crime because rates for household offences are based on rates per household, and those for personal offences on rates per adult, and the two cannot be combined. | ||||||||||
| 7. 'OS' refers to Official Statistics. Until the Office for Statistics Regulation has had time to assess the new estimates on fraud against the Code of Practice for Statistics estimates will be classified as Official Statistics rather than National Statistics. | ||||||||||
| 8. New victimisation questions on fraud and computer misuse were incorporated into the CSEW from October 2015. Up to the year ending September 2017 the questions were asked of half the survey sample. From October 2017 onwards the questions are being asked of a full survey sample. | ||||||||||
| 9. Non-investment fraud has been renamed as 'Consumer and retail fraud' to reflect the corresponding name change to the Home Office Counting Rules from April 2017 | ||||||||||
| 10. This combined estimate is not comparable with headline estimates from earlier years. For year-on-year comparisons and analysis of long-term trends it is necessary to exclude fraud and computer misuse offences, as data on these are only available for the latest two years. | ||||||||||
Download this table Table 1a: Crime Survey for England and Wales incidence rates and numbers of incidents for year ending September 2017 and percentage change^1^
.xls (268.8 kB)
Table 1b: Crime Survey for England and Wales prevalence rates and numbers of victims for year ending September 2017 and percentage change1
| England and Wales | Adults aged 16 and over/households | ||||||||||
| October 2016 to September 2017 compared with: | |||||||||||
|---|---|---|---|---|---|---|---|---|---|---|---|
| Offence group2 | Oct '16 to Sep '17 | Jan '95 to Dec '95 | Apr '06 to Mar '07 | Apr '11 to Mar '12 | Oct '15 to Sep '16 | ||||||
| Percentage, victims once or more3 | Number of victims (thousands)4 | Numbers of victims - percentage change and significance5 | |||||||||
| Violence | 1.6 | 751 | -61 | * | -42 | * | -32 | * | -9 | ||
| with injury | 0.8 | 361 | -70 | * | -52 | * | -41 | * | -11 | ||
| without injury | 0.9 | 411 | -53 | * | -33 | * | -22 | * | -8 | ||
| Robbery | 0.2 | 108 | -61 | * | -54 | * | -49 | * | -12 | ||
| Theft offences6 | 9.7 | 4,508 | -65 | * | -35 | * | -32 | * | -2 | ||
| Theft from the person | 0.8 | 364 | -44 | * | -28 | * | -36 | * | 7 | ||
| Other theft of personal property | 1.2 | 546 | -67 | * | -43 | * | -40 | * | -18 | * | |
| Unweighted base - number of adults | 34,825 | 34,825 | |||||||||
| Domestic burglary | 2.2 | 545 | -70 | * | -33 | * | -27 | * | 1 | ||
| in a dwelling | 1.6 | 387 | -71 | * | -33 | * | -30 | * | 2 | ||
| in a non-connected building to a dwelling | 0.7 | 165 | -70 | * | -34 | * | -19 | * | 0 | ||
| Other household theft | 1.9 | 474 | -56 | * | -29 | * | -45 | * | -7 | ||
| Unweighted base - number of households | 34,755 | 34,755 | |||||||||
| Vehicle-related theft | 3.9 | 743 | -75 | * | -43 | * | -25 | * | 5 | ||
| Unweighted base - number of vehicle owners | 27,847 | 27,847 | |||||||||
| Bicycle theft | 2.1 | 263 | -53 | * | -35 | * | -34 | * | 3 | ||
| Unweighted base - number of bicycle owners | 16,507 | 16,507 | |||||||||
| Criminal damage | 3.3 | 811 | -61 | * | -54 | * | -40 | * | -9 | * | |
| Unweighted base - number of households | 34,755 | 34,755 | |||||||||
| All CSEW crime7 | 13.9 | 6,461 | -60 | * | -38 | * | -32 | * | -4 | ||
| Fraud and computer misuse(OS)8.9 | 8.2 | 3,781 | .. | .. | .. | -12 | * | ||||
| Fraud | 5.9 | 2,720 | .. | .. | .. | -7 | |||||
| Bank and credit account fraud | 4.3 | 2,006 | .. | .. | .. | 0 | |||||
| Consumer and retail fraud 10 | 1.5 | 691 | .. | .. | .. | -16 | |||||
| Advance fee fraud | 0.1 | 42 | .. | .. | .. | -54 | * | ||||
| Other fraud | 0.1 | 37 | .. | .. | .. | -57 | * | ||||
| Computer misuse | 2.6 | 1,214 | .. | .. | .. | -23 | * | ||||
| Computer virus | 1.7 | 777 | .. | .. | .. | -27 | * | ||||
| Unauthorised access to personal information (including hacking) | 1.0 | 468 | .. | .. | .. | -16 | |||||
| Unweighted base - number of adults | 16,849 | 16,849 | |||||||||
| All CSEW crime including fraud and computer misuse (OS)11 | 19.7 | 9,133 | .. | .. | .. | -10 | * | ||||
| Source: Crime Survey for England and Wales, Office for National Statistics | |||||||||||
| Notes: | |||||||||||
| 1. More detail on further years can be found in Appendix tables A3 and A8. | |||||||||||
| 2. Section 5 of the User Guide provides more information about the crime types included in this table. | |||||||||||
| 3. Percentages for violence, robbery, theft from the person and other theft of personal property are quoted for adults; percentages for domestic burglary, other household theft, and criminal damage are quoted for households; percentages for vehicle-related theft and bicycle theft are quoted for vehicle-owning and bicycle-owning households respectively. | |||||||||||
| 4. Where applicable, numbers in sub-categories will not sum to totals, because adults/households may have been a victim of more than one crime. | |||||||||||
| 5. Statistically significant change at the 5% level is indicated by an asterisk. | |||||||||||
| 6. This is the estimated percentage/number of adults who have been a victim of at least one personal theft crime or have been resident in a household that was a victim of at least one household theft crime. | |||||||||||
| 7. This is the estimated percentage/number of adults who have been a victim of at least one personal crime or have been resident in a household that was a victim of at least one household crime. | |||||||||||
| 8. 'OS' refers to Official Statistics. Until the Office for Statistics Regulation has had time to assess the new estimates on fraud against the Code of Practice for Statistics estimates will be classified as Official Statistics rather than National Statistics. | |||||||||||
| 9. New victimisation questions on fraud and computer misuse were incorporated into the CSEW from October 2015. Up to the year ending September 2017 the questions were asked of half the survey sample. From October 2017 onwards the questions are being asked of a full survey sample. | |||||||||||
| 10. Non-investment fraud has been renamed as 'Consumer and retail fraud' to reflect the corresponding name change to the Home Office Counting Rules from April 2017 | |||||||||||
| 11. This combined estimate is not comparable with headline estimates from earlier years. For year-on-year comparisons and analysis of long-term trends it is necessary to exclude fraud and computer misuse offences, as data on these are only available for the latest two years. | |||||||||||
Download this table Table 1b: Crime Survey for England and Wales prevalence rates and numbers of victims for year ending September 2017 and percentage change^1^
.xls (269.8 kB)
Table 2: Police recorded crimes in England and Wales - rate, number and percentage change for year ending September 20171,2,3
| England and Wales | ||||||
| Offence group | Oct '16 to Sep '17 | Oct '16 to Sep '17 compared with: | ||||
|---|---|---|---|---|---|---|
| Rate per 1,000 population | Number of offences | Apr '06 to Mar '07 | Apr '11 to Mar '12 | Oct '15 to Sep '16 | ||
| Number of offences - percentage change | ||||||
| Victim-based crime | 70 | 4,068,662 | -15 | 18 | 14 | |
| Violence against the person offences | 22 | 1,291,405 | 58 | 106 | 20 | |
| Homicide | 0 | 685 | -10 | 24 | -1 | |
| Death or injury - unlawful driving4 | 0 | 717 | 50 | 72 | 5 | |
| Violence with injury5 | 8 | 492,394 | -3 | 46 | 9 | |
| Violence without injury6 | 9 | 535,150 | 114 | 125 | 24 | |
| Stalking and harrassment7 | 4 | 262,459 | 351 | 427 | 36 | |
| Sexual offences | 2 | 138,045 | 146 | 162 | 23 | |
| Rape | 1 | 48,773 | 254 | 204 | 29 | |
| Other sexual offences | 2 | 89,272 | 111 | 143 | 20 | |
| Robbery offences | 1 | 68,968 | -32 | -8 | 29 | |
| Robbery of business property | 0 | 7,049 | -25 | 4 | 31 | |
| Robbery of personal property | 1 | 61,919 | -33 | -9 | 29 | |
| Theft offences | 34 | 1,986,709 | -25 | -4 | 11 | |
| Burglary | 7 | 433,110 | -30 | -14 | 8 | |
| Domestic burglary8 | 4 | 261,915 | .. | .. | .. | |
| Non-domestic burglary8 | 3 | 171,195 | .. | .. | .. | |
| Vehicle offences | 8 | 443,577 | -42 | 6 | 18 | |
| Theft of a motor vehicle9 | 2 | 106,664 | -45 | 16 | 21 | |
| Theft from a vehicle | 5 | 276,823 | -45 | -8 | 15 | |
| Interfering with a motor vehicle | 1 | 60,090 | -13 | 140 | 28 | |
| Theft from the person | 2 | 95,684 | -17 | -5 | 12 | |
| Bicycle theft | 2 | 103,635 | -6 | -11 | 18 | |
| Shoplifting | 7 | 383,178 | 30 | 24 | 10 | |
| All other theft offences10 | 9 | 527,525 | -28 | -16 | 9 | |
| Criminal damage and arson | 10 | 583,535 | -50 | -7 | 6 | |
| Other crimes against society | 10 | 600,031 | 12 | 34 | 26 | |
| Drug offences | 2 | 133,755 | -31 | -42 | -6 | |
| Trafficking of drugs | 0 | 25,399 | -4 | -19 | 1 | |
| Possession of drugs | 2 | 108,356 | -35 | -45 | -7 | |
| Possession of weapons offences | 1 | 35,161 | -10 | 48 | 26 | |
| Public order offences | 6 | 344,476 | 46 | 128 | 44 | |
| Miscellaneous crimes against society | 1 | 86,639 | 35 | 93 | 29 | |
| Total fraud offences11 | 11 | 662,519 | .. | 39 | 7 | |
| Total recorded crime - all offences including fraud | 91 | 5,331,212 | -2 | 22 | 14 | |
| Source: Police recorded crime, Home Office | ||||||
| Notes: | ||||||
| 1. Police recorded crime data are not designated as National Statistics. | ||||||
| 2. Police recorded crime statistics based on data from all 44 forces in England and Wales (including the British Transport Police). | ||||||
| 3. Appendix tables A4 and A7 provide detailed footnotes and further years. | ||||||
| 4. Includes causing death or serious injury by dangerous driving, causing death by careless driving when under the influence of drink or drugs, causing death by careless or inconsiderate driving, causing death by driving: unlicensed or disqualified or uninsured drivers, causing death by aggravated vehicle taking. | ||||||
| 5. Includes attempted murder, intentional destruction of viable unborn child, more serious wounding or other act endangering life (including grievous bodily harm with and without intent) and less serious wounding offences. | ||||||
| 6. Includes threat or conspiracy to murder, other offences against children and assault without injury (formerly common assault where there is no injury). | ||||||
| 7. Includes harassment, racially or religously motivated harassment, stalking, malicous communications. | ||||||
| 8. Percentage change figures for Domestic burglary and Non-domestic burglary are not shown as they are affected by classification changes that were introduced from April 2017. It is not currently possible to make meaningful comparisons over time in these sub-categories. Figures for total burglary are unaffected. | ||||||
| 9. Includes theft of motor vehicle and aggravated vehicle taking. | ||||||
| 10. All other theft offences now includes all 'making off without payment' offences recorded since year ending March 2003. Making off without payment was previously included within the fraud offence group, but following a change in the classification for year ending March 2014, this change has been applied to previous years of data to give a consistent time series. | ||||||
| 11. Total fraud offences cover crimes recorded by the National Fraud Intelligence Bureau via Action Fraud, Cifas and Financial Fraud Action UK. Action Fraud have taken over the recording of fraud offences on behalf of individual police forces. Percentage changes compared with year ending March 2007 are not presented, as fraud figures covered only those crimes recorded by individual police forces. Given the addition of new data sources, it is not possible to make direct comparsions with years prior to Year ending March 2012. | ||||||
Download this table Table 2: Police recorded crimes in England and Wales - rate, number and percentage change for year ending September 2017^1,2,3^
.xls (339.5 kB)Notes for: Overview of crime
- The only headline offence types to show a statistically significant change compared with the previous year were “fraud and computer misuse” and “other theft of personal property”.
4. Things you need to know about this release
Crime statistics and the wider criminal justice system
The crime statistics reported in this release relate to only a part of the wider set of official statistics available on crime and other areas of the criminal justice system such as the outcomes of police investigations; the judicial process including charges, prosecutions and convictions; through to the management of prisons and prisoners.
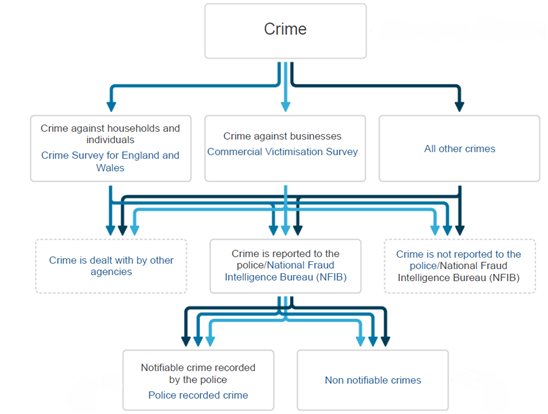
Some of these statistics are published by the Home Office or the Ministry of Justice. We have produced a flowchart depicting the connections between all these different aspects of crime and justice, as well as the statistics available for each area. Figure 2 is an extract from that flowchart and highlights the portion of the process that is covered by statistics included in this release.
Figure 2: Crime and Justice statistics flowchart
Source: Office for National Statistics
Download this image Figure 2: Crime and Justice statistics flowchart
.png (58.9 kB)
Sources included
This bulletin primarily reports data from two main sources of crime data: the Crime Survey for England and Wales (CSEW) and police recorded crime. More information on both these sources can be found in the User Guide to Crime Statistics for England and Wales to crime statistics.
Time periods covered
The latest CSEW figures presented in this release are based on interviews conducted between October 2016 and September 2017, measuring peoples’ experiences of crime in the 12 months before the interview. The latest recorded crime figures relate to crimes recorded by the police during the year ending September 2017 (between October 2016 and September 2017). In this release:
- “latest year” (or “latest survey year”) refers to the (survey) year ending September 2017
- “previous year” (or “previous survey year”) refers to the (survey) year ending September 2016
- any other time period is referred to explicitly
5. What is happening to trends in fraud?
This section focuses on the latest findings and available trends gathered from three main sources of data on fraud:
- incidents of fraud reported to the Crime Survey for England and Wales (CSEW), including both the existing plastic card fraud series and newly introduced questions on fraud and computer misuse
- incidents of fraud referred to the National Fraud Intelligence Bureau (NFIB) by Action Fraud (the public facing national fraud and cybercrime reporting centre) as well as two industry bodies, Cifas and Financial Fraud Action UK (FFA UK, now a constituent part of UK Finance)1, who report instances of fraud where their member organisations have been a victim
- additional data collected by UK Finance on a broader range of bank account and plastic card frauds than those referred to the NFIB, using a system called CAMIS2
In interpreting these data it is important to bear in mind that each source varies in its coverage. CSEW estimates encompass a broad range of fraud offences, including attempts as well as completed ones involving a loss. The number of incidents of fraud estimated by the CSEW is substantially higher than the number of incidents referred to the NFIB, as the survey is able to capture a large volume of lower-harm cases that are less likely to have been reported to the authorities.
In contrast, incidents of fraud referred to the NFIB by Action Fraud will mostly tend to be focused on cases at the more serious end of the spectrum, as by definition they will only include incidents that the victim considers serious enough to report to the authorities. Incidents of fraud referred to the NFIB by Cifas and UK Finance will only include cases where there are viable lines of investigation. As a result, fraud offences referred to the authorities make up a relatively small proportion of the overall volume of fraud. The CSEW suggests that less than one-fifth of incidents of fraud either come to the attention of the police or are reported by the victim to Action Fraud.
Additional administrative data from UK Finance on bank account and plastic card frauds (sourced from their CAMIS system) are able to give us a fuller picture of the extent of fraud that has been identified by financial institutions. These data help us to bridge the gap between the broad coverage provided by the CSEW and the narrower focus of offences referred to the NFIB. Most of the additional offences covered in the CAMIS data fall into the category of “remote purchase fraud”3 and lost or stolen cards, which account for a high proportion of plastic card fraud that is excluded from the NFIB figures.
In this section each of the three sources are discussed in turn. Further information on these sources and the differences between them can be found in Section 5.4 of the User Guide and also in the Overview of fraud and computer misuse statistics article.
Crime Survey for England and Wales
New questions on fraud and computer misuse were introduced to half of the CSEW sample4 from October 2015. Fraud and computer misuse estimates have been incorporated within headline CSEW estimates since the year ending September 2016, when a full year’s data had been collected.
We now have two full years’ worth of data to draw upon, allowing us to look at changes in these estimates over the last two years. Importantly, as this comparison is based on two data points only, caution must be taken in drawing inferences about trends at this early stage.
Results for the survey year ending September 2017 indicate a 15% reduction compared with the previous survey year (down from 5.6 million to 4.7 million incidents) in the total number of fraud and computer misuse offences experienced by adults aged 16 and over in England and Wales. Fraud fell by 10% (down from 3.6 million to 3.2 million incidents) and was driven largely by a volume decrease in “consumer and retail fraud”5– such as fraud related to online shopping or fraudulent computer service calls (down 20% from 0.9 million to 0.7 million offences) (Table 3).
Decreases were also seen in “advance fee fraud” (down 53%, from 0.1 million to 56,000 offences) and “other fraud” (down 57%, from 0.1 million to 46,000 offences). “Bank and credit account fraud”, which accounted for around three-quarters of fraud offences (2.4 million incidents or 74% of total fraud), remained at a similar level to the previous year. Over half of fraud incidents for the latest survey year were cyber-related6 (56% or 1.8 million incidents) (Table E2).
Offences involving computer misuse showed a 24% decrease from the survey year ending September 2016 (down to 1.5 million offences), largely owing to a fall in “computer viruses” (down 26% to 1.0 million offences).
Table 3: Crime Survey for England and Wales fraud and computer misuse - numbers of incidents for year ending September 2016 and year ending September 2017 (Official Statistics)1,2
| England and Wales | Adults aged 16 and over | |||||||
| Offence group | Oct '15 to Sep '16 | Oct '16 to Sep '17 | Percentage change and significance3 | |||||
|---|---|---|---|---|---|---|---|---|
| Number of incidents (thousands) | ||||||||
| Fraud | 3,617 | 3,239 | -10 | * | ||||
| Bank and credit account fraud | 2,452 | 2,390 | -3 | |||||
| Consumer and retail fraud4 | 939 | 747 | -20 | * | ||||
| Advance fee fraud | 118 | 56 | -53 | * | ||||
| Other fraud | 108 | 46 | -57 | * | ||||
| Computer misuse | 1,966 | 1,503 | -24 | * | ||||
| Computer virus | 1,300 | 962 | -26 | * | ||||
| Unauthorised access to personal information (including hacking) | 667 | 541 | -19 | |||||
| Unweighted base - number of adults | 17,862 | 16,849 | ||||||
| Source: Crime Survey for England and Wales, Office for National Statistics | ||||||||
| Notes: | ||||||||
| 1. Until the Office for Statistics Regulation has had time to assess the new estimates on fraud against the Code of Practice for Statistics estimates will be classified as Official Statistics rather than National Statistics. | ||||||||
| 2. New victimisation questions on fraud and computer misuse were incorporated into the CSEW from October 2015. Up to the year ending September 2017 the questions were asked of half the survey sample. From October 2017 onwards the questions are being asked of a full survey sample. | ||||||||
| 3. Statistically significant change at the 5% level is indicated by an asterisk. | ||||||||
| 4. Non-investment fraud has been renamed as 'Consumer and retail fraud' to reflect the corresponding name change to the Home Office Counting Rules from April 2017. | ||||||||
Download this table Table 3: Crime Survey for England and Wales fraud and computer misuse - numbers of incidents for year ending September 2016 and year ending September 2017 (Official Statistics)^1,2^
.xls (260.6 kB)Further findings from the CSEW fraud and computer misuse questions for the year ending September 2017 are presented in Tables E1 and E2.
Previously these estimates of fraud and computer misuse have been classed as experimental. We are satisfied with the work we have done surrounding the quality of the data and have now added these to the total estimate of crime for the survey year ending September 2017. At the same time, we have asked the Office for Statistics Regulation to assess these new estimates for consideration as National Statistics. Until they have been assessed, these new estimates will be classified as official statistics.
Separate questions limited to fraud on plastic cards (bank and credit cards) have been included in a supplementary module of the CSEW since 2005. While they do not collect enough detail to be added to the main crime estimates7 they do provide a useful indication of recent trends in this significant component of fraud8. Latest results from this existing supplementary module show that 5.7% of plastic card owners were victims of card fraud in the latest survey year, a similar level to the previous survey year (5.3%), but still lower than the peak seen in the survey years ending March 2009 and March 2010 (both 6.4%) (Figure 3).
Figure 3: Proportion of Crime Survey for England and Wales plastic card users who had been a victim of plastic card fraud in the last year, year ending March 2006 to year ending September 2017
Source: Crime Survey for England and Wales, Office for National Statistics
Notes:
- The data in this table refer to crimes experienced in the 12 months before interview, based on interviews carried out in that year.
Download this chart Figure 3: Proportion of Crime Survey for England and Wales plastic card users who had been a victim of plastic card fraud in the last year, year ending March 2006 to year ending September 2017
Image .csv .xlsRecorded fraud offences
The police recorded crime series incorporates fraud offences collated by the NFIB from Action Fraud, Cifas and UK Finance9 and referred to the police for investigation. In the latest year to September 2017, there was a 7% increase in the number of fraud offences recorded in England and Wales (up to 662,519 offences) compared with the previous year and this continues the year-on-year increases seen over the last five years (Table A4).
This latest increase was largely owing to offences reported to Action Fraud, which rose by 18% (up to 272,980 offences). Cifas also saw a smaller increase of 2% (up to 301,764 offences) compared with the previous year, while offences recorded by UK Finance decreased by 8% (down to 87,775 offences).
In July 2015, the company that was contracted to provide the Action Fraud call centre service went into administration, following which Action Fraud recorded lower than normal monthly volumes of fraud offences between July 2015 and April 201610. Volumes have subsequently recovered in recent months but because the lower-volume months form part of the comparator year (year ending September 2016), the latest 18% rise will still have been influenced by the changes in the operation of the Action Fraud call centre and thus figures should be interpreted with caution. We expect the effect on the Action Fraud data will continue over the next two quarters.
One of the largest increases in the separate categories of fraud referred to the NFIB in the latest year was seen in “banking and credit industry” fraud (up 4% to 382,197 offences). This was caused by the volume increase in offences reported to the NFIB by Cifas (up 8%, equivalent to 19,216 offences) and Action Fraud (up 11%, equivalent to 3,014 offences).
The latest increase in the recorded figures on “banking and credit industry” fraud was driven largely by an increase in application fraud, for example, opening up an account using fake or stolen documents in someone else’s name. The 16% increase in application fraud seen by Cifas is thought to reflect a rise in the identification and investigation of fraudulent hire purchase and conditional sale agreements by finance companies in respect of increased online applications for asset finance. Where possible, individuals whose details have been used to commit application fraud are informed by their financial providers, however, such crimes will not be picked up in the CSEW if the individual is unaware of the incident.
Other notable increases compared with the previous year were also seen for “advance fee payment” fraud (up 51% to 51,188 offences)11 and “consumer and retail fraud” (up 13% to 107,503 offences), which are only referred to the NFIB by Action Fraud. These are in contrast to the decreases in these fraud types indicated by the CSEW and may be explained by differences in the coverage of the two sources. For example, although incidents of fraud reported to Action Fraud are known to represent only a small fraction of the totality of fraud offences, Action Fraud provide a better measure of more serious fraud offences, which are more likely to be reported to the authorities, compared with the CSEW, which is dominated by a large volume of fraud incidents involving little or no loss.
In addition, “computer misuse crime”12 referred to the NFIB by Action Fraud increased by 63% (up to 21,745 offences), largely accounted for by a rise in computer viruses over the last year (up 145% to 8,292 offences). More specifically, this is thought to be due to a rise in levels of malware (mainly ransomware and Trojans), including several high-profile attacks and security breaches on national institutions (for example, the WannaCry virus linked to the NHS cyber attack in May 2017), which would not have been captured by the CSEW as the primary victims were organisations rather than individuals.
A full breakdown of the types of fraud offences referred to the NFIB by Action Fraud, Cifas and UK Finance in the latest year is presented in Table A5 and a definition of terms is provided in the User Guide.
A police force area breakdown of Action Fraud data based on where the individual victim resides, or in the cases of businesses, where the business is located, has now been produced, available from the year ending March 2016 only13 (Additional tables on fraud and cyber crime, Table E3). In contrast with most other crimes, the latest data show there was generally less variation in rates of fraud by police force area, although rates for forces in southern England were generally a little higher than those among forces in Wales or northern England.
Additional administrative data on card and bank account fraud
Additional data collected by UK Finance via their CAMIS system provide a broader range of bank account and plastic card frauds than those referred to the NFIB and include mainly cases not referred to the police for investigation. In the latest year, UK Finance reported 1.9 million cases of frauds on UK-issued cards, cheque fraud and remote banking fraud via CAMIS14, an increase of 4% from the previous year (Table F3).
Importantly, trends can differ between the UK Finance data collected via CAMIS and the UK Finance data referred to the NFIB (which in contrast showed an 8% decrease). This is partly because the cases referred to the NFIB are a subset of the CAMIS data and include only those with intelligence value to the police. As a result, they are less likely to include incidences of “remote purchase fraud”, which account for the large majority of plastic card fraud and also cases involving “lost and stolen” cards, which were the main driver in the overall increase in UK Finance data from CAMIS. These include an increase in distraction thefts where fraudsters are stealing cards in shops and at cash machines, and courier scams where victims are tricked into handing over their cards on the doorstep15.
In support of this, data on the nature of theft from the person offences from the CSEW for the survey year ending March 2017 indicate that credit cards are one of the most commonly stolen items during incidents of theft from the person (44%) and are stolen in a higher proportion of incidents than five years ago (23%).
For more information on the differences between the main sources of fraud and their strengths and limitations, please see the Overview of fraud and computer misuse statistics article.
Notes for: What is happening to trends in fraud?
As of 1 July 2017, FFA UK is now integrated into UK Finance, a new trade association representing the finance and banking industry in the UK.
For more information on UK Finance and CAMIS, please see Section 5.4 of the User Guide and also the Overview of fraud and computer misuse statistics article.
Remote purchase frauds refer to frauds where, in the vast majority of cases, card details have been fraudulently obtained through unsolicited emails or telephone calls or digital attacks such as malware and data hacks, and then used to undertake fraudulent purchases over the internet, phone or by mail order. Remote purchase fraud is also known as “card-not-present” (CNP) fraud.
From October 2017, the questions on fraud and computer misuse are being asked of a full survey sample.
Non-investment fraud was renamed as "Consumer and retail fraud" to reflect the corresponding name change to the Home Office Counting Rules from April 2017.
Based on whether the internet or any type of online activity was related to any aspect of the offence.
Data from these questions provide an indication of whether an individual has been a victim of plastic card fraud, but do not provide any information on the number of times this occurred or the scale of any loss that may have been experienced.
These questions continued to be included in the survey while the new questions on fraud and computer misuse were bedded in. As of October 2017 the new questions are being asked of a full survey sample, and the supplementary module on plastic card fraud has been removed from the questionnaire. All future estimates relating to bank and credit card fraud will be calculated using data from the new questions.
For further information on these sources and their strengths and weaknesses, please see Section 5.4 of the User Guide and also the Overview of fraud and computer misuse statistics article.
For further information, please see Section 5.4 of the User Guide.
This is largely accounted for by an increase in ‘other advance fee frauds’ relating in particular to a scam in the summer months of 2017 where fraudsters contacted victims claiming to be from HM Revenue & Customs (HMRC) and tricked them into paying bogus debts and taxes using iTunes gift cards.
Computer misuse crime covers any unauthorised access to computer material, as set out in the Computer Misuse Act 1990.
For more information, please see Section 5.4 of the User Guide.
It is important to note that number of cases relates to the number of accounts defrauded, rather than the number of victims.
Further information on trends in payment industry fraud based on industry data collated by UK Finance is available in Fraud the Facts 2017.
6. Latest violent crime figures continue to present a complex picture
Violent crime covers a wide range of offences including minor assaults (such as pushing and shoving), harassment and psychological abuse (that result in no physical harm), through to wounding and death. Neither of our two main sources provide a full picture of violent crime. Data collected through the Crime Survey for England and Wales (CSEW) include incidents with and without injury and also cover attempted incidents. Violent offences in police recorded data are referred to as “violence against the person” and include homicide, death or serious injury caused by illegal driving, violence with injury, violence without injury, and stalking and harassment1. As with the CSEW, both actual and attempted offences are included in the figures.
For the population and violent offences that it covers, the CSEW provides the better measure of trends. The police recorded crime series is restricted to violent offences that have been reported to and recorded by the police. In addition, due to the ensuing efforts of police forces to tighten recording practice and improve recording processes, this series is not currently believed to provide a reliable measure of trends. It’s important to recognise the differences in the two measures of crime; the CSEW tends to record high numbers of less harmful crimes while police recorded crime can provide a better measure of the more serious, low volume offences that come to their attention such as homicide, knife crime and gun crime, as these tend to have higher levels of reporting to the police.
Overview of the latest violent crime figures
There were an estimated 1.2 million incidents of violence experienced by adults aged 16 and over in the latest CSEW survey year ending September 2017; no change from the previous survey year (the apparent 11% decrease was not statistically significant). The sub-categories of “violence with injury” and “violence without injury” both showed no significant change (Figure 4).
This fairly flat trend continues that seen in recent years, with no significant year-on-year change since the survey year ending March 2014. However, the cumulative effect of this downward trend has seen a statistically significant decrease of 29% in the latest survey year compared with the year ending March 2013. The longer-term reductions in violent crime, as shown by the CSEW, are also reflected in the findings of research conducted by the Violence and Society Research Group at Cardiff University. Findings from their annual survey, covering a sample of hospital emergency departments and walk-in centres in England and Wales, show that serious violence-related attendances in 2016 showed a 10% fall compared with 2015, continuing a long-term downward trend.
Around 2 in every 100 adults were a victim of CSEW violent crime in the latest survey year, compared with around 3 in 100 adults in the survey year ending March 2007 and 5 in 100 adults in 1995 (the peak year).
Estimates of violence against 10-to-15-year-olds, as measured by the CSEW, can be found in Appendix tables A9, A10, A11 and A12.
Figure 4: Trends in Crime Survey for England and Wales violence, year ending December 1981 to year ending September 2017
Source: Crime Survey for England and Wales, Office for National Statistics
Notes:
- Prior to the year ending March 2002, CSEW respondents were asked about their experience of crime in the previous calendar year, so year-labels identify the year in which the crime took place. Following the change to continuous interviewing, respondents’ experience of crime relates to the full 12 months prior to interview (that is, a moving reference period). Year-labels for the year ending March 2002 identify the CSEW year of interview.
Download this chart Figure 4: Trends in Crime Survey for England and Wales violence, year ending December 1981 to year ending September 2017
Image .csv .xlsIn contrast to the recent flat trend shown by the CSEW, violence against the person offences recorded by the police in the latest year increased by 20% compared with the previous year (up from 1,075,839 to 1,291,405). While these figures are useful in giving an insight into the caseload of the police and how this is changing, they are not believed to provide a reliable measure of trends in violent crime.
Impact of crime-recording improvements
Ongoing work by police forces over the last three years to improve crime-recording practices are thought to be an important driver of the increase in all police recorded violence, but make interpreting trends in police recorded violence against the person offences difficult. These are thought to have had a larger effect on relatively less-serious types of violent crime but to have had a lesser impact on more serious sub-categories as described in the homicide and weapons sections.
It is known that violent offences are more prone than some other offences to subjective judgement about whether or not to record a crime. The Crime-recording: making the victim count report, published by Her Majesty’s Inspectorate of Constabulary and Fire & Rescue Services (HMICFRS) in November 2014, found that levels of under-recording by the police were particularly pronounced for violent crime and sexual offences (where 67% and 74% of reports of crime were recorded respectively). These offences have been the main focus of the subsequent rolling programme of HMICFRS inspections.
Nationally, in 2014, an estimated one in three (33%) reports of violence that should have been logged as crimes were not recorded as such.
More recent Crime Data Integrity inspections carried out by HMICFRS2 in the last year show that improvements in recording have been made since 2014 and this is likely to have been an important factor in the recorded increase in violent crime. However, this varies between forces and some forces have further work to do to ensure reports of crime, in particular violent crime, are recorded correctly. Of the 17 published inspection reports, only four forces received a rating of “good”, with a further five rated as "requires improvement” and eight as “inadequate”. Therefore, the increases in police recorded crime as a result of improved recording could continue for some time. It is also possible that there have been some genuine increases in crime among the less serious categories at the same time as ongoing improvements to recording.
Additional data from the Metropolitan Police Service in the year ending June 2017 on the number of calls for service (for example, emergency and non-emergency calls from members of the public) relating to violent crime help support the idea that the volume rise in recorded violence is largely a result of a greater proportion of reports of crime being recorded rather than a genuine rise. While police recorded crimes of violence against the person increased by 4% in the year ending June 2017, the number of calls for service in relation to violent incidents decreased by around 2% over the same period.
Changes in individual sub-categories of police recorded violence
The “violence without injury” sub-category, which accounted for 41% of all violence recorded by the police, showed a larger increase in the latest year to September 2017 (up 24% to 535,150 offences), than the violence with injury sub-category (up 9% to 492,394 offences) (Figure 5).
There was a large volume increase in the sub-category of assault without injury (up 94,279 offences). Smaller increases can be seen in threats to kill (up 3,913 offences), assault without injury on a constable (up 1,617 offences) and modern slavery3 (up 1,529 offences).
A new sub-category has been introduced within the main violence against the person offence group, covering offences related to “death or serious injury caused by illegal driving”. It contains offences previously counted under “violence with injury”. This new sub-category saw a 5% increase compared with the previous year (up from 685 to 717) continuing a rising trend seen since the year ending March 2013 (345 offences). As with homicide offences, this category is thought to be well-recorded by the police. To put these figures into context, the Department for Transport figures reported a 2% increase in road deaths (up to 1,601) and a 9% increase in people seriously injured (up to 22,407) from road accidents in England and Wales in 20164.
Additionally, stalking and harassment offences have been moved out of the sub-category of “violence without injury” and are now in a separate sub-category along with the new notifiable offence of malicious communications5. This new sub-category, labelled “stalking and harassment”, rose by 36% compared with the previous year accounting for one-third of the volume change in violence recorded by the police (32% equating to 69,282 offences). It is likely that recording improvements are an important factor in this rise, particularly in relation to offences in the malicious communication category.
In the latest joint inspection6 conducted by HMICFRS and HM Crown Prosecution Service Inspectorate (HMCPSI), it was found that stalking was not always recorded accurately by the police and in some of these cases, stalking was recorded as harassment. These findings suggest we cannot currently be confident about the accuracy of the recorded crime figures for the separate categories of stalking or harassment.
Most of the 9% increase in the “violence with injury” sub-category (up from 449,973 to 492,394) is a result of an increase in assault with injury (81% of the increase).
Figure 5: The volume of violent crime being dealt with by the police has increased over the last few years
England and Wales, year ending March 2003 to year ending September 2017
Source: Police recorded crime, Home Office
Notes:
- Police recorded crime data are not designated as National Statistics.
Download this chart Figure 5: The volume of violent crime being dealt with by the police has increased over the last few years
Image .csv .xlsPublic order offences increased by 44% in the last year compared with a 32% increase in the previous year. They cover a range of incidents including “causing intentional harassment, alarm or distress”. These offences are not covered by the CSEW and can be influenced by changes in police activity and recording practices. Improvements to recording are thought to have had an impact on public order offences in a similar way to the related violence against the person offences. However, it is also possible that genuine increases in public disorder may also be playing a part in this rise.
Changes at police force area level
Nearly all police forces recorded a rise in violence in the latest year to September 2017 compared with the previous year. In percentage terms, the largest increase was reported by South Yorkshire (up 62% to 36,121 offences). Other large percentage increases included Greater Manchester Police (up 61% to 86,511 offences), Durham Constabulary (up 52% to 18,763 offences) and Nottinghamshire Police (up 45% to 25,353 offences), as shown in Tables P1 and P2. When interpreting these figures, it is important to bear in mind that these increases will reflect recording improvements and the extent of such effects differs across police forces.
Homicide
Unlike many other offences in the “violence against the person” category, the quality of recording of homicides is thought to have remained consistently good.
The police recorded 685 homicides in the latest year to September 2017, a 1% fall compared with the previous year (Table A4) 7,8. However, recent trends in homicide have been affected by the recording of incidents where there were multiple victims, such as the recent terrorist attacks in London and Manchester and events at Hillsborough in 1989. Of the 685 homicides recorded in the year ending September 2017, there were 35 relating to the London and Manchester terror attacks. The 96 cases of manslaughter that occurred at Hillsborough in 1989 were recorded in the previous year.
If the cases related to Hillsborough are excluded from the year ending September 2016 and the London and Manchester terror attacks are excluded from the year ending September 2017, then there was a volume rise of 57 homicides (a 10% rise, up to a total of 650). This follows the general upward trend seen in recent years and contrasts with the previously downward trend over the last decade.
Historically, the number of homicides increased from around 300 per year in the early 1960s to over 800 per year in the early years of this century, which was at a faster rate than population growth over the same period. However, over the past decade, the volume of homicides has generally decreased while the population of England and Wales has continued to grow. The rate of homicide fell 10% between the year ending March 2007 and the year ending September 2017, from 14 homicides per 1 million of the population to 12 homicides per 1 million.
There was a substantial increase of 64% (485 offences) in the number of attempted murder offences in the latest year. This rise is due largely to the London and Manchester terror attacks, where the police recorded 61% (294) of the rise in attempted murder offences9.
There is more detailed information on long-term trends and the circumstances of violence in Focus on violent crime and sexual offences, England and Wales: year ending March 2016; however, this does not include the most recent statistics for the year ending September 2017.
Notes for: Latest violent crime figures continue to present a complex picture
There are some closely-related offences in the police recorded crime series, such as public order offences, that have no identifiable victim and are contained within the “other crimes against society” category.
These reports were published during 2016 and 2017, and the most recent reports were published on 28 November 2017.
Modern slavery can take multiple forms including sexual exploitation, forced labour and domestic servitude. Before 1 April 2015, modern slavery offences were recorded under trafficking for sexual exploitation, immigration offences, and other indictable or triable-either-way offences. As of 1 April 2015, a separately identifiable crime recording category of modern slavery was introduced. The Modern Slavery Act 2015 consolidated existing slavery and trafficking offences into one Act. These provisions came into force on 31 July 2015.
Data taken from Department for Transport publication “Reported road casualties in Great Britain: 2016 annual report.
These are “disclosure of private sexual photographs and films (including on the internet) with the intent to cause distress or anxiety” and “sending letters (including emails) with intent to cause distress or anxiety”. These were added to the notifiable offence list in April 2015.
Living in fear - the police and CPS response to harassment and stalking inspection report was published in July 2017.
Homicide includes the offences of murder, manslaughter, corporate manslaughter and infanticide. Figures from the Homicide Index for the time period April 2014 to March 2016, which take account of further police investigations and court outcomes, were published in Focus on violent crime and sexual offences: year ending March 2016 on 9 February 2017.
These figures include murders related to the Westminster Bridge terrorist-related incident in March 2017. It also includes seven offences of corporate manslaughter relating to the Croydon train crash.
These figures exclude crimes that occurred as part of the terrorist-related incident at Parsons Green Underground station in September 2017. It is likely that British Transport Police will record a number of attempted murder offences as the investigation of this incident continues.
7. Offences involving weapons recorded by the police continue to rise
Some of the more serious offences in the police recorded crime data can be broken down further by whether or not a knife or sharp instrument was involved1. All of these have seen increases, including some violence against the person categories, robbery and some sexual offences. While we believe these offences are relatively well recorded by the police, they can only provide a partial picture as not all offences will come to their attention.
Data are also available for police recorded crimes involving the use of firearms (that is, if a firearm is fired, used as a blunt instrument, or used as a threat).
As offences involving the use of weapons are relatively low in volume, the Crime Survey for England and Wales (CSEW) is not able to provide reliable trends for such incidents.
Offences involving knives or sharp instruments2
The police recorded 37,443 offences involving a knife or sharp instrument in the latest year ending September 2017, a 21% increase compared with the previous year (30,9413) and the highest number in the seven-year series (from year ending March 2011), the earliest point for which comparable data are available4 (Table 4). The past three years have seen a rise in the number of offences involving a knife or sharp instrument recorded, following a general downward trend in this series since the year ending March 2011 (Figure 6).
Figure 6: Police recorded selected offences involving a knife or sharp instrument have increased again in the last year following previous reductions
England and Wales, year ending March 2011 to year ending September 2017
Source: Police recorded crime, Home Office
Notes:
- Police recorded crime data are not designated as National Statistics.
Download this chart Figure 6: Police recorded selected offences involving a knife or sharp instrument have increased again in the last year following previous reductions
Image .csv .xlsThe offence “assault with injury and assault with intent to cause serious harm” accounted for half (50%) of total selected offences (including homicide) involving a knife or sharp instrument. All offence categories for which data are collected showed increases, including homicide. The category of “robbery” showed the largest rise in terms of volume of offences (from 11,169 to 14,816, up 33%), followed by “assault with injury and assault with intent to cause serious harm” (from 16,220 to 18,571, up 14%).
The majority of police forces (38 of the 44) recorded a rise in offences involving knives and sharp instruments. The force that showed the largest volume increase was the Metropolitan Police (accounting for 38% of the increase in England and Wales). A breakdown of offences for each police force and the time series for these data are published in the Home Office’s knife crime open data table5.
Table 4: Selected violent and sexual offences involving a knife or sharp instrument recorded by the police in England and Wales, year ending September 2016 and year ending September 2017 with percentage change1,2,3,4,5
| England and Wales | |||||
| Oct '15 to Sep '16 | Oct '16 to Sep '17 | Oct '16 to Sep '17 compared with previous year | |||
|---|---|---|---|---|---|
| Selected offences involving a knife or sharp instrument | Number of offences | Percentage change | |||
| Attempted murder | 348 | 373 | 7 | ||
| Threats to kill | 2,510 | 2,805 | 12 | ||
| Assault with injury and assault with intent to cause serious harm | 16,220 | 18,571 | 14 | ||
| Robbery | 11,169 | 14,816 | 33 | ||
| Rape | 350 | 449 | 28 | ||
| Sexual assault6 | 133 | 191 | 44 | ||
| Total selected offences | 30,730 | 37,205 | 21 | ||
| Homicide7 | 211 | 238 | 13 | ||
| Total selected offences including homicide | 30,941 | 37,443 | 21 | ||
| Rate per million population - selected offences involving a knife or sharp instrument | |||||
| Total selected offences including homicide | 535 | 641 | |||
| Source: Police recorded crime, Home Office | |||||
| Notes: | |||||
| 1. Police recorded crime data are not designated as National Statistics. | |||||
| 2. Police recorded crime statistics based on data from all 44 forces in England and Wales (including the British Transport Police). | |||||
| 3. Police recorded knife and sharp instrument offences data are submitted via an additional special collection. Proportions of offences involving the use of a knife or sharp instrument presented in this table are calculated based on figures submitted in this special collection. Other offences exist that are not shown in this table that may include the use of a knife or sharp instrument. | |||||
| 4. Data from Surrey Police include unbroken bottle and glass offences, which are outside the scope of this special collection; however, it is not thought that offences of this kind constitute a large enough number to impact on the national figure. | |||||
| 5. Numbers differ from those previously published due to Sussex Police revising their figures to exclude unbroken bottles. | |||||
| 6. Sexual assault includes indecent assault on a male/female and sexual assault on a male/female (all ages). | |||||
| 7. Homicide offences are those currently recorded by the police as at 24th November 2017 and are subject to revision as cases are dealt with by the police and by the courts, or as further information becomes available. They include the offences of murder, manslaughter, infanticide and, as of year ending March 2013, corporate manslaughter. These figures are taken from the detailed record level Homicide Index (rather than the main police collection for which forces are only required to provide an overall count of homicides, used in Appendix table A4). There may therefore be differences in the total homicides figure used to calculate these proportions and the homicide figure presented in Appendix table A4. | |||||
Download this table Table 4: Selected violent and sexual offences involving a knife or sharp instrument recorded by the police in England and Wales, year ending September 2016 and year ending September 2017 with percentage change^1,2,3,4,5^
.xls (241.7 kB)While in the past, offences involving a knife were generally not thought to be prone to changes in recording practices due to the severity of these offences, some forces have suggested that recording practice improvements may have been a factor contributing to the recent increases.
However, there has also been some indication, particularly in relation to more serious offences involving an injury to the victim, that part of the latest rise may represent a real change to the downward trend seen in recent years. Admissions data for NHS hospitals in England6, for example, showed a 7% increase in admissions for assault by a sharp object, from 4,054 in the year ending March 2016 to 4,351 in the year ending March 2017.
Police recorded “possession of an article with a blade or point” offences also rose, by 35%, to 16,664 offences in the latest year. This rise is consistent with increases seen over the last three years, but this is the highest figure since the series began in the year ending March 2009. This figure can often be influenced by increases in targeted police action in relation to knife crime, which is most likely to occur at times when rises in offences involving knives are seen.
Taking everything into account, the picture is a complex one, with rises in offences involving knives possibly reflecting both improvements in recording practices and targeted police action, but also a genuine rise in some areas such as London.
Further analysis on offences involving knives or sharp instruments in the previous year can be found in Focus on violent crime and sexual offences, England and Wales: year ending March 2016; however, this does not include the most recent statistics.
Offences involving firearms
Offences involving firearms7 increased by 20% (to 6,694) in the year ending September 2017 compared with the previous year (5,587 offences). This was driven largely by a 20% increase in offences involving handguns (up to 2,844 from 2,375) and partly by a 14% increase in offences involving imitation weapons such as BB guns8(up to 1,661 from 1,456), a 36% increase in offences involving shotguns (up to 658 from 484) and a 26% increase in offences involving unidentified firearms (up to 914 from 727). The latest rise continues an upward trend seen in firearms offences in the last few years, however, offences are still 31% below a decade ago (in the year ending March 2007; Figure 7).
Figure 7: Trends in police recorded crime in England and Wales involving the use of firearms, year ending March 2003 to year ending September 2017
Source: Police recorded crime, Home Office
Notes:
- Police recorded crime data are not designated as National Statistics.
- Firearms include: shotguns; handguns; rifles; imitation weapons such as BB guns or soft air weapons; other weapons such as CS gas, pepper spray and stun guns; and unidentified weapons. They exclude conventional air weapons, such as air rifles.
Download this chart Figure 7: Trends in police recorded crime in England and Wales involving the use of firearms, year ending March 2003 to year ending September 2017
Image .csv .xlsWhile a full geographic breakdown is not yet available, information from police forces suggests that the majority of areas have seen increases in recording offences involving firearms, with around half (50%) of the increase in England and Wales occurring in the Metropolitan Police force area.
The coverage of the firearms collection is wide, covering offences involving serious weapons such as handguns or shotguns as well as less serious weapons such as BB guns and CS gas. While some of the increase in the number of offences involving firearms will be a genuine rise, it is likely that improvements in crime recording will also be a factor. For example, around a fifth (20%9) of the increase is in offences involving some of these less serious weapons10. It is likely that the police are now including these offences in their returns when previously they were being excluded. Furthermore, 28%11 of the rise is due to an increase in possession of firearms offences with intent. It is possible that previously these offences would have been recorded as simple possession offences, which are not covered by this collection.
Evidence of some genuine increase in offences involving firearms can be seen in admissions data for NHS hospitals in England12, which showed increases in all three categories of assault by firearm discharge13, from 109 admissions in the year ending March 2016 to 135 admissions in the year ending March 2017.
Focus on violent crime and sexual offences, England and Wales: year ending March 2016 has more detailed information on trends and the circumstances of offences involving firearms, including figures based on a broader definition of the types of firearm involved14; however, this does not include the most recent statistics for the year ending March 2017.
Notes for: Offences involving weapons recorded by the police continue to rise
These are: homicide; attempted murder; threats to kill; assault with injury and assault with intent to cause serious harm; robbery; rape; and sexual assault.
A sharp instrument is any object that pierces the skin (or in the case of a threat, is capable of piercing the skin), for example, a broken bottle.
This number differs from the number previously published due to revisions made to data for the year ending June 2016.
The Focus on violent crime and sexual offences publication includes data on offences involving a knife or sharp instrument going back to the year ending March 2009; however, this excludes data for West Midlands and Sussex due to inconsistencies in their recording practices, which did not change until the year ending March 2011.
This source excludes homicides committed using a knife or sharp instrument.
Data are from NHS Hospital Admitted Patient Care Activity, 2015 to 2016 and NHS Hospital Admitted Patient Care Activity, 2016 to 2017.
Firearms include: shotguns; handguns; rifles; imitation weapons such as BB guns or soft air weapons; other weapons such as CS gas or pepper spray and stun guns; and unidentified weapons. These figures exclude conventional air weapons, such as air rifles.
A type of air gun that fires spherical projectiles.
Data not shown.
BB guns, soft air weapons, CS Gas and pepper spray.
Data not shown.
Data are from NHS Hospital Admitted Patient Care Activity, 2015 to 2016 and NHS Hospital Admitted Patient Care Activity, 2016 to 2017.
Firearm discharge admissions categories are: “assault by handgun discharge”, “assault by rifle, shotgun and larger firearm discharge” and “assault by other and unspecified firearm discharge.”
The broader definition of firearms includes conventional air weapons, such as air rifles.
8. What is happening to theft?
Since the mid-1990s, both the Crime Survey for England and Wales (CSEW) and police recorded crime have shown long-term reductions in most categories of theft. The latest estimates from the CSEW showed no change in the number of theft offences in the year ending September 2017 compared with the previous year, the apparent 4% reduction was not statistically significant (Figure 8). The only sub-category to show a statistically significant change was other theft of personal property, which saw a 21% reduction compared with the previous year (a volume decrease of 165,000 incidents) (Table A1).
Figure 8: Latest estimates show no change in theft offences measured by the Crime Survey for England and Wales, following long-term declines over the last two decades
England and Wales, year ending December 1981 to year ending September 2017
Source: Crime Survey for England and Wales, Office for National Statistics and Police recorded crime, Home Office
Notes:
- Police recorded crime data are not designated as National Statistics.
- Crime Survey for England and Wales (CSEW) data on this chart refer to different time periods: a) 1981 to 1999 refer to crimes experienced in the calendar year (January to December) b) from year ending March 2002 onwards the estimates relate to crimes experienced in the 12 months before interview, based on interviews carried out in that financial year (April to March).
Download this chart Figure 8: Latest estimates show no change in theft offences measured by the Crime Survey for England and Wales, following long-term declines over the last two decades
Image .csv .xlsWhile the police recorded an 11% increase in theft offences in the year ending September 2017 compared with the previous year, continuing the upward trend seen in the last two years (Figure 8), we do not believe these provide a reliable indication of trends in crime, across all theft offences. However, for some crime types such as burglary and vehicle-related theft, it is believed that these increases in police recorded crime reflect a genuine rise in these types of crime since these tend to be relatively well-reported by the public and relatively well-recorded by the police. While recording improvements may have contributed to these rises, the impact of these is thought to be less pronounced than in other crime types, as audits of crime-recording practices have not highlighted significant concerns.
The number of burglary offences recorded by the police increased by 8% (from 402,013 to 433,110 offences), consistent with the rising trend seen over the last year. Police recorded vehicle offences showed increases by 18% in the year ending September 2017, continuing the rising trend seen over the last two years. There were increases in both theft of vehicles (up by 22% to 100,828 recorded offences) and theft from vehicles (up by 15% to 276,823 recorded offences). However, these volume rises are relatively small in the context of the longer-term reduction seen in most of these offences.
Recent rises are also evident in the number of motor insurance claims relating to theft1. While the recent rises have not previously been reflected in the CSEW there are some signs that increases in vehicle-related thefts are beginning to appear in the latest survey estimates. Further changes are expected to feed through into future CSEW estimates.
It is possible that recent rises in the number of robbery offences recorded by the police, which increased by 29% compared with the previous year (from 53,263 to 68,968 offences) are also indicative of some real increases in this type of crime. As it is relatively low-volume crime the CSEW does not provide a robust measure of short-term trends. Previous assessments of police recording practices in robbery have not highlighted significant concerns about quality of the data.
Robbery is an offence that is disproportionally concentrated in London and other larger cities. In the latest year and similar to previous years, London accounted for 42% of all police recorded robbery in England and Wales, compared with 17% across all crime types (excluding fraud). Data published by the Metropolitan Police2 suggests that in recent years robberies and thefts committed on mopeds have increased across London. Often the mopeds used to facilitate snatch thefts and robberies are also stolen; these vehicles have no or limited security, are less likely to have immobilisers and therefore become an easier target for thieves3. It is thought that the increase in these types of crimes is a contributing factor to the rise seen in vehicle-related thefts, theft from the person and robbery offences.
For these theft offences, where recent rises in the number of crimes recorded by the police are thought to indicate some genuine rises in crime, there are some differences in trends seen across our two main sources. While the CSEW provides a robust measure of long-term trends in theft offences, as discussed within the methodological note, Why do the two data sources show differing trends?, it is less reliable at providing an indication of short-term trends. This is in part due to the time lag arising from the 12-month recall period4, the fact that CSEW sample sizes for individual crime types are relatively small and the natural variability in estimates arising from any sample survey.
While rises in vehicle-related theft, burglary and robbery recorded by the police are thought to be indicative of real increases in crime, the picture is less clear for other types of theft offences, which may be more prone to changes in recording practices.
Overview articles containing more detailed information on the long-term trends, on bicycle theft, vehicle-related theft, robbery and theft from the person and burglary and other household theft have previously been published.
Notes for: What is happening to theft?
Based on unpublished information from the Association of British Insurers (ABI)
Data obtained from a published Freedom of Information request.
Evidenced in the Metropolitan Police’s Be Safe Campaign.
The lag effect on the CSEW relates to the reference period used in the survey interview. Respondents are asked about crimes they experienced in the 12 months prior to the interview. Since the earliest interviews in the current survey year took place in October 2016, the latest estimates are based on crimes occurring between October 2015 and August 2017. Further information on the survey reference period is available in Chapter 2 of the User Guide to Crime Statistics for England and Wales.
9. What’s happened to the volume of crime handled by the police?
While, for many types of offence, police recorded crime figures do not provide a reliable measure of trends in crime, they can provide a good measure of the demand on the police to handle crime.
Over recent decades, the trend in the number of crimes recorded by the police has shown a broadly similar pattern to that seen in Crime Survey for England and Wales (CSEW) crime. Increases in the volume of crimes recorded were seen during the 1980s until the early 1990s. Changes to recording rules and processes resulted in rises between 1998 and 2004, followed by declining numbers of recorded crimes during the 2000s and early 2010s. Since 2014, there have been consistent increases in the number of crimes recorded by the police. The size of year-on-year increases has grown, with police recorded crime increasing by 6% in the year ending September 2015, by 8% in the year ending September 2016 and by 14% in the latest year (Figure 9).
Figure 9: The volume of crime being dealt with by the police has increased over the last few years
England and Wales, year ending December 1981 to year ending September 2017
Source: Police recorded crime, Home Office
Notes:
- Police recorded crime data are not designated as National Statistics.
- From the year ending March 2012 onwards, police recorded crime data have included offences from additional sources of fraud data.
- Some forces have revised their data and police recorded crime totals may not agree with those previously published.
Download this chart Figure 9: The volume of crime being dealt with by the police has increased over the last few years
Image .csv .xlsRises seen over recent years are thought to reflect a combination of factors, which vary for different individual crime types as explained in the other sections of the bulletin. The factors can include continuing improvements to recording processes and practices, more victims reporting crime, or genuine increases in crime. The effect of recording improvement, while spanning a broad range of crime types, is thought to have been particularly pronounced in the case of sexual offence and violent crime (Section 6 provides more information on violent crime). The impact of victim willingness to report offences is also thought to be most evident in these offence types and particularly in violent crime related to domestic abuse. This section provides more detailed information on increases seen in domestic abuse and sexual offences recorded by the police.
Police recorded domestic abuse continues to rise
A 2015 Her Majesty’s Inspectorate of Constabulary (HMICFRS) report concluded that recent increases in the number of domestic abuse-related crimes were due, in part, to police forces improving their recording of domestic abuse incidents as crimes and to forces actively encouraging victims to come forward to report these crimes.
The Home Office has been collecting information from the police, since April 2015, on whether recorded offences are related to domestic abuse. Crimes should be “flagged” as being domestic abuse-related by the police if the offence meets the government definition of domestic violence and abuse1. Data for the year ending September 2017 showed that violence against the person offences were the most likely to be flagged as being domestic abuse-related (32%), followed by sexual offences (13%) (Figure 10). However, as the “flagging” of offences relies on a manual intervention in the crime recording system, the quality of these data may be inconsistent across police forces and open to a greater degree of fluctuation than the underlying number of recorded offences by crime type.
Figure 10: Proportion of offences recorded by the police in England and Wales that were flagged as domestic abuse-related, selected offence groups, year ending September 2017
Source: Police recorded crime, Home Office
Notes:
- Police recorded crime data are not designated as National Statistics.
- Data are provisional and have not been reconciled with police forces.
Download this chart Figure 10: Proportion of offences recorded by the police in England and Wales that were flagged as domestic abuse-related, selected offence groups, year ending September 2017
Image .csv .xlsIn the year ending September 2017, there was an increase in the number of domestic abuse-related offences recorded by the police (up 20% to 535,359 from 447,950). As well as general improvements in recording, the police may have improved their identification of which offences are domestic abuse-related and more victims may be coming forward to report these crimes. In comparison, figures from a self-completion questionnaire module on intimate violence in the CSEW have shown little change in the prevalence of domestic abuse in recent years. A cumulative effect of these changes has resulted in a small, significantly lower prevalence for the year ending March 2017 (5.9%) compared with the year ending March 2012 (7.0%), indicating a gradual, longer-term downward trend.
Further analysis can be found in the previous annual statistical bulletin, Crime in England and Wales: year ending March 2017. Additionally, further details on domestic abuse can be accessed in the Domestic abuse in England and Wales, year ending March 2017 release, which was published on 23 November 2017.
Rise in police recorded sexual offences
There was an increase of 23% in the number of sexual offences recorded by the police in the latest year ending September 2017 compared with the previous year (up to 138,045, Table A4). This is the highest volume recorded since the introduction of the National Crime Recording Standard (NCRS) in April 2002, following year-on-year increases since the year ending March 2012 (Figure 11).
Police recorded rape increased by 29% (to 48,773 offences) compared with the previous year, while other sexual offences increased by 20% (to 89,272). Offence categories that directly relate to sexual offences against children2 contributed over one-third (37%) to the total increase in the number of sexual offences recorded by the police.
A contributing factor to the increase is thought to include an increased willingness of victims to come forward and report these crimes to the police. High-profile coverage of sexual offences and the police response to reports of non-recent sexual offending, for example, Operation Yewtree, which began in 2012, and more recently, allegations by former footballers, alongside a dedicated police operation set up to investigate these, is likely to have an ongoing influence on victims’ willingness to come forward to report both recent and non-recent offences.
In the year ending September 2017, of all sexual offences recorded by the police, 27%3 were non-recent offences. Non-recent offences increased by 28% compared with the year ending September 2016. However, while non-recent offences remain an important contributor to the latest rise in sexual offences, the rise was predominantly due to increases in current offences (those that took place within 12 months of being recorded by the police).
A factor in the latest rise is improvements made by the police in the recording of sexual offences. Recent inspection reports by Her Majesty’s Inspectorate of Constabulary and Fire & Rescue Services (HMICFRS) indicate that there has been a significant rise in the recording of sexual offences since the Crime-recording: making the victim count report, published by HMICFRS in late 2014, found that sexual offences had been substantially under-recorded (by 26% nationally). Given the different factors affecting the reporting and recording of these offences, we feel the police figures do not currently provide a reliable indication of current trends.
Figure 11: Police recorded sexual offences have been rising since inspections in 2014 highlighted significant under-recording
England and Wales, year ending March 2003 to year ending September 2017
Source: Police recorded crime, Home Office
Notes:
- Police recorded crime data are not designated as National Statistics.
- The Sexual Offences Act 2003, introduced in May 2004, altered the definition and coverage of sexual offences.
Download this chart Figure 11: Police recorded sexual offences have been rising since inspections in 2014 highlighted significant under-recording
Image .csv .xlsEstimates from the CSEW for the year ending March 2017 showed that 2.0% of adults aged 16 to 59 years had been victims of sexual assaults in the last year (including attempted offences), no change from the previous year’s estimate (2.0%). These figures have fluctuated between 1.5% and 2.4% since the survey year ending March 2009 (Table S39).
More information on interpreting longer-term trends in these offences can be found in Focus on violent crime and sexual offences, England and Wales: year ending March 2016, however, this does not include the most recent statistics for the year ending March 2017.
Notes for: What’s happened to the volume of crime handled by the police?
Any incident or pattern of incidents of controlling, coercive or threatening behaviour, violence or abuse between those aged 16 or over who are, or have been, intimate partners or family members regardless of gender or sexuality.
This includes “rape of a male or female child under 16”, “rape of a male or female child under 13”, “sexual assault on a male or female child under 13”, “sexual activity involving a child under 13 or under 16” and “abuse of children through sexual exploitation”.
Based on findings from the Home Office Data Hub (HODH) from a subset of forces.
11. New and upcoming changes to this bulletin
The briefing note Improving crime statistics for England and Wales – progress update provides an overview of our plans to improve the design, coverage and presentation of crime statistics in England and Wales over the next few years. In addition, details of a number of specific changes are outlined in this section, including changes to the categorisation of police recorded crime and a consultation on changes to the Crime Survey for England and Wales (CSEW).
Changes to the categorisation of police recorded crime
Changes have been made to the subcategories of “violence against the person”. These were first introduced in the quarterly bulletin Crime in England and Wales: year ending June 2017.
A new subcategory of “death or serious injury caused by illegal driving” has been created to include the following offence classifications: causing death or serious injury by dangerous driving (4.4), causing death by careless driving when under the influence of drink or drugs (4.6), causing death by careless or inconsiderate driving (4.8), causing death by driving: unlicensed or disqualified or uninsured drivers (4.9). These offences were previously included within the subcategory of violence with injury.
Another new subcategory of “stalking and harassment” has been created to include the offence classifications of harassment (8L and 8M), stalking (8Q) and the new offence classification of malicious communications (8R), which came into effect from April 2017. Stalking and harassment offences were previously included within the subcategory of violence without injury. It should be noted that with regard to malicious communications, only data for the period April to September 2017 is presented in this bulletin as there was no central collection of this data in the preceding nine months.
Additionally, the data tables accompanying this release provide a more detailed breakdown of homicide offences than has previously been provided in this quarterly statistical bulletin. Separate figures are now shown for each of the constituent categories of homicide: murder, manslaughter, corporate manslaughter and infanticide.
It is important to note that figures given in this breakdown of police recorded homicide will differ from those sourced from the Home Office Homicide Index1.These differences arise from an important distinction between the two data sources. Police recorded crime data on homicide (as presented in this release) represent the recording decision of the police based on the available information at the time the offence comes to their attention. In contrast, Homicide Index data take account of the charging decision and court outcome in cases that have gone to trial. It is not uncommon for offences initially recorded as murder by the police to be charged or convicted as manslaughter at court. As a result, manslaughter consistently makes up a notably higher proportion of offences in the Homicide Index compared with police recorded crime.
Crime Severity Score
Experimental Statistics on a newly developed Crime Severity Score (CSS) have been released alongside this bulletin. The CSS has been developed as an additional measure to supplement existing Office for National Statistics (ONS) statistics on crime. This new measure weights different types of crime according to severity, with more serious crimes carrying a higher weight in order to better reflect the level of harm to society and demand on the police caused by crime.
Initial research outputs based upon the CSS were published in November 2016, along with a request for feedback from users. We intend to issue an updated CSS dataset alongside each quarterly crime statistics bulletin.
Update on changes to the Crime Survey for England and Wales
As mentioned in the previous bulletin, an initial implementation of planned changes to the CSEW took place in October 2017. These resulted from public sector financial constraints on the future level of funding for the survey and included small reductions in the survey's sample size and target response rate, as well as the removal of a series of questions related to the criminal justice system. Full details of these changes were published in the Consultation Paper.
Full implementation of these changes has now been delayed until April 2018. As a result, the CSEW's sample size and target response rate have not been reduced for the current survey year. The questions removed from the survey in October 2017 have also been reintroduced from January 2018, but will only be asked of a smaller sample of respondents.
Changes to bulletin tables
You should be aware that in this publication and in future releases, bulletin tables, which were previously accessible in a separate set of data tables alongside the bulletin will no longer be published. All bulletin tables can be downloaded within this bulletin document. Additionally, tables on further data sources including non-notifiable offences, anti-social behaviour, and the Commercial Victimisation Survey that were previously published as ‘former bulletin tables’ are now published as ‘other related data tables’.
Notes for: New and upcoming changes to this bulletin
- These figures are published annually by ONS and were last released as part of 'Focus on violent crime and sexual offences: year ending March 2016'.
12. Quality and methodology
The Crime in England and Wales quarterly releases are produced in partnership with the Home Office who collate and quality assure the police recorded crime data presented in the bulletins. Home Office colleagues also quality assure the overall content of the bulletin.
National Statistics are produced to high professional standards set out in the Code of Practice for Official Statistics. They undergo regular quality assurance reviews to ensure that they meet customer needs. They are produced free from any political interference.
The UK Statistics Authority has designated this statistical bulletin as a National Statistics output, in accordance with the Statistics and Registration Service Act 2007 and signifying compliance with the Code of Practice for Official Statistics.
However, statistics based on police recorded crime data have been assessed against the Code of Practice for Official Statistics and found not to meet the required standard for designation as National Statistics. The full assessment report can be found on the UK Statistics Authority website.
A new data quality framework has been compiled to help inform users about the quality of crime statistics for different types of crime, and which source is thought to provide the most reliable measure. This can be found in chapter 5 of the User Guide.
Table 5 summarises the strengths and weaknesses of the two main sources of data used in this bulletin.
Table 5: Strengths and limitations of the Crime Survey for England and Wales and police recorded crime
| Crime Survey for England and Wales | Police recorded crime | |
|---|---|---|
| Strengths | Strengths | |
| Large nationally representative sample survey that provides a good measure of long-term crime trends for the offences and the population it covers (that is, those resident in households) | Has wider offence coverage and population coverage than the CSEW | |
| Consistent methodology over time | Good measure of offences that are well-reported to the police | |
| Covers crimes not reported to the police and is not affected by changes in police recording practice; therefore is a reliable measure of long-term trends | Primary source of local crime statistics and for lower-volume crimes (for example, homicide) | |
| Coverage of survey extended in 2009 to include children aged 10 to 15 years resident in households | Provides whole counts (rather than estimates that are subject to sampling variation) | |
| Independent collection of crime figures | Time lag between occurrence of crime and reporting results tends to be short, providing an indication of emerging trends | |
| Limitations | Limitations | |
| Survey is subject to error associated with sampling and respondents recalling past events | Excludes offences that are not reported to, or not recorded by, the police and does not include less serious offences dealt with by magistrates’ courts (for example, motoring offences) | |
| Potential time lag between occurrence of crime and survey data collection means that the survey is not a good measure of emerging trends | Trends can be influenced by changes in recording practices or police activity | |
| Excludes crimes against businesses and those not resident in households (for example, residents of institutions and visitors) | Not possible to make long-term comparisons due to fundamental changes in recording practice introduced in 1998 and the year ending March 20032 | |
| Headline estimates exclude offences that are difficult to estimate robustly (such as sexual offences) or that have no victim who can be interviewed (for example, homicides and drug offences) | There are concerns about the quality of recording – crimes may not be recorded consistently across police forces and so the true level of recorded crime may be understated | |
| Previously, excluded fraud and cybercrime1 | ||
| Source: Office for National Statistics | ||
| Notes: | ||
| 1. From 1 October 2015, the offence coverage of the CSEW was extended to include fraud experienced by the adult population. Estimates from these new questions were published for the first time in the “Crime in England and Wales, year ending March 2016” release. | ||
| 2. Section 3.3 of the User Guide has more information | ||
Download this table Table 5: Strengths and limitations of the Crime Survey for England and Wales and police recorded crime
.xls (30.7 kB)The Crime in England and Wales Quality and Methodology Information report contains important information on:
- the strengths and limitations of the data and how it compares with related data
- uses and users of the data
- how the output was created
- the quality of the output including the accuracy of the data
Unless stated otherwise, all changes in Crime Survey for England and Wales (CSEW) estimates described in the main text are statistically significant at the 5% level. Since the CSEW estimates are based on a sample survey, it is good practice to publish confidence intervals alongside them; these provide a measure of the reliability of the estimates and can be found in the User Guide tables. Further information on statistical significance can be found in Chapter 8 of the User Guide.
More information regarding the coverage, coherence and accuracy of the CSEW and police recorded crime can be found in the User Guide to Crime Statistics for England and Wales, the Crime in England and Wales Quality and Methodology Information report and (for CSEW only) the CSEW technical report.
Back to table of contents