Table of contents
- Main points
- Feedback on crime statistics outputs
- Understanding crime statistics
- Headline figures and trends
- Summary by crime type
- Violent crime
- Sexual offences
- Offences involving weapons
- Fraud
- Data sources - coverage and coherence
- Accuracy of the statistics
- Users of crime statistics
- International and UK comparisons
- Background notes
- Methodology
1. Main points
The Crime Survey for England and Wales (CSEW) for the year ending December 2015 shows there were an estimated 6.4 million incidents of crime against households and resident adults aged 16 and over. This represents a 7% decrease from the estimated 6.9 million incidents in the previous year. The survey also estimated that there were 829,000 incidents of crime against children aged 10 to 15.
The decrease shown by the CSEW was largely driven by falls in theft offences (down 7%) and criminal damage (down 14%).
There was a 7% increase in police recorded crime compared with the previous year, with 4.4 million offences recorded in the year ending December 2015. Most of this rise is thought to be owing to improved crime recording by the police leading to a greater proportion of reports of crime being recorded in the last year.
Improvements in recording of crime are thought to have particularly affected some categories of violent crime recorded by the police. There was a 27% rise in "violence against the person" offences (an additional 198,658 offences) which was largely driven by increases within the "violence without injury" subgroup (up by 143,239 offences; a 38% increase). The CSEW estimate for violent crime showed no statistically significant change compared with the previous year’s survey.
There were also increases in some of the lower volume but more serious types of police recorded violence, including an 11% rise in homicide (up 56 to 573 offences) and a 9% rise in offences involving knives or sharp instruments (up 2,425 to 28,008 offences). Regarding the latter, there is anecdotal evidence to suggest that a tightening of recording procedures may be contributing to the increase in some forces.
The police data also continued to show a rise in recorded sexual offences, with the latest figures up 29% on the previous year; equivalent to an additional 23,349 offences and bringing the total to over 100,000 in a single year for the first time (103,614). The numbers of rapes (34,741) and other sexual offences (68,873) were at the highest level recorded since the introduction of the National Crime Recording Standard in the year ending March 2003. As well as improvements in recording, these rises are also thought to reflect a greater willingness of victims to come forward to report such crimes.
There was a 4% increase in the volume of fraud offences referred to the National Fraud Intelligence Bureau (NFIB) at the City of London Police. In total, 617,618 offences were referred to NFIB, including 224,683 offences reported by victims to Action Fraud (the UK’s national fraud reporting centre), 295,525 referrals from Cifas (a UK-wide fraud prevention service) and 97,411 cases from Financial Fraud Action UK (FFA UK; a body that represents the UK payments industry). It is known that many cases of fraud do not come to the attention of the police, and these figures provide a very partial picture. A more complete picture will be published next quarter when early estimates are available from new CSEW data on fraud and cybercrime.
Back to table of contents2. Feedback on crime statistics outputs
The briefing note ‘Improving Crime Statistics for England and Wales – progress update’ provides details of our plans to improve the design, coverage and presentation of crime statistics in England and Wales over the next 3 years.
As part of this work, this quarterly bulletin has been produced in a new, shorter format, with the aim of making the main messages more accessible.
This is an initial step towards reducing the length of our quarterly statistical bulletin on crime and we intend to continue developing its structure in future editions as well as conducting an extensive review of the data tables published with each release. As part of this review we will be seeking users’ views on whether there is a continuing need for all of the data we publish and whether there are new needs for data we are not currently producing. We will also be looking at opportunities to exploit new data sources to meet user requirements for more detailed information on the nature of crime. We would welcome any feedback on this new format or any aspect of our improvement programme at crimestatistics@ons.gov.uk.
Back to table of contents3. Understanding crime statistics
This quarterly release presents the most recent crime statistics from the Crime Survey for England and Wales (CSEW) and police recorded crime. Neither of these sources can provide a picture of total crime, and coverage is described in this section.
- the latest CSEW figures included in this release are based on interviews conducted between January 2015 and December 2015, measuring experiences of crime in the 12 months before the interview
- the police recorded crime figures presented relate to notifiable offences1 recorded by the police during the year ending December 20152
There is a 9-month overlap of the data reported here with the data contained in the previous bulletin. Therefore, year-on-year comparisons are made with the previous year; that is, the 12-month period ending December 2014 (rather than those published last quarter).
Crime Survey for England and Wales
The CSEW is a face-to-face victimisation survey in which people resident in households in England and Wales are asked about their experiences of a selected number of offences in the 12 months prior to the interview. It covers adults aged 16 and over, and a separate survey is used to cover children aged 10 to 15, but neither cover those living in communal establishments (such as care homes, student halls of residence and prisons), or crimes against commercial or public sector bodies. For the population and offence types it covers, the CSEW provides robust estimates on a consistent basis over time.
The CSEW is able to capture a broad range of victim-based crimes experienced by those interviewed, not just those that have been reported to, and recorded by, the police. However, there are some serious but relatively low-volume offences, such as homicide and sexual offences, which are not included in its main estimates. The survey also currently excludes fraud and cyber crime – ongoing development work to address this particular gap is described in the ‘Data sources – coverage and coherence’ section.
An infographic looking at the people and crimes covered by the CSEW was published in October 2014.
Police recorded crime
Police recorded crime figures are restricted to a subset of notifiable offences that have been reported to and recorded by the police, and so do not provide a total count of all crimes that take place. They are supplied by the 43 territorial police forces of England and Wales, plus the British Transport Police, via the Home Office.
Police recorded crime is the primary source for subnational crime statistics and for relatively serious, but low volume, crimes that are not well measured by a sample survey. It covers victims and sectors excluded from the CSEW sample (for example, residents of institutions and tourists, and crimes against commercial bodies). While the police recorded crime series covers a wider population and a broader3 set of offences than the CSEW, it does not include crimes that do not come to the attention of the police or are not recorded by them. As a result, police recorded crime figures will be lower than the estimates produced by the CSEW.
The series can also be split into 2 broad types of crime:
victim-based crimes – those that have a specific identifiable victim, either a household (for example, burglary), an individual (for example, violence against the person), or an organisation (for example, shoplifting)
other crimes against society – those that do not normally have a direct victim, such as drug offences, possession of weapon offences or miscellaneous crimes against society. Trends in such offences often reflect changes in police activity and workload rather than levels of criminality as, without a direct victim, recording of these offences is directly related to policing practices
Accuracy
Following an assessment of crime statistics by the UK Statistics Authority, published in January 2014, the statistics based on police recorded crime data have been found not to meet the required standard for designation as National Statistics. Data from the CSEW continue to be designated as National Statistics.
Her Majesty’s Inspectorate of Constabulary (HMIC) undertook an inspection of the integrity of police recorded crime between December 2013 and August 2014 and concluded that, across England and Wales as a whole, an estimated 1 in 5 offences (19%) that should have been recorded as crimes were not. The renewed focus on the quality of crime recording following this audit means that caution is needed when interpreting trends in police recorded crime. Apparent increases in police recorded crime data may reflect a number of factors, including tightening of recording practice, increases in reporting by victims and also genuine increases in the levels of crime.
Further information is also available in the ‘Accuracy of the statistics’ section.
Useful links
An interactive guide provides a general overview of crime statistics. Further information on the datasets is available in the ‘Data sources – coverage and coherence’ section and the CSEW technical report.
The User Guide to Crime Statistics for England and Wales provides information for those wanting to obtain more detail on crime statistics. This includes information on the datasets used to compile the statistics and is a useful reference guide for users.
The quality and methodology report sets out detailed information about the quality of crime statistics and the roles and responsibilities of the different departments involved in the production and publication of crime statistics.
Notes:
Notifiable offences refer to offences for which there is a legal requirement that the police inform the Home Office of their occurrence. These notifiable offences relate only to crimes that could possibly be tried by a jury and exclude less serious (non-notifiable) offences such as parking fines (usually dealt with in magistrates courts). Further detail is available in Chapter 3 of the User Guide.
Police recorded crime statistics are based on the year in which the offence was recorded, rather than the year in which it was committed. Therefore, such data for any given period will include some historic offences that occurred in a previous year to the one in which they were reported to the police.
The coverage of police recorded crime is defined by the Notifiable Offence List, which includes all indictable and triable-either-way-offences (offences which could be tried at a crown court) and a few additional closely related summary offences (which would be dealt with by magistrates’ courts). Appendix 1 of the User Guide has more information on the classifications used for notifiable crimes recorded by the police.
4. Headline figures and trends
Latest figures from the Crime Survey for England and Wales (CSEW) show there were an estimated 6.4 million incidents of crime against households and resident adults (aged 16 and over) in England and Wales for the year ending December 2015 (Table 1). This is a 7% decrease from the 6.9 million incidents estimated in the previous year’s survey and the latest estimate is the lowest since the survey began in 1981.The estimated number of CSEW incidents is around a third lower (31%) than the year ending March 2010 survey and around two-thirds lower (66%) than its peak level in 1995.
These figures relate to a broad range of victim-based crimes experienced by the resident household population. However, they exclude some serious (but low volume) offences such as homicide and sexual offences as well as fraud and cyber crime offences1 and crimes against children.
Crime covered by the CSEW increased steadily from 1981, before peaking in 1995. After peaking, the CSEW showed marked falls until the year ending March 2005 survey year. Since then, the underlying trend has continued downwards, but with some fluctuation from year to year (Figure 1).
Figure 1: Trends in overall crime for England and Wales, CSEW and police recorded crime, year ending December 1981 to year ending December 2015
England and Wales

Source: Crime Survey for England and Wales, Office for National Statistics / Police recorded crime, Home Office
Notes:
Police recorded crime data are not designated as National Statistics.
Prior to the year ending March 2002, CSEW respondents were asked about their experience of crime in the previous calendar year, so year-labels identify the year in which the crime took place. Following the change to continuous interviewing, respondents’ experience of crime relates to the full 12 months prior to interview (ie a moving reference period). Year-labels for year ending March 2002 identify the CSEW year of interview.
From year ending March 2012 onwards, police recorded crime data have included offences from additional sources of data on fraud
- CSEW data relate to households/adults aged 16 and over.
Some forces have revised their data and police recorded crime totals may not agree with those previously published.
Download this image Figure 1: Trends in overall crime for England and Wales, CSEW and police recorded crime, year ending December 1981 to year ending December 2015
.png (39.7 kB) .xls (176.6 kB)
CSEW estimates of crimes experienced by children aged 10 to 15 are not directly comparable with the main survey of adults, so are not included in the headline total. In the year ending December 2015, the CSEW estimated that 829,000 crimes2 were experienced by children aged 10 to 15. Of this number, 48% were categorised as violent crimes3 (398,000), while most of the remainder were thefts of personal property (275,000; 33%). Given the small sample size for the 10- to 15-year old element of the CSEW, trends in these estimates can fluctuate, and as a result trends can be difficult to interpret. Detailed data are available from Tables 24, 25 and 26.
The police recorded 4.4 million offences in the year ending December 2015, an increase of 7% compared with the previous year (Appendix Table A4). Of the 44 forces (including the British Transport Police), 39 showed an annual increase in total recorded crime, which was largely driven by rises in the volume of "violence against the person" offences.
This increase needs to be seen in the context of the renewed focus on the quality of crime recording by the police, undertaken in light of the inspections of forces by Her Majesty’s Inspectorate of Constabulary (HMIC), the Public Administration Select Committee (PASC) inquiry into crime statistics, and the UK Statistics Authority’s decision to remove the National Statistics designation from police recorded crime statistics. This renewed focus is thought to have led to improved compliance with the National Crime Recording Standard (NCRS), leading to a greater proportion of crimes now coming to the attention of the police.
Like CSEW crime estimates, police recorded crime also increased during most of the 1980s and then fell each year from 1992 to year ending March 1999. Expanded coverage of offences in the police recorded crime collection, following changes to the Home Office Counting Rules (HOCR) in 1998 and the introduction of the NCRS in April 2002, saw increases in the number of crimes recorded by the police while the CSEW count fell. Following these changes, trends from both series tracked each other well from year ending March 2003 until year ending March 2007. While both series continued to show a downward trend between year ending March 2008 and year ending March 20134, the gap between them widened with police recorded crime showing a faster rate of reduction – a trend attributed to a gradual erosion of compliance with the NCRS (see the ‘Accuracy of the Statistics’ section for further information). From 2014 onwards, overall police recorded crime has increased, while CSEW estimates have continued to fall.
Other related sources
Neither the CSEW nor police recorded crime figures provide a total picture of crime. Other sources of information about crimes in England and Wales include administrative data on anti-social behaviour and non-notifiable offences, and the Commercial Victimisation Survey, which provides estimates of crime against business premises.
Around 1.8 million incidents of anti-social behaviour (ASB) were recorded by the police for the year ending December 2015, a decrease of 8% compared with the previous year. These are incidents that may still be crimes in law, such as littering or dog fouling, but are not of a level of severity that would result in the recording of a notifiable offence and therefore are not included in the police recorded crime figures. A review by HMIC in 2012 found that there was a wide variation in the quality of decision making associated with the recording of ASB. As a result, ASB incident data should be interpreted with caution. The CSEW also provides some information on ASB – 28% of respondents reported experiencing or witnessing ASB in their local area in the year ending December 2015. This estimate has remained at a similar level since the data were first collected in the year ending March 2012. Further information is available in Figures 16 and 17 and Tables 27 and 28.
In the year ending September 2015 (the latest period for which data are available) there were 1.05 million convictions for non-notifiable offences5 that were not covered in police recorded crime or the CSEW. This was an increase of 5% from the year ending September 2014 and continues a pattern of similar rises recorded from the year ending December 2014 onwards. Convictions for speeding offences and prosecutions for TV licence evasion were the main drivers of the increase. In addition, there were 23,000 Penalty Notices for Disorder issued in relation to non-notifiable offences for the year ending September 2015, a decrease of 24% from the previous year. Further information is available in Tables 29a and 29b.
The CSEW does not cover crimes against businesses and police recorded crime can only provide a partial picture (as not all offences come to the attention of the police). The Commercial Victimisation Survey provides estimates of incidents of crime against business premises6 in England and Wales and gives some insight into the number of these crimes that go unreported to the police. However, it does not cover all sectors of industry and the small sample sizes associated with individual sectors means that caution must be applied when comparing crime rates over time. In 2014 (the latest data available7) businesses in the wholesale and retail sector experienced the highest estimated levels of crime – an estimated 4.1 million, a rate of around 13,000 crimes per 1,000 business premises (Table 30). Reporting rates for frauds, non-vehicle-related thefts, assaults and threats, and vandalism, were all estimated to be below 50%.
The previous report ‘Crime in England and Wales: year ending September 2015’ also contains further commentary on trends in these other sources.
Notes:
- The CSEW currently excludes fraud and cyber crime from its headline figures. Development work to add new questions to the survey to cover these areas has been undertaken and initial estimates will be available by summer 2016.
- The survey of children aged 10 to 15 only covers personal level crime (so excludes household level crime) and, as with the main survey, does not include sexual offences.
- The majority (76%) of violent crimes experienced in the year ending December 2015 resulted in minor or no injury, so in just over three-quarters of cases the violence is low level.
- From year ending March 2012 a step-change in the police recorded crime data series was created by the inclusion of additional sources of data on fraud. This masks the full scale of the reduction in police recorded crime that occurred towards the end of this period.
- Non-notifiable offences are offences dealt with exclusively by magistrates’ courts or by the police issuing of a Penalty Notice for Disorder or a Fixed Penalty Notice. Along with non-notifiable offences dealt with by the police (such as speeding), these include many offences that may be dealt with by other agencies – for example: prosecutions by TV Licensing; or the Driver and Vehicle Licensing Agency (DVLA) for vehicle registration offences.
- This is a premises based survey: respondents were asked if the business at their current premises had experienced any of a range of crime types in the 12 months prior to interview and, if so, how many incidents of crime had been experienced.
- Data from the 2015 Commercial Victimisation Survey is due to be published on 28 April 2016.
5. Summary by crime type
The CSEW provides coverage of a broad range of victim-based crimes1, although there are exclusions from its main estimates, such as homicide and sexual offences. Table 1 shows the latest figures and comparisons with earlier years for the main categories that contribute to the headline estimates from the survey: violence, robbery, theft offences and criminal damage.
Table 1: Number of CSEW incidents for year ending December 2015 and percentage change1,
| England and Wales | Adults aged 16 and over/households | |||||||||
| January 2015 to December 2015 compared with: | ||||||||||
| Offence group2 | Jan '15 to Dec '15 | Jan '95 to Dec '95 | Apr '04 to Mar '05 | Apr '09 to Mar '10 | Jan '14 to Dec '14 | |||||
| Number of incidents (thousands) | percentage change and significance3 | |||||||||
| Violence | 1,285 | -67 | * | -36 | * | -24 | * | -2 | ||
| with injury | 618 | -73 | * | -47 | * | -31 | * | 0 | ||
| without injury | 667 | -57 | * | -21 | * | -16 | -3 | |||
| Robbery | 124 | -63 | * | -50 | * | -61 | * | 18 | ||
| Theft offences | 3,812 | -67 | * | -34 | * | -23 | * | -7 | * | |
| Theft from the person | 403 | -41 | * | -29 | * | -22 | * | -15 | ||
| Other theft of personal property | 789 | -62 | * | -29 | * | -22 | * | 3 | ||
| Unweighted base - number of adults | 34,985 | |||||||||
| Domestic burglary | 713 | -70 | * | -33 | * | -22 | * | -10 | ||
| Domestic burglary in a dwelling | 499 | -71 | * | -33 | * | -23 | * | -11 | ||
| Domestic burglary in a non-connected building to a dwelling | 214 | -67 | * | -31 | * | -20 | * | -8 | ||
| Other household theft | 701 | -55 | * | -17 | * | -20 | * | -10 | ||
| Vehicle-related theft | 874 | -80 | * | -52 | * | -27 | * | -3 | ||
| Bicycle theft | 332 | -50 | * | -15 | * | -29 | * | -15 | * | |
| Criminal damage | 1,210 | -63 | * | -51 | * | -49 | * | -14 | * | |
| Unweighted base - number of households | 34,923 | |||||||||
| ALL CSEW CRIME | 6,432 | -66 | * | -39 | * | -31 | * | -7 | * | |
| Source: Crime Survey for England and Wales, Office for National Statistics | ||||||||||
| 1. More detail on further years can be found in Appendix Table A1. | ||||||||||
| 2. Section 5 of the User Guide provides more information about the crime types included in this table. | ||||||||||
| 3. Statistically significant change at the 5% level is indicated by an asterisk. | ||||||||||
Download this table Table 1: Number of CSEW incidents for year ending December 2015 and percentage change^1^,
.xls (178.7 kB)The 7% decrease in the estimate of all CSEW crime for the year ending December 2015 compared with the previous year’s survey was largely driven by decreases in theft offences (down 7% to 3.8 million offences) and criminal damage (down 14% to 1.2 million offences).
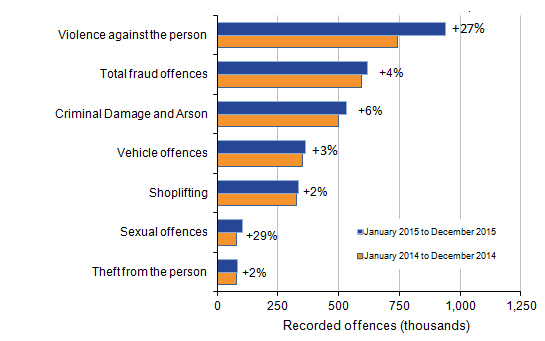
Police recorded crime increased by 7% in the year ending December 2015 compared with the year ending December 2014. This was largely driven by increases in "violence against the person" offences (up 27% to 939,518 offences) along with increases in public order offences (up 28% to 193,310 offences), criminal damage and arson offences (up 6% to 531,693 offences), sexual offences (up 29% to 103,614 offences) and fraud (up 4% to 617,618 offences). While total theft offences have remained broadly similar, there have been increases in the subcategories of vehicle offences (up 3% to 364,468) and shoplifting (up 2% to 333,671) offset by decreases in burglary (down 4% to 401,718) and bicycle theft (down 7% to 87,895).
Table 2: Number of police recorded crimes for year ending December 2015 and percentage change1,2,3
| England and Wales | ||||
| Offence group | January 2015 to December 2015 compared with: | |||
| Jan '15 to Dec '15 | Apr '04 to Mar '05 | Apr '09 to Mar '10 | Jan '14 to Dec '14 | |
| Number | Percentage change | |||
| VICTIM-BASED CRIME | 3,388,070 | -33 | -10 | 8 |
| Violence against the person offences | 939,518 | 11 | 34 | 27 |
| Homicide | 573 | -34 | -8 | 11 |
| Violence with injury4 | 418,261 | -19 | 4 | 15 |
| Violence without injury5 | 520,684 | 58 | 75 | 38 |
| Sexual offences | 103,614 | 70 | 95 | 29 |
| Rape | 34,741 | 148 | 130 | 30 |
| Other sexual offences | 68,873 | 47 | 82 | 29 |
| Robbery offences | 50,772 | -44 | -32 | -2 |
| Robbery of business property | 5,463 | -31 | -33 | -1 |
| Robbery of personal property | 45,309 | -45 | -32 | -2 |
| Theft offences | 1,762,473 | -38 | -17 | -0 |
| Burglary | 401,718 | -41 | -26 | -4 |
| Domestic burglary | 193,851 | -40 | -28 | -3 |
| Non-domestic burglary | 207,867 | -42 | -24 | -5 |
| Vehicle offences | 364,468 | -56 | -26 | 3 |
| Theft of a motor vehicle | 81,158 | -67 | -31 | 8 |
| Theft from a vehicle | 239,336 | -52 | -29 | -3 |
| Interfering with a motor vehicle | 43,974 | -43 | 16 | 35 |
| Theft from the person | 82,384 | -33 | -11 | 2 |
| Bicycle theft | 87,895 | -17 | -20 | -7 |
| Shoplifting | 333,671 | 19 | 8 | 2 |
| All other theft offences6 | 492,337 | -41 | -16 | -1 |
| Criminal damage and arson | 531,693 | -55 | -34 | 6 |
| OTHER CRIMES AGAINST SOCIETY | 429,759 | -5 | -15 | 7 |
| Drug offences | 150,780 | 3 | -36 | -16 |
| Trafficking of drugs | 26,257 | 9 | -21 | -6 |
| Possession of drugs | 124,523 | 2 | -38 | -17 |
| Possession of weapons offences | 24,621 | -39 | -14 | 15 |
| Public order offences | 193,310 | 1 | 3 | 28 |
| Miscellaneous crimes against society | 61,048 | -19 | 17 | 22 |
| TOTAL RECORDED CRIME - ALL OFFENCES INCLUDING FRAUD7 | 4,435,447 | -21 | 2 | 7 |
| Source: Police recorded crime, Home Office | ||||
| 1. Police recorded crime data are not designated as National Statistics. | ||||
| 2. Police recorded crime statistics based on data from all 44 forces in England and Wales (including the British Transport Police). | ||||
| 3. Appendix table A4 provides detailed footnotes and further years. | ||||
| 4. Includes attempted murder, intentional destruction of viable unborn child, causing death by dangerous driving/careless driving when under the influence of drink or drugs, more serious wounding or other act endangering life (including grievous bodily harm with and without intent), causing death by aggravated vehicle taking and less serious wounding offences. | ||||
| 5. Includes threat or conspiracy to murder, harassment, other offences against children and assault without injury (formerly common assault where there is no injury). | ||||
| 6. All other theft offences now includes all 'making off without payment' offences recorded since year ending March 2003. Making off without payment was previously included within the fraud offence group, but following a change in the classification for year ending March 2014, this change has been applied to previous years of data to give a consistent time series. | ||||
| 7. Total fraud offences cover crimes recorded by the National Fraud Intelligence Bureau via Action Fraud, Cifas and Financial Fraud Action UK. Action Fraud have taken over the recording of fraud offences on behalf of individual police forces. Percentage changes compared with earlier years are not presented, as fraud figures for year ending March 2005 and year ending March 2010 covered only those crimes recorded by individual police forces. Given the addition of new data sources, it is not possible to make direct comparsions with earlier years. | ||||
Download this table Table 2: Number of police recorded crimes for year ending December 2015 and percentage change^1,2,3^
.xls (180.7 kB)Victim-based crime (including fraud), which covers offences with a specific identifiable victim, accounted for 90% of all police recorded crime. There were 4 million offences recorded in the year ending December 2015, an increase of 7% compared with the previous year. Excluding fraud, there were 3.4 million victim-based offences, equivalent to 59 recorded offences per 1,000 resident population in England and Wales (Table 5; this should not be read as a victimisation rate as multiple offences could be reported by the same victim).
Figure 2 focuses on selected police recorded crime offences with notable changes in the year ending December 2015 compared with the previous year.
Figure 2: Selected police recorded crime offences in England and Wales: volumes and percentage change between year ending December 2014 and year ending December 2015
Source: Police recorded crime, Home Office
Notes:
- Police recorded crime data are not designated as National Statistics.
Download this image Figure 2: Selected police recorded crime offences in England and Wales: volumes and percentage change between year ending December 2014 and year ending December 2015
.png (12.2 kB) .xls (175.1 kB)
Violent crime
There was a 27% increase in "violence against the person" offences recorded by the police in the year ending December 2015 compared with the previous year. Improvements in crime recording processes by the police are thought to be the main driver of this change. The "violence without injury" subcategory showed an increase of 38% over the same period, while the "violence with injury" subcategory showed a smaller increase (15%). It should be noted that the more serious offences involving injury are generally less likely to have been affected by the crime recording improvements. In the year ending December 2015, the police also recorded 573 homicides, 56 more than the previous year2.
Additionally, part of the rise in violence without injury can also be attributed to a large increase (77%, 57,578 offences) in harassment, which mainly resulted from the expansion of this category in April 2015 to include 2 additional offence categories that were previously non-notifiable.
Estimates of violent crime from the CSEW have shown large falls since peak levels in the mid-1990s, but the latest year’s survey has shown little change compared with the previous year (the apparent 2% fall was not statistically significant).
See the ‘Violent crime’ section of this bulletin for more detailed analysis and commentary. Further data are available from Tables 6a, 6b, 7a and 7b.
Sexual offences
Sexual offences recorded by the police increased by 29% compared with the previous year, to a total of 103,614 across England and Wales. This is the first time that the total has risen above 100,000 offences in a year. Within this, the number of offences of rape increased by 30% (up to 34,741) and other sexual offences by 29% (up to 68,873). These rises are among the largest year-on-year increases since the introduction of the NCRS in year ending March 2003. It is thought that rises in police recorded sexual offences are likely to be due to an improvement in recording by the police and an increase in the willingness of victims to come forward and report to the police.
Although sexual offences are not included in the main CSEW estimates, it does provide some information on sexual offences from a self-completion questionnaire module on intimate violence. See the ‘Sexual offences’ section of this bulletin for more detailed analysis and commentary. Further data on police recorded sexual offences are available from Tables 10a and 10b.
Offences involving weapons
Offences involving firearms3 increased 4% (by 200 offences to 5,122) in the year ending December 2015 compared with the previous year. However, this was largely driven by an 18% increase in offences involving imitation and other weapons such as BB guns and soft air weapons; by contrast, offences involving handguns, shotguns and rifles decreased by 1%.
The number of offences that involved a knife or sharp instrument4 also showed an increase (9%) over the past 12 months. This contrasts with the general downward trend in this series over the longer-term, although the latest figures are 14% lower than in the year ending March 2011.
See the ‘Offences involving weapons’ section of this bulletin for more detailed analysis and commentary. Further data are available from Tables 11a, 11b and 12.
Robbery
Police recorded robberies fell 2% in the year ending December 2015 compared with the previous year, to 50,772 offences. The CSEW interviews estimated that there were 124,000 robbery offences in the year ending December 2015. However, the small number of robbery victims interviewed in any single year means that CSEW estimates are prone to fluctuation and the apparent 18% increase in robberies was not statistically significant.
See Tables 8a, 8b, 9a and 9b and Figure 8 for data related to this crime type.
Theft offences
Theft offences recorded by the police (which includes burglary, theft from the person, vehicle-related theft, bicycle theft, shoplifting and "all other theft offences") were at similar levels to the previous year, with a small decrease of 7,627 offences (-0.4%). The longer-term trend has shown year-on-year decreases since the year ending March 2003. Within the overall figure there were decreases in bicycle theft (7%), burglary (4%) and "all other theft offences" (1%) offset by increases in vehicle offences (3%), theft from the person (2%) and shoplifting (2%).
CSEW theft offences (which includes similar categories with the exception of shoplifting) fell by 7% in the year ending December 2015 compared with the previous year, to an estimated 3.8 million offences. This included an estimated 15% fall in bicycle theft (from 392,000 to 332,000).
A range of additional data related to different types of theft offences is provided in Tables 13 to 18 and Figures 9 to 13.
Fraud
In the year ending December 2015, the police recorded 617,618 fraud offences in England and Wales, an increase of 4% from the previous year. The police recorded crime series includes offences reported to Action Fraud (the national fraud and cybercrime reporting centre) as well as those reported to the National Fraud Intelligence Bureau (NFIB) by 2 industry bodies: Cifas and Financial Fraud Action UK (FFA UK).
Fraud is an offence not currently included in the CSEW headline estimate. We are conducting work to extend the main victimisation module in the CSEW to cover elements of fraud and cybercrime. Initial findings from a recent field trial of newly developed survey questions can be found in the methodological note ‘CSEW Fraud and Cyber-crime development: Field trial’.
See the ‘Fraud’ section of this bulletin for more detailed analysis and commentary. Further data are available from Tables 22a, 22b and 23.
Criminal damage
The police recorded 531,693 criminal damage and arson offences in the year to December 2015, an increase of 6% from the previous year. This is likely to be due to improvements in police crime recording for criminal damage offences.
The number of incidents of criminal damage estimated by the CSEW in the year ending December 2015 was 1.2 million, a decrease of 14% compared with the previous year, continuing the downward trend seen since the year ending March 2009 survey.
See Tables 19a, 19b, 20a and 20b and Figure 14 for data related to this crime type.
Other crimes against society5
Other crimes against society (those crimes that do not have a specific identifiable victim) accounted for 10% of all police recorded crime, with 429,759 offences recorded in the year ending December 2015 (an increase of 7% compared with the previous year). Trends in such offences often reflect changes in police activity and workload, rather than levels of criminality (without a direct victim, recording of these offences is directly related to policing practices). Anecdotal evidence from forces also suggests that some increases in this grouping, such as those seen in public order offences, are being driven by a tightening of recording practices. Public order offences accounted for the largest volume rise within this offence category with an increase of 28% (up by 42,210). Miscellaneous crimes against society increased by 22% (up by 10,883), offences involving possession of weapons increased by 15% (up by 3,218), but drug offences decreased by 16% (down by 28,065).
See Tables 21a and 21b and Figure 15 for data related to this crime type.
Notes:
- Victim-based crimes are those offences with a specific identifiable victim. These include the CSEW categories of violence, robbery, theft offences, and criminal damage and the police recorded crime categories of violence against the person, sexual offences, robbery, theft offences, and criminal damage and arson.
- Homicide includes the offences of murder, manslaughter, corporate manslaughter and infanticide. Figures from the Homicide Index for the time period April 2014 to March 2015, which take account of further police investigations and court outcomes, were published in Focus on Violent Crime and Sexual Offences, year ending March 2015 on 11 February 2016.
- Firearms include shotguns; handguns; rifles; imitation weapons such as BB guns or soft air weapons; other weapons such as CS gas or pepper spray and stun guns; and unidentified weapons. It excludes conventional air weapons such as air rifles.
- Only selected violent offences can be broken down by whether a knife or sharp instrument was used. These are: homicide; attempted murder; threats to kill; assault with injury and assault with intent to cause serious harm; robbery; rape; and sexual assault.
- ‘Other crimes against society’ cover offences without a direct victim, and includes drug offences, possession of weapon offences, public order offences and miscellaneous crimes against society.
6. Violent crime
Violent crime in the Crime Survey for England and Wales (CSEW) is referred to as “violence”, and includes wounding and assault (for both completed and attempted incidents). There is also an additional breakdown of violence with, or without, injury. Violent offences in police recorded data are referred to as “violence against the person” and include homicide, violence with injury, and violence without injury. As with the CSEW, both actual and attempted assaults are included in the figures. There are some closely related offences in the police recorded crime series, such as public order offences, that have no identifiable victim and are within the other crimes against society category.
CSEW Violence
Latest CSEW estimates show there were 1.3 million violent incidents in England and Wales in the year ending December 2015; a similar level compared with last year’s survey (the apparent 2% fall was not statistically significant) (Figure 3).
Figure 3: Trends in violence, Crime Survey for England and Wales year ending December 1981 to year ending December 2015
England and Wales

Source: Crime Survey for England and Wales, Office for National Statistics
Notes:
Prior to the year ending March 2002, CSEW respondents were asked about their experience of crime in the previous calendar year, so year-labels identify the year in which the crime took place. Following the change to continuous interviewing, respondents’ experience of crime relates to the full 12 months prior to interview (that is, a moving reference period). Year-labels for year ending March 2002 identify the CSEW year of interview.
The number of incidents is derived by multiplying incidence rates by the population estimates for England and Wales.
Download this image Figure 3: Trends in violence, Crime Survey for England and Wales year ending December 1981 to year ending December 2015
.png (18.2 kB) .xls (176.6 kB)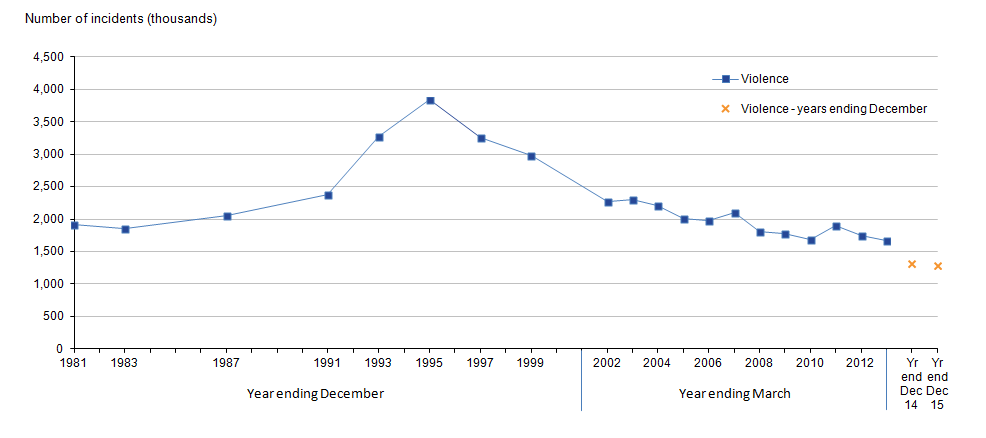
The CSEW subcategories of “violence with injury” and “violence without injury” also showed no significant change when compared with the previous year (the apparent 3% fall in violence without injury was not statistically significant).
The number of violent incidents estimated by the survey has decreased by around two-thirds since the peak in 1995 (Table 6b). Around 2 in every 100 adults were a victim of violent crime in the last year, based on the year ending December 2015 survey, compared with around 5 in 100 adults in the 1995 survey (Table 6a). Estimates of violence against 10 to 15 year olds, as measured by the CSEW, can be found in Table 25.
Recent trends in violent crime, as shown by the CSEW, are also reflected in evidence from research conducted by the Violence and Society Research Group at Cardiff University. Findings from their annual survey, covering a sample of hospital emergency departments and walk-in centres in England and Wales, show that serious violence-related attendances in 2015 were broadly similar to the level recorded in 2014 following a declining trend seen in earlier years. In addition, the most recent provisional National Health Service (NHS) data available on assault admissions to hospitals in England show that, for the 12 months to the end of April 2015, there were 28,992 hospital admissions for assault, a reduction of 8% compared with figures for the preceding 12 months1.
Police recorded crime – violence against the person
The number of "violence against the person" offences recorded by the police in the year ending December 2015 showed a 27% increase compared with the previous year (up from 740,860 to 939,518, Tables 7a and 7b). This includes much larger increases in the category of “violence without injury” (up 38%), compared with “violence with injury” (up 15%).
The increase in the “violence with injury” category includes a 31% rise in attempted murder, up 165 offences to 689 in the year ending December 2015. Attempted murder has risen in 31 of the 44 police forces in England and Wales. Although consistent with the increase in homicide over the same period, figures for attempted murder may have been influenced by improvements in crime recording. Prior to the recent tightening of recording practices it is possible that some police officers may have been applying Crown Prosecution Service charging standards (guidelines on what charges should be brought against suspects) when deciding what type of crime to record rather than basing the decision on the Home Office Counting Rules (HOCR). Attempted murder is an important example of this potential issue as offences may have previously been recorded (and charged) as another type of violent crime that is easier to prove in court, such as “wounding with intent”.
The increase in “violence without injury” is partially due to a 77% rise in harassment, up 57,578 offences in the year ending December 2015. The rise in harassment is largely due to the inclusion since April 2015 of 2 additional offences ("disclosure of private sexual photographs and films with the intent to cause distress or anxiety" and "sending letters with intent to cause distress or anxiety") that were previously non-notifiable offences.
Recent changes in recording practice make interpreting trends in violence against the person offences difficult. The latest figures represent the highest volume of violence against the person offences since the introduction of the National Crime Recording Standard (NCRS) in the year ending March 2003 (11% above that recorded at the previous peak of the time series in 2005, Table 7b).
It is known that violent offences are more prone than some other offences to subjective judgement about whether or not to record a crime. The Crime-recording: making the victim count report, published by Her Majesty’s Inspectorate of Constabulary (HMIC), found that violence against the person offences had the highest under-recording rates across police forces in England and Wales. Nationally, an estimated 1 in 3 (33%) violent offences that should have been recorded as crimes were not. The ‘Accuracy of the statistics’ section has more information.
Action taken by police forces to improve their compliance with the NCRS is likely to have resulted in the increase in the number of offences recorded2. It is thought that recording improvements are more likely to affect relatively less serious violent offences and explains the larger increase in the subcategory “violence without injury” compared with “violence with injury”. Previous evidence provided by the National Police Chief’s Council (NPCC) stated that, whilst police recorded "violence against the person" increased by 23% in the year ending March 2015, the number of “calls for service” relating to violent crime rose by 1%. Calls for service refer to emergency and non-emergency calls from members of the public and referrals from partner agencies (such as education, health and social services) for police to attend an incident or investigate a case. This, along with the evidence from the CSEW, suggests the rise in recorded violence against the person is largely due to process improvements rather than a genuine rise in violent crime.
Every police force recorded a rise in violence in the year ending December 2015 compared with the previous year. The largest volume increase was reported by the Metropolitan Police Service, which recorded an additional 28,546 offences compared with the previous year (an increase of 18%). Other large volume increases included West Yorkshire Police (up 19,328 offences, 77%), Hampshire Constabulary (up 16,569 offences, 67%), and Greater Manchester Police (up 11,870 offences, 31%). West Yorkshire Police had the largest percentage increase (77%); followed by: Hampshire (67%), Warwickshire (up 66% to 7,608) and West Mercia (up 64% to 21,426) (Tables P1 and P2).
Police recorded crime – domestic abuse
Another possible factor behind the rise in police recorded violent offences is an increase in the reporting of domestic abuse and the subsequent recording of these offences by the police. In 2015, the HMIC report ‘Increasingly everyone's business: A progress report on the police response to domestic abuse’ detailed the improvements in the police response to domestic abuse that had taken place across England and Wales and concluded that recent increases in the number of domestic-abuse-related crimes were due, in part, to police forces improving their recording of domestic-abuse incidents as crimes and to forces actively encouraging victims to come forward to report these crimes.
The Home Office has been collecting information from the police, since April 2015, on whether recorded offences are related to domestic abuse. Crimes are “flagged” as being “domestic abuse related” by the police if the offence meets the government definition of domestic violence and abuse3. Provisional data4 from the police for the 9 months from April to December 2015 show that "violence against the person" offences were the most likely to be flagged (Figure 4) with around a third (33%) of such offences flagged as domestic abuse. The offence group with the next highest proportion of offences flagged as domestic-abuse-related was sexual offences (12%).
Figure 4: Proportion of offences recorded by the police in England and Wales which were flagged as domestic abuse related, selected offence groups, April to December 2015
England and Wales
Source: Police recorded crime, Home Office
Notes:
Police recorded crime data are not designated as National Statistics.
All forces have returned data to the Home Office for the first nine months of the financial year. These data are provisional.
Download this chart Figure 4: Proportion of offences recorded by the police in England and Wales which were flagged as domestic abuse related, selected offence groups, April to December 2015
Image .csv .xlsPolice recorded crime – homicide
The recording of homicides is not prone to changes in recording practice by the police. In the year ending December 2015, the police recorded 573 homicides, 56 more than in the previous year, which represents an increase of 11% (Tables 7a and 7b). In the last year there were 2 months with a relatively high number of recorded homicides (June 2015, 72 and November 2015, 63), while the comparator year ending December 2014 included 2 months with relatively low numbers of recorded homicide (May 2014, 30 and February 2014, 31) – this resulted in a particularly large year-on-year change in the year ending December 2015. These increases were spread across a number of police force areas.
Historically, the number of homicides increased from around 300 per year in the early 1960s to over 800 per year in the early years of this century, which was at a faster rate than population growth over that period. Over the past decade the volume of homicides has generally decreased while the population of England and Wales has continued to grow. Based on police recorded crime data, the rate of homicide has fallen by over a third between the years ending March 2005 and December 2015, from 16 homicides per million of the population to 10 homicides per million.
There is more detailed information on trends and the circumstances of violence against the person in Focus on Violent Crime and Sexual Offences, year ending March 2015. Information on other violent crimes such as modern slavery, female genital mutilation (FGM) and hate crime is available in the ‘Violent crime’ section of the previous report Crime in England and Wales, year ending September 2015.
Notes:
- Based on the latest available National Health Service (NHS) Hospital Episode Statistics and hospital admissions due to assault (dated 24 July 2015). These don’t include figures for Wales and relate to activity in English NHS hospitals.
- The inspections took place over the period December 2013 to August 2014, this falls within the time period covered by the comparator year in this release. The current year covers the year ending December 2015 and the comparator year covers the year ending December 2014.
- Any incident or pattern of incidents of controlling, coercive or threatening behaviour, violence or abuse between those aged 16 or over who are or have been intimate partners or family members regardless of gender or sexuality.
- These data have not been reconciled with police forces.
7. Sexual offences
It is difficult to obtain reliable information on the volume of sexual offences as it is known that many of these offences go unreported to the police compared with other types of offence1. Sexual offences are also not included in the headline estimates of crime produced from the Crime Survey for England and Wales (CSEW).
Police recorded crime figures showed an increase of 29% in all sexual offences for the year ending December 2015 compared with the previous year (up from 80,265 to 103,614; Table 10a), reaching the highest volume recorded since the introduction of the National Crime Recording Standard (NCRS) in April 2002 and marking the first time that the total number of offences has exceeded 100,000 in a given year. The latest rise remains among the largest year-on-year increases since the introduction of the NCRS, although it is not as steep as those seen in the years ending March, June and September 2015 (36% to 41%).
Police recorded rape increased by 30% (to 34,741 offences) compared with the previous year, while other sexual offences increased by 29% (to 68,873 offences). Offence categories that directly relate to sexual offences against children2 contributed 44% to the total increase in sexual offences recorded by the police.
Figure 5: Trends in sexual offences recorded by the police in England and Wales, year ending March 2003 to year ending December 2015
Source: Police recorded crime, Home Office
Notes:
Police recorded crime data are not designated as National Statistics.
The Sexual Offences Act 2003, introduced in May 2004, altered the definition and coverage of sexual offences
Download this chart Figure 5: Trends in sexual offences recorded by the police in England and Wales, year ending March 2003 to year ending December 2015
Image .csv .xlsBetween the year ending March 2008 and the year ending March 2013, the trend in sexual offences was broadly flat with small increases recorded in some years. Since the year ending March 2013, the number of police recorded sexual offences has risen consistently. In 2013 the increases were generally driven by a rise in the recording of historical offences (those that took place more than 12 months before being recorded by the police), whereas the increases seen throughout 2014 and 2015 (particularly the most recent quarters) have been largely due to a rise in current offences (those that took place within 12 months of being recorded by the police).
Overall, the increases are believed to have resulted from both an improvement in the recording of sexual offences by the police and an increased willingness of victims to come forward and report these crimes to the police. HMIC’s inspection of crime recording, published in late 2014, found that sexual offences had been substantially under-recorded (by 26% nationally) and led to police forces reviewing and improving their recording processes3. Additionally, the high-profile coverage of sexual offences, and the police response to reports of historic sexual offending (for example, through Operation Yewtree which began in 2012) are likely to have had an effect on the willingness of victims to come forward and report offences of this nature.
More information on interpreting trends in these offences can be found in An Overview of Sexual Offending in England and Wales and Focus on Violent Crime and Sexual Offences, year ending March 2015.
CSEW – estimates of sexual offences
Due to the small number of sexual offences identified in the face-to-face interview section of the CSEW, estimates of the volume of incidents are prone to fluctuation and therefore not included in the main CSEW estimate of crime. Since the year ending March 2005, the CSEW has included a self-completion questionnaire module on intimate violence, for persons aged 16 to 59 only, which provides an improved measure of the proportion of people who have been victims of sexual offences in this age group.
Most recent headline estimates from this self-completion section of the CSEW for the year ending March 2015, released as part of the supplementary tables, showed that the proportion of people who had been victims of sexual assaults in the last year (including attempted offences) had not significantly changed between the year ending March 2015 (1.7%) and the previous year (1.5%). These figures have remained fairly stable in recent years. Estimates of the proportion of people who were victims of rape or attempted rape were unchanged from the previous year (0.3%). Throughout the last 10 years, estimated levels have ranged between 0.3% and 0.6%. This provides further evidence that changes in the willingness of victims to report and in the police response are likely to be responsible for the increase in police recorded sexual offences rather than an increase in levels of victimisation.
Detailed findings from the self-completion module for the year ending March 2015 CSEW are available in Focus on Violent Crime and Sexual Offences: Year ending March 2015.
Notes:
- As frequently indicated in the findings from the CSEW self-completion module on intimate violence, for example, presented in Focus on Violent Crime and Sexual Offences, year ending March 2015.
- This includes "Rape of a male/female child under 16", "Rape of a male/female child under 13", "Sexual assault on a male/female child under 13", "Sexual activity involving a child under 13/under 16" and "Abuse of children through sexual exploitation".
- More information can be found in Crime in England and Wales: Year ending September 2015.
8. Offences involving weapons
Offences involving knives or sharp instruments
Some of the more serious offences in the recorded crime data (violent, robbery and sexual offences) can be broken down by whether or not a knife or sharp instrument was involved1.
In the year ending December 2015, the police recorded 28,008 offences involving a knife or sharp instrument, a 9% increase compared with the previous year (25,583, Table 3). There has been a general downward trend in this series over the longer-term, and the latest figures are 14% lower than in year ending March 2011. However, the majority of police forces (35 of the 44) recorded a rise in these offences compared with the previous year. The largest contributor to the total rise was the Metropolitan Police Service (accounting for 17% of the increase). Data for police force areas are published in the Home Office’s knife crime open data table.
Table 3: Number of selected violent and sexual offences involving a knife or sharp instrument recorded by the police, year ending March 2011 to year ending December 2015 and percentage change1,2,3,4,5
| England and Wales | ||||||
| Selected offence type | Number of selected offences involving a knife or sharp instrument | Jan '15 to Dec '15 compared to previous year | ||||
| Apr '10 to Mar '11 | Apr '11 to Mar '12 | Apr '12 to Mar '13 | Jan '14 to Dec '14 | Jan '15 to Dec '15 | ||
| percentage change | ||||||
| Attempted murder | 240 | 246 | 198 | 244 | 354 | 45 |
| Threats to kill | 1,462 | 1,183 | 1,188 | 1,637 | 2,018 | 23 |
| Assault with injury and assault with intent to cause serious harm6 | 13,941 | 12,621 | 11,343 | 12,611 | 14,566 | 16 |
| Robbery | 16,438 | 16,417 | 13,194 | 10,464 | 10,432 | -0 |
| Rape | 258 | 237 | 190 | 309 | 334 | 8 |
| Sexual assault7 | 93 | 72 | 88 | 116 | 123 | 6 |
| Total selected offences | 32,432 | 30,776 | 26,201 | 25,381 | 27,827 | 10 |
| Homicide8 | 237 | 211 | 195 | 202 | 181 | -10 |
| Total selected offences including homicide | 32,669 | 30,987 | 26,396 | 25,583 | 28,008 | 9 |
| Source: Police recorded crime, Home Office | ||||||
| 1. Police recorded crime data are not designated as National Statistics. | ||||||
| 2. Police recorded crime statistics based on data from all 44 forces in England and Wales (including the British Transport Police). | ||||||
| 3 Police recorded knife and sharp instrument offences data are submitted via an additional special collection. Proportions of offences involving the use of a knife or sharp instrument presented in this table are calculated based on figures submitted in this special collection. Other offences exist that are not shown in this table that may include the use of a knife or sharp instrument. | ||||||
| 4. Surrey police force includes unbroken bottle and glass offences in their returns, which are outside the scope of this special collection however it is not thought that offences of this kind constitute a large enough number to impact on the national figure. | ||||||
| 5. Numbers differ from those previously published due to Sussex police revising their figures to exclude unbroken bottles. | ||||||
| 6. Changes to offence codes in April 2012 mean the category of assault with injury and assault with intent to cause serious harm is not directly comparable with previous years. Appendix table A4 contains more details. | ||||||
| 7. Sexual assault includes indecent assault on a male/female and sexual assault on a male/female (all ages). | ||||||
| 8. Homicide offences are those currently recorded by the police as at 1/03/16 and are subject to revision as cases are dealt with by the police and by the courts, or as further information becomes available. They include the offences of murder, manslaughter, infantIcide and, as of year ending March 2013, corporate manslaughter. These figures are taken from the detailed record level Homicide Index (rather than the main police collection for which forces are only required to provide an overall count of homicides, used in Table A4). There may therefore be differences in the total homicides figure used to calculate these proportions and the homicide figure presented in Table A4. | ||||||
Download this table Table 3: Number of selected violent and sexual offences involving a knife or sharp instrument recorded by the police, year ending March 2011 to year ending December 2015 and percentage change^1,2,3,4,5^
.xls (179.7 kB)Most of the offence groups for which data are collected showed increases, but the rise was most pronounced in the category of “assault with injury and assault with intent to cause serious harm2” (up 16%, from 12,611 to 14,566).
From the year ending March 2013 to the year ending December 2015, with the exceptions of homicide and robbery offences, there have been increases in the numbers of offences where a knife or sharp instrument was used. These increases broadly reflect increases in the overall level of these offences – for example, the 16% rise in the number of “assault with injury and assault with intent to cause serious harm” offences involving a knife or sharp instrument is similar to the 15% rise seen in all incidents of this offence in the year ending December 2015. However, the increase in attempted murders involving a knife or sharp instrument (45%) is higher than the increase in total attempted murders (31%) in the year ending December 2015. This may have been influenced by improvements in crime recording, with offences previously being more likely to be recorded according to the CPS charging standard rather than the Home Office Counting Rules and the National Crime Recording Standard (NCRS). For example, it might have been recorded (and charged) as another type of violent crime that is easier to prove in court, such as “wounding with intent”.
It is generally thought that some of these categories of offence are less likely to be influenced by changes in recording practice than less serious violent crime, and this latest rise may represent a real change to the downward trend seen in recent years (and a more proactive police response to knife crime). For example, in relation to the Capital, data from the London Ambulance Service showed a 9% rise in ambulance incidences resulting from assaults involving a knife injury (for the year ending October 2015, compared to the previous year3) . However, there is also the suggestion that recording process improvements may have been a factor. For example, anecdotal evidence relating to the Metropolitan Police Service4 suggests that previously, knife-related crimes where the victim was unwilling to engage with the police were being recorded on intelligence systems but not on the force’s crime recording system. Following the renewed focus on crime recording, such incidents are now being included within the crime recording system and are likely to have contributed to the rise in such offences within the statistics.
Other evidence, albeit focused on the most serious knife-related crimes relating to hospital admissions for assault with a sharp instrument5, have shown little change over the past year following declines in previous years. For the year ending April 2015 there were 3,614 admissions for assault with a sharp instrument compared with a peak of 5,720 in the year ending March 20076, although such incidents may not be representative of all knife-related crime.
Taken together, the above suggests the picture is a complex one with potential contributors to the reported rise in knife crime being improvements in recording processes, a genuine rise in knife crime, and a more proactive police response to it (for example, in July 2015, some police forces stepped up activity to tackle knife crime to coincide with the introduction of a new sentencing requirement following a change in legislation). Given the complexity surrounding this issue, further investigations and discussions are being undertaken with the Home Office and police forces to build a clearer picture. Possession of a knife or sharp instrument also rose by 16% to 11,227 offences in the year ending December 2015. This figure can often be influenced by increases in targeted police action in relation to knife crime.
Further analysis on offences involving knives or sharp instruments has been published in Focus on Violent Crime and Sexual Offences, year ending March 2015.
Offences involving firearms
Similar to the breakdown of offences involving knives or sharp instruments, statistics are available for police recorded crimes involving the use of firearms7. Firearms are taken to be involved in an offence if they are fired, used as a blunt instrument against a person, or used as a threat. Focus on Violent Crime and Sexual Offences, year ending March 2015 has more detailed information on trends and the circumstances of offences involving firearms, including figures based on a broader definition of the types of firearm involved8.
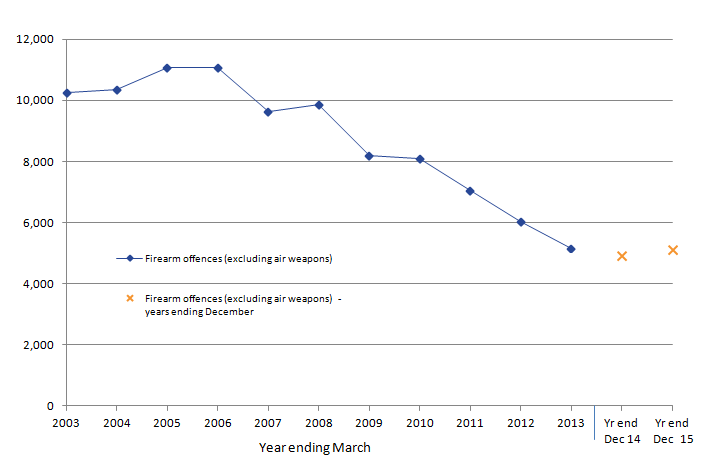
Figure 6: Trends in police recorded crime in England and Wales involving the use of firearms, year ending March 2003 to year ending December 2015
England and Wales
Source: Police recorded crime, Home Office
Notes:
Police recorded crime data are not designated as National Statistics
Firearms include shotguns; handguns; rifles; imitation weapons such as BB guns or soft air weapons; other weapons such as CS gas or pepper spray and stun guns; and unidentified weapons. It excludes conventional air weapons such as air rifles
Download this image Figure 6: Trends in police recorded crime in England and Wales involving the use of firearms, year ending March 2003 to year ending December 2015
.png (14.1 kB) .xls (174.6 kB)
Figures for the year ending December 2015 show 5,122 offences involving firearms were recorded in England and Wales, a 4% increase compared with the previous year (4,922, Tables 11a and 11b).This follows a general downward trend in these offences since the year ending March 2006 (Figure 6). Additional analysis of offences involving firearms by weapon type shows that the 4% increase seen in the last year is driven by increases in offences involving imitation firearms and "other" firearms (Table 12). Over 80% of offences involving imitation firearms were for BB guns or soft air weapons, while around 70% of offences involving other firearms were for CS gas, pepper spray or stun guns. Offences involving handguns fell by 1% over the same time period, while there was a small increase (7 offences) in those involving shotguns. Despite this latest increase, the overall level of firearms offences remained 54% below its peak.
Offences involving firearms are thought to be less likely to have been affected by changes in recording practices due to their serious nature. However, there may be similar process improvements as seen with knife-related offences, given the increases seen in the less serious firearms categories.
Notes:
- A sharp instrument is any object that pierces the skin (or in the case of a threat, is capable of piercing the skin), for example a broken bottle.
- Changes to offence codes in April 2012 mean the category of "assault with injury" and "assault with intent to cause serious harm" are not directly comparable with previous years. Appendix table A4 contains more details.
- Monthly Ambulance Service Incidents, Ward, November 2015, contains details of London Ambulance Service incidents, between October 2014 and October 2015, by type of injury.
- Comments on Twitter from police personnel.
- While it is a requirement to record every hospital admission, completing the field for external cause is not always done.
- Based on the latest National Health Service (NHS) Hospital Episode Statistics and hospital admissions due to assault (dated 24 July 2015). These do not include figures for Wales and relate to activity in English NHS hospitals. A graph based on financial years is available in the latest Focus on Violent Crime and Sexual Offences release.
- Firearms include shotguns; handguns; rifles; imitation weapons; other weapons such as CS gas or pepper spray and stun guns; and unidentified weapons. It excludes conventional air weapons such as air rifles.
- The broader definition of firearms used in the Focus on Violent Crime and Sexual Offences, year ending March 2015 publication includes conventional air weapons such as air rifles.
9. Fraud
The extent of fraud is difficult to measure because it is a deceptive crime, often targeted indiscriminately at organisations as well as individuals. Some victims of fraud may be unaware they have been a victim of crime, or that any fraudulent activity has occurred. Others may be reluctant to report the offence to the authorities, feeling embarrassed that they have fallen victim. The level of fraud reported via administrative sources is thought to significantly understate the true level of such crime.
This section draws on a range of sources, including police recorded crime data and data from the Crime Survey for England and Wales (CSEW). While no individual source provides a complete measure of the overall extent of fraud offences, together they help to provide a fuller picture. The note Improving crime statistics in England and Wales: Fraud provides more information on what we know about the extent and nature of fraud in England and Wales and where there are gaps in the coverage of official statistics.
The police recorded crime series incorporates offences recorded by Action Fraud alongside fraud data reported to the National Fraud Intelligence Bureau (NFIB) by 2 industry bodies: Cifas and Financial Fraud Action UK (FFA UK). Further details on the different sources of information on fraud in England and Wales are available in Section 5.4 of the User Guide.
Fraud is an offence not currently included in the CSEW headline estimate. We are conducting work to extend the main victimisation module in the CSEW to cover elements of fraud and cybercrime. There is further information in the data sources section of this bulletin and in the methodological note, Update – Extending the CSEW to include fraud and cyber crime. Initial findings from a recent field trial of newly developed survey questions can be found in the methodological note ‘CSEW Fraud and Cyber-crime development: Field trial’.
Total recorded fraud offences - overall picture
In the year ending December 2015, a total of 617,618 fraud offences were recorded in England and Wales (Table A4), equivalent to 11 offences per 1,000 population. This represents a volume increase of 4% compared with the previous year (Tables 22a and 22b).
Broken down by reporting body, fraud offences recorded by Action Fraud were broadly unchanged from the previous year at 224,683 offences. Fraud offences referred to the NFIB by the 2 industry bodies combined (Cifas and FFA UK) totalled 392,936 in the year ending December 2015. Separately, fraud offences referred by Cifas showed a 16% increase (from 254,843 offences to 295,525 offences); whereas those referred by FFA UK decreased by 15% (from 115,243 offences to 97,411 offences).
Victims of fraud may report incidents to Action Fraud via an online reporting tool or via a telephone helpline. In July 2015, the company that was contracted to provide the call centre service went into administration. This led to an immediate downscaling of the call centre operation. A new contractor, who was due to take over the Action Fraud call centre in April 2016, was asked to take over operations early in August 2015. However, as the new contractor was asked to begin early at short notice it has taken some time before the call centre returned to operating at its previous capacity.
Monthly volumes of fraud offences recorded by Action Fraud between August and December 2015 were lower than the totals recorded for the same period the previous year. By contrast, the total number of offences recorded during the period January to July 2015 was higher than seen in 2014. This discrepancy in the latest trends suggests that the level of fraud in the latter part of 2015 may have been subject to under-reporting since the change in operation of the Action Fraud call centre and the latest trends in Action Fraud data should therefore be interpreted with caution.
Types of fraud
A full breakdown of the types of fraud offences referred to the NFIB by Action Fraud, Cifas and FFA UK in the year ending December 2015 is presented in Appendix table A5.
The largest increases in categories of fraud referred to the NFIB were “banking and credit industry fraud” (up 12%, from 322,961 to 361,164 offences), “insurance fraud” (up 30%, from 8,553 to 11,152 offences) and “other frauds” (up 12%, from 34,843 to 39,000 offences).
Most of the increase in “banking and credit industry fraud” was in the volume of offences reported to the NFIB via Cifas (up 30%, from 183,920 to 239,044 offences). This rise was seen principally in the sub-category of frauds relating to “cheque, plastic card and online bank accounts” and is thought to have resulted from an increase in the volume of reported identity frauds in account applications (for example, applying to open a plastic card account using a false identity).
“Insurance fraud” accounts for a relatively small proportion of total fraud offences (2%), but increased by 30% from the year ending December 2014. The majority of this increase relates to frauds recorded by Cifas (as FFA UK do not collect data on this type of fraud).This is thought to have resulted specifically from a rise in insurance application frauds, largely due to an increase in the number of individuals attempting to get a cheaper policy by fraudulent means. Initiatives such as MyLicence and the Insurance Fraud Register may also be improving the insurance industry’s detection of such frauds.
Several major categories of fraud saw decreases in the year ending December 2015 compared with the previous period. “Advance fee payments” fraud fell by 10% (from 40,866 to 36,710 offences), “telecom industry fraud (misuse of contracts)” fell by 26% (from 64,013 to 47,254 offences), “computer misuse crime” fell by 6% (from 15,322 to 14,347 offences) and “financial investments fraud” fell by 10% (from 5,973 to 5,400 offences). “Non-investment fraud”, such as fraud related to online shopping or fraudulent computer service calls, remained fairly static with 94,866 offences compared with 95,334 in the previous year.
The fall in “advance fee payments” and “financial investments” fraud and the very small increase in “non-investment fraud” is in contrast with the increases that were recorded in these categories in the year ending September 2015. Data on these types of frauds came solely from reports to Action Fraud and therefore the changes seen may be related to potential under-recording caused by the reduction in capacity of the Action Fraud call centre since August 2015 rather than a real change in the level of these frauds.
More information on the different categories of fraud and how data on them is collected is available in Section 5.4 of the User Guide.
Card and bank account fraud not reported to the police
Data referred to the NFIB by Cifas and FFA UK are known to exclude a significant volume of card and bank account fraud. Cifas do not collect information on some types of plastic card fraud, including “remote purchase” frauds (those frauds where the cardholder and card are not present at the point of sale, such as use of the card online, over the phone or by mail order), fraud resulting from cards being lost or stolen, or ATM fraud. While FFA UK does collect this information, it only refers crimes to the NFIB in cases where there is intelligence value for the police to aid in investigating and detecting fraud.
FFA UK does, however, collect information from its members on a broader range of bank account and plastic card frauds than those referred to the NFIB using a system referred to as CAMIS, and data from this source are shown in Table 41. While these figures are at UK level only, they offer a broader picture of the scale of bank account and plastic card fraud. It is important to note that these data also include those cases referred by FFA UK to the NFIB (presented in Table 22a).
Table 4: Volume of fraud incidents on all payment types, FFA UK CAMIS database, year ending March 2011 to year ending December 20151,2
| United Kingdom | |||||||
| Apr '10 to Mar '11 | Apr '11 to Mar '12 | Apr '12 to Mar '13 | Jan '14 to Dec '14 | Jan '15 to Dec '15 | Jan '15 to Dec '15 compared to previous year | ||
| Numbers(thousands) | Percentage change | ||||||
| FFA UK FRAUD (CAMIS) | |||||||
| Plastic Card Fraud | 976 | 866 | 1,048 | 1,288 | 1,487 | 15 | |
| Lost and Stolen | 105 | 104 | 117 | 134 | 153 | 14 | |
| Card not Received | 7 | 8 | 9 | 9 | 11 | 17 | |
| Counterfeit Card | 90 | 80 | 106 | 99 | 93 | -7 | |
| Remote Purchase Fraud3 | 755 | 658 | 791 | 1,019 | 1,194 | 17 | |
| Account Take Over | 18 | 16 | 26 | 27 | 36 | 37 | |
| Cheque Fraud | 12 | 16 | 14 | 8 | 6 | -30 | |
| Remote Banking Fraud4 | 53 | 35 | 22 | 22 | 33 | 53 | |
| TOTAL | 1,041 | 918 | 1,084 | 1,318 | 1,526 | 16 | |
| Source: Financial Fraud Action UK | |||||||
| Notes: | |||||||
| 1. All offences are classed under HOCR as NFIB5A, cheque, plastic card and online bank accounts (non PSP). The categories they have been split into are FFA UK's break downs. | |||||||
| 2. The total number of offences here is including all offences that are also included in the FISS dataset. | |||||||
| 3. Remote purchase fraud includes telephone, internet and mail order fraud. | |||||||
| 4. Remote banking fraud includes telephone and internet banking. | |||||||
Download this table Table 4: Volume of fraud incidents on all payment types, FFA UK CAMIS database, year ending March 2011 to year ending December 2015^1,2^
.xls (170.5 kB)In the year ending December 2015, FFA UK reported 1.5 million cases of frauds on UK-issued cards, cheque fraud, and remote banking fraud (internet and telephone banking)2, an increase of 16% from the previous year. This contrasts with a 15% decrease in the level of these frauds that were reported by FFA UK to the NFIB. The cases reported to the NFIB are those with intelligence value to the police and are less likely to include incidences of “remote purchase” fraud, which are a key driver in the overall increase in fraud seen by FFA UK.
Around 1.2 million (78%) of these cases were “remote purchase” frauds, which include telephone, internet and mail order fraud, making it by far the largest category. Cases of fraud using lost and stolen cards accounted for 10% of the FFA UK fraud total (152,457 offences). Given the large volume of incidents, remote purchase frauds have been important in driving overall trends in plastic card fraud. Levels seen in the other (lower volume) categories of plastic card fraud have tended to fluctuate, though the underlying trend shows that levels are higher now than 5 years ago. There have been year-on-year falls in volumes of cheque fraud since the year ending March 2013, with a 30% fall recorded in the year ending December 2015. Remote banking fraud involving internet or telephone banking increased by 53% in the latest year, although volumes were down by over a third compared with the year ending March 2011.
Measuring plastic card fraud using the Crime Survey for England and Wales (CSEW)
Fraud is not currently included in the headline CSEW crime estimates (ongoing development work to address this gap is described in the ‘Data sources – coverage and coherence’ section). However, for a number of years, the survey has included supplementary modules of questions on plastic card (that is bank and credit card) fraud. These are currently reported separately from the headline estimates.
The results from the survey showed that 4.5% of plastic card owners were victims of card fraud in the last year; a similar level to the previous year’s survey. There have been small reductions in levels of plastic card fraud over the last few years, following a rise between the year ending March 2006 and year ending March 2010 surveys (Figure 7). In general, in previous years the CSEW trend in plastic card fraud has been consistent with those shown by FFA UK figures, with levels peaking around 2008 to 2010 followed by falls in subsequent years that were likely to be related to the introduction of chip and pin technology. However, the prevalence of plastic card fraud measured by the CSEW differs from the trend observed in FFA UK data, which showed a 15% rise. While the reasons for this difference are unclear at present as there are potentially many factors that can impact on either data series, the FFA UK data are likely to provide a more reliable indication of short-term trends than CSEW estimates, which can fluctuate in the short term due to sampling variability. However, the new CSEW estimates of fraud, due to be published in July 2016, may provide more detailed evidence. Further information on trends in payment industry fraud based on industry data collated by FFA UK is available in Fraud the Facts 2015.
The current level of victimisation remains higher than more established offences, for example theft from the person and other theft of personal property (0.8% and 1.5% respectively, Table 17a). Further analysis, based on the year ending March 2015 CSEW, was published as part of Focus on Property Crime: 2014 to 2015.
Figure 7: Proportion of Crime Survey for England and Wales plastic card users who had been a victim of plastic card fraud in the last year, year ending March 2006 to year ending December 2015
England and Wales
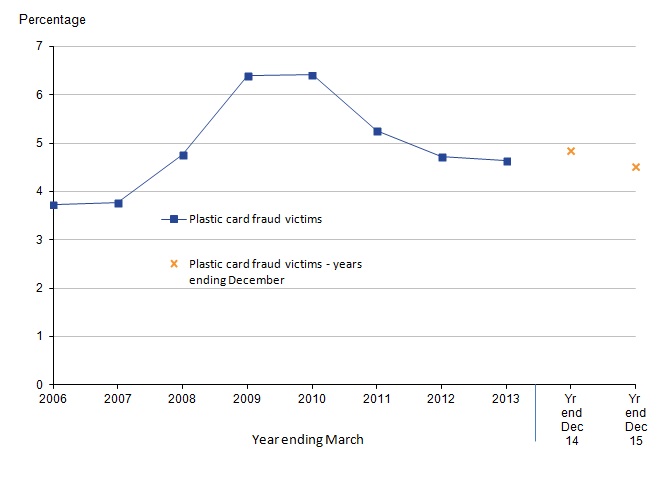
Source: Crime Survey for England and Wales, Office for National Statistics
Notes:
- The data on this chart refer to crimes experienced in the 12 months before interview, based on interviews carried out in that year.
Download this image Figure 7: Proportion of Crime Survey for England and Wales plastic card users who had been a victim of plastic card fraud in the last year, year ending March 2006 to year ending December 2015
.png (9.8 kB) .xls (176.1 kB)
Notes:
- FFA UK publish data on the volume of incidents of frauds on all payment types (including ‘remote purchase’), alongside data on financial fraud losses by the value of losses to customers. Latest figures for 2015 are available in their report ‘2015 Financial Fraud Figures’ published in March 2016.
- It is important to note that number of cases relates to the number of accounts defrauded, rather than the number of victims.
10. Data sources - coverage and coherence
Crime Survey for England and Wales
The Crime Survey for England and Wales (CSEW; previously known as the British Crime Survey) is a face-to-face survey in which people resident in households in England and Wales are asked about their experiences of crime in the 12 months prior to the interview. It covers both children aged 10 to 15 and adults aged 16 and over, but does not cover those living in communal establishments (such as care homes, student halls of residence and prisons), or crimes against commercial or public sector bodies. Respondents are interviewed in their own homes by trained interviewers using a structured questionnaire that is administered on a laptop computer using specialist survey software. The questions asked avoid the use of technical terms or legal definitions and are in plain English.
The information collected during the interview is later reviewed by a team of specialist coders employed by the survey contractors (currently TNS-BMRB) who determine whether or not what was reported amounts to a crime in law and, if so, what offence has been experienced. This “offence coding” aims to reflect the Home Office Counting Rules for recorded crime that govern how the police record offences reported to them. The CSEW is able to capture all offences experienced by those interviewed, not just those that have been reported to, and recorded by, the police. It covers a broad range of victim-based crimes experienced by the resident household population. However, there are some serious, but relatively low volume, offences, such as homicide and sexual offences, which are not included in its main estimates. Other crimes, such as plastic card fraud, are limited in their scope and are not part of the main survey.
A major strength of the CSEW has been its ability to compare crime types over time and for this reason the CSEW has changed little over the last 30 years. However, the way in which criminals are operating is changing and they can now take advantage of new technologies such as the internet to both expand the scope of existing crime types and develop new ones. Nowhere has this been more apparent than in fraud and cybercrime. As questions aimed at identifying fraud and other cyber offences were not part of the original survey design, it has not been possible to include these new offences in the main estimate of CSEW crime.
To address this issue, we have been engaged in a programme of work to place questions relating to fraud and cybercrime into the survey. The research has involved several stages of development culminating in a large-scale field trial, which took place between 20 May and 9 August 2015. The aim of the trial was to replicate the existing CSEW with the addition of the new fraud and cybercrime questions. The findings of the field trial and its recommendations, including estimates of fraud and cybercrime, were published in a report, Methodological note - CSEW Fraud and Cyber-crime development: Field trial - October 2015, alongside the statistical bulletin for the year ending June 2015.
Following the success of the field trial we introduced the new questions relating to fraud and cybercrime onto half the survey sample from October 2015. This means that from March 2016, sufficient data will have been gathered to produce estimates of fraud and cybercrime using these new data. These estimates will be released in July 2016 with the regular quarterly release for the year ending March 2016.
Since it began, the CSEW has been conducted by an independent (from government or the police) survey research organisation using trained interviewers to collect data from sampled respondents. The interviewers have no vested interest in the results of the survey. For the crime types and population groups it covers, the CSEW has a consistent methodology and is unaffected by changes in levels of public reporting to the police, recording practice or police activity. As such, the survey is widely seen to operate as an independent reality-check of the police figures. The independence of the survey has been further strengthened by the transfer of responsibility from the Home Office to ONS in April 2012.
The CSEW has a higher number of reported offences than police recorded crime as the survey is able to capture all offences by those interviewed, not just those that have been reported to the police and then recorded. However, it does cover a narrower range of offences than the police recorded crime collection.
The CSEW has necessary exclusions from its main count of crime (for example, homicide, crimes against businesses and other organisations, and drug possession). The survey also excludes sexual offences from its main crime count given the sensitivities around reporting this in the context of a face-to-face interview. However, at the end of the main interview there is a self-completion element (via a tablet computer), where adults aged 16 to 59 are asked about their experience of domestic abuse and sexual violence, and these results are reported separately1.
Since the survey started in 1982 (covering crime experienced in 1981) a core module of victimisation questions has asked about a range of offences experienced either by the household (such as burglary) or by the individual respondent (such as robbery). The methodologies employed have remained unchanged since the survey started enabling a consistent measure of crimes committed against individuals to be created over the last 30 years. One such methodology involves the estimates only including the first 5 incidents in any series of repeat crimes (known as capping) to ensure that estimates are not affected by respondents who report an extremely high number of crimes that may be variable between years. With recent attention placed on where the cap currently sits2 (with only the first 5 incidents included), we have initiated a programme of work to investigate the effect of capping on a range of crime types and whether increasing the cap (or removing it entirely) would improve the estimates. Further information on the programme of work being conducted by us in relation to capping is available in the methodological note ‘High frequency repeat victimisation in the Crime Survey for England and Wales’.
Since the survey is based on a sample of the population, estimates have a margin of quantifiable and non-quantifiable error associated with them. Non-quantifiable includes:
- when respondents have recalled crimes in the reference period that actually occurred outside that period (“telescoping”)
- crimes that did occur in the reference period that were not mentioned at all (either because respondents failed to recall a fairly trivial incident or, conversely, because they did not want to disclose an incident, such as a domestic assault)
- respondents saying they reported a crime to the police when they did not (a “socially desirable” response)
- some incidents reported during the interview being miscoded (“interviewer/coder error”)
In 2009, the CSEW was extended to cover children aged 10 to 15, and this release also incorporates results from this element of the survey. However, the main analysis and commentary is restricted to adults and households due to the long time series for which comparable data are available.
The CSEW has a nationally representative sample of around 35,000 adults and 3,000 children (aged 10 to 15 years) per year. The response rates for the survey in year ending March 2015 were 70% for adults and 60% for children. The survey is weighted to adjust for possible non-response bias and to ensure the sample reflects the profile of the general population. The CSEW technical report has more details of the methodology.
In July 2014, revised survey weights and a back-series were produced for the CSEW following the release of the new-2011 Census-based population estimates. Presentational and methodological improvements to National Statistics on the Crime Survey for England and Wales has more information.
Police recorded crime and other sources of crime statistics
Police recorded crime figures are supplied by the 43 territorial police forces of England and Wales, plus the British Transport Police, via the Home Office, to us. Data on fraud is sourced from Action Fraud, the UK’s national fraud reporting centre; Cifas, the UK-wide fraud and financial crime prevention service; and Financial Fraud Action UK, who co-ordinate fraud prevention activity for the financial services industry. The coverage of police recorded crime is defined by the Notifiable Offence List3, which includes a broad range of offences, from murder to minor criminal damage, theft and public order offences. However, there are some, mainly less serious offences, that are excluded from the recorded crime collection. These ‘non-notifiable’ crimes include many incidents that might generally be considered to be anti-social behaviour, but that may also be crimes in law (including by-laws) such as littering, begging and drunkenness. Other non-notifiable offences include driving under the influence of alcohol, parking offences and TV licence evasion. These offences are not covered in either of the 2 main series and are separately reported on in this release to provide additional context.
Police recorded crime is the primary source of sub-national crime statistics and for relatively serious, but low volume, crimes that are not well measured by a sample survey. It covers victims (including, for example, residents of institutions and tourists as well as the resident population) and sectors (for example, commercial bodies) excluded from the CSEW sample. Recorded crime has a wider coverage of offences, for example, covering homicide, sexual offences, and crimes without a specific, identifiable victim (referred to as “other crimes against society”) not included in the main CSEW crime count. Police recorded crime also provides good measures of well-reported crimes, but does not cover any crimes that are not reported to, or discovered by, the police. It is also affected by changes in reporting and recording practices. Like any administrative data, police recorded crime will be affected by the rules governing the recording of data, by the systems in place, and by operational decisions in respect of the allocation of resources.
As well as the main police recorded crime series, there are additional collections providing detail on offences involving the use of knives and firearms, which are too low in volume to be measured reliably by the CSEW. Data are also drawn from other sources to provide a more comprehensive picture. These include incidents of anti-social behaviour recorded by the police (which fall outside the coverage of notifiable offences), non-notifiable crimes dealt with by the courts (also outside the coverage of recorded crime or the CSEW), and the results of the Commercial Victimisation Surveys (based on a nationally representative sample of business premises in selected sectors each year).
More details of these sources can be found in the User Guide to Crime Statistics for England and Wales. Information on UK and international comparisons can be found in the ‘International and UK comparisons’ section of this bulletin.
Strengths and limitations of the CSEW and police recorded crime
Crime Survey for England and Wales |
Police recorded crime |
|---|---|
| Positive | Positive |
| Large nationally representative sample survey that provides a good measure of long-term trends for the crime types and the population it covers (that is, those resident in households) |
Has wider offence coverage and population coverage than the CSEW |
| Consistent methodology over time | Good measure of offences that are well-reported to the police |
| Covers crimes not reported to the police and is not affected by changes in police recording practice; therefore is a reliable measure of long-term trends |
The primary source of local crime statistics and for lower-volume crimes (for example, homicide) |
| Coverage of survey extended in 2009 to include children aged 10 to 15 resident in households |
Provides whole counts (rather than estimates that are subject to sampling variation) |
| Independent collection of crime figures |
Time lag between occurrence of crime and reporting results tends to be short, providing an indication of emerging trends |
| Negative | Negative |
| Survey is subject to error associated with sampling and respondents recalling past events |
Excludes offences that are not reported to, or not recorded by, the police and does not include less serious offences dealt with by magistrates’ courts (for example, motoring offences) |
| Excludes crimes against businesses and those not resident in households (for example, residents of institutions and visitors) |
Trends can be influenced by changes in recording practices or police activity |
| Headline estimates exclude offences that are difficult to estimate robustly (such as sexual offences) or that have no victim who can be interviewed (for example, homicides, and drug offences) |
Not possible to make long-term comparisons due to fundamental changes in recording practice introduced in 1998 and the year ending March 20034 |
| Excludes fraud and cybercrime5 | There are concerns about the quality of recording – crimes may not be recorded consistently across police forces and so the true level of recorded crime may be understated |
Notes:
- Focus on Violent Crime and Sexual Offences: Year ending March 2015 has more detailed information.
- For example, the article ‘Is violence increasing or decreasing?: a new methodology to measure repeat attacks making visible the significance of gender and domestic relations’ authored by Professor Sylvia Walby et al, published in the British Journal of Criminology, 3 February 2016.
- The Notifiable Offence List includes all indictable and triable-either-way offences (offences that could be tried at a crown court) and a few additional closely related summary offences (which would be dealt with by magistrates’ courts). Appendix 1 of the User Guide has more information on the classifications used for notifiable crimes recorded by the police.
- From 1 October 2015, the offence coverage of the CSEW was extended to include fraud experienced by the adult population. Estimates from these new questions will not be available until mid-2016 and are not currently included in the headline CSEW estimates.
- Section 3.3 of the User Guide has more information.
11. Accuracy of the statistics
Crime Survey for England and Wales
Being based on a sample survey, Crime Survey for England and Wales (CSEW) estimates are subject to a margin of error. Unless stated otherwise, all changes in CSEW estimates described in the main text are statistically significant at the 5% level. Since the CSEW estimates are based on a sample survey, it is good practice to publish confidence intervals alongside them; these provide a measure of the reliability of the estimates. Details of where these are published, including further information on statistical significance, can be found in Chapter 8 of the User Guide.
Police recorded crime
Police recorded crime figures are a by-product of a live administrative system that is continually being updated as incidents are logged as crimes and subsequently investigated. Some incidents initially recorded as a crime may, on further investigation, be found not to be a crime and are then described as “cancelled records” and removed from the force’s system. Other criteria for a recorded crime being “cancelled’’ include a crime being recorded in error or if it is a duplicated or partially duplicated record. Recorded crimes can also be transferred to another police force and also result in the “transferred” record being removed from the original force’s system. Some offences may be re-classified, for example from theft to robbery (Section 3.2 of the User Guide has further details of the process involved from recording a crime to the production of statistics). The police return provisional figures to the Home Office on a monthly basis and each month they may supply revised totals for previously supplied months. The Home Office Crime and Policing Statistics team undertake a series of validation checks on receipt of the data and query outliers with forces who may then re-submit data. Details of these validation checks are given in Section 3.3 of the User Guide, and the differences in data published between the current and preceding publications can be found in Table QT1a.
Police recording practice is governed by the Home Office Counting Rules (HOCR) and the National Crime Recording Standard (NCRS). The HOCR have existed in some form since the 1920s, with substantial changes in 1998. The NCRS was introduced in April 2002 following a critical report from Her Majesty’s Inspectorate of Constabulary (HMIC) in 2000 (Povey, 2000), which showed that there was a problem with differing interpretation of the HOCR that resulted in inconsistent recording practices across forces.
Following an assessment of crime statistics by the UK Statistics Authority, published in January 2014, the statistics based on police recorded crime data have been found not to meet the required standard for designation as National Statistics.
In their report, the UK Statistics Authority set out 16 requirements that needed addressing in order for the statistics to meet National Statistics standards. We are working in collaboration with the Home Office Crime and Policing Statistics team and HMIC to address these requirements. A summary of actions taken in response to these requirements is available.
Full details on the history of the assessment and auditing of the quality and accuracy of police recorded crime statistics carried out in recent years is given in Section 3.3 of the User Guide. Since the UK Statistics Authority assessment decision, HMIC have undertaken an inspection of the integrity of police recorded crime (carried out between December 2013 and August 2014), which reviewed a total of 10,267 reports of crime recorded between November 2012 and October 2013 across all 43 police forces in England and Wales.
- The final report on findings from the HMIC inspections, Crime-recording: making the victim count, was published on 18 November 2014, and separate crime data integrity force reports for each of the 43 police forces in England and Wales were published on 27 November 2014
- HMIC concluded that, across England and Wales as a whole, an estimated 1 in 5 offences (19%) that should have been recorded as crimes were not
- The greatest levels of under-recording were seen for violence against the person offences (33%) and sexual offences (26%). However, there was considerable variation in the level of under-recording across the different offence types investigated. For other crime types: an estimated 14% of criminal damage and arson offences that should have been recorded as crimes were not; 14% of robbery offences; 11% of burglary offences; and 17% of other offences (excluding fraud).
- Although the audit sample was not large enough to produce compliance rates for individual police forces, HMIC inspected the crime recording process in each force and have reported on their findings in the separate crime data integrity force reports
The final HMIC report outlines several recommendations to strengthen recording practices in forces, including improved training for those involved in crime recording, better auditing and tightening of recording processes. HMIC have also announced a programme of random rolling inspections to check police forces’ progress in implementing the recommended improvements. More detail can be found in the User Guide.
Further evidence suggesting that there has been a recent improvement in compliance with the NCRS can be seen from updated analysis comparing trends in the CSEW and police recorded crime (presented in Section 4.2 of the User Guide). This shows that the gap between the 2 series is narrowing; suggesting that improvements to recording practices may be partly responsible for increases in recorded crime.
Interpreting data on police recorded crime
The renewed focus on the quality of crime recording means that caution is needed when interpreting statistics on police recorded crime. While we know that it is likely that improvements in compliance with the NCRS have led to increases in the number of crimes recorded by the police, it is not possible to quantify the scale of this, or assess how this effect varied between different police forces. Police recorded crime for England and Wales as a whole has increased by 7% when compared with the previous year, and 39 police forces have recorded overall increases in levels of crime.
Apparent increases in police force area data may reflect a number of factors, including tightening of recording practice, increases in reporting by victims and also genuine increases in the levels of crime.
It is thought that incidents of violence are more open to subjective judgements about recording and thus more prone to changes in police practice. A number of forces have also shown large increases in sexual offences, which are thought to reflect both a greater willingness among victims to report such crimes and improved compliance with recording standards for sexual offences.
Back to table of contents12. Users of crime statistics
There is significant interest in crime statistics and a diverse range of users. These include elected national and local representatives (such as MPs, Police and Crime Commissioners and local councillors), police forces, those delivering support or services to victims of crime, lobby groups, journalists, academic researchers, teachers and students.
These statistics are used by central and local government and the police service for planning and monitoring service delivery and for resource allocation. The statistics are also used to inform public debate about crime and the public policy response to it. Further information about the uses of crime statistics is available in the Crime Statistics Quality and Methodology Information report.
From November 2014 to January 2015 we conducted a user engagement exercise to help assess the extent to which police recorded crime statistics meet users’ needs in light of concerns over the quality of the data raised by Her Majesty's Inspectorate of Constabulary (HMIC) in its recent report Crime Recording: making the victim count. We asked users if the findings would affect how people used the data, and how we might improve the statistics to better meet user needs. Feedback from users who took part indicated that:
- most will continue to use police recorded crime statistics, despite some concerns over their accuracy
- many said that it was now more important to continue to have clear commentary in statistical bulletins to highlight the limitations of the data
- many said they would use the data more cautiously in future and apply more caveats
- most used police recorded crime data, because it is the best source available or the only data that fulfils their purpose
- most thought it was very important or fairly important to have an improved level of accuracy for them to continue using the statistics
A fuller report detailing responses to the user engagement exercise was published in May 2015.
Back to table of contents13. International and UK comparisons
There are currently no recognised international standards for crime recording. International comparisons are limited due to the differing legal systems that underpin crime statistics and processes for collecting and recording crimes.
Crimes recorded by the police
The system for recording crime in England and Wales by the police is widely recognised by international standards to be one of the best in the world. Few other jurisdictions have attempted to develop such a standardised approach to crime recording, and some of those that have base their approach on the England and Wales model (for example, Australia, Northern Ireland). Therefore, it is difficult to make international comparisons of levels of recorded crime given the lack of consistency in definitions, legal systems and police or criminal justice recording practices.
The legal system in Northern Ireland is based on that of England and Wales and the Police Service for Northern Ireland (PSNI) has the same notifiable offence list for recorded crime as used in England and Wales. In addition, the PSNI has adopted the National Crime Recording Standard (NCRS) and Home Office Counting Rules for recorded crime that applies in England and Wales. Therefore, there is broad comparability between the recorded crime statistics in Northern Ireland and England and Wales.
However, recorded crime statistics for England and Wales are not directly comparable with those in Scotland. The recorded crime statistics for Scotland are collected on the basis of the Scottish Crime Recording Standard, which was introduced in 2004. Like its counterpart in England and Wales, it aims to give consistency in crime recording. The main principles of the Scottish Crime Recording Standard are similar to the NCRS for England and Wales with regard to when a crime should be recorded.
There are differences between the respective counting rules. For example, the “Principal Crime Rule” in England and Wales states that if a sequence of crimes in an incident, or alternatively a complex crime, contains more than 1 crime type, then the most serious crime should be counted. For example, an incident where an intruder breaks into a home and assaults the sole occupant would be recorded as 2 crimes in Scotland, while in England and Wales it would be recorded as 1 crime.
Differences in legislation and common law have also to be taken into account when comparing the crime statistics for England and Wales and Scotland.
Victimisation surveys
A number of countries run their own national victimisation surveys and they all broadly follow a similar model to the Crime Survey for England and Wales (CSEW) in attempting to obtain information from a representative sample of the population resident in households about their experience of criminal victimisation. The US National Crime and Victimisation Survey (NCVS) is the longest running, established in 1973, and there are similar surveys in other countries, including Australia, Canada, Finland, France, Germany, the Netherlands, Sweden and New Zealand. However, while these surveys have a similar objective they are not conducted using a standard methodology. Sampling (frames and of households or individuals) and modes of interview (for example face-to-face interviewing, telephone interviewing, self-completion via the web) differ, as do the crime reference periods (last 5 years, last 12 months, last calendar year) over which respondents are asked about their victimisation experience. Similarly, there is a lack of standardisation in question wording and order. Response rates vary considerably across the world, as do methods to adjust for any resulting possible non-response bias; therefore, it becomes extremely difficult to make valid comparisons between the surveys.
There have been attempts in the past to run international surveys on a standard basis and the International Crime and Victimisation Survey (ICVS) was initiated by a group of European criminologists with expertise in national crime surveys. The survey aimed to produce estimates of victimisation that could be used for international comparisons. The first survey was run in 1989 and was repeated in 1992, 1996 and year ending March 2005. All surveys were based upon a 2,000 sample of the population, and in most countries surveys were carried out with computer-assisted telephone interviewing. A pilot ICVS-2, intended to test alternative and cheaper modes of data collection, including self-completion via the web, was carried out in a limited number of countries in 2010.
However, despite the attempt to obtain a standardised and comparable approach to all of the surveys, this was never successfully achieved. While a standard questionnaire was used in all countries, alongside a standard mode of interviewing, important differences remained in the approach to sampling, translation of questions into different national languages, interview lengths and response rates, which make comparisons problematic.
Both Scotland and Northern Ireland have their own separate victimisation surveys that, like the CSEW, complement their recorded crime figures.
The Northern Ireland Crime Survey (NICS) closely mirrors the format and content of the CSEW, using a very similar methodology with continuous interviewing and a face-to-face interview with a nationally representative sample of adults (16 years and over), using a similar set of questions. Therefore, results from the 2 surveys are broadly comparable.
The Scottish Crime and Justice Survey (SCJS) also follows a similar format to the CSEW, having a shared antecedence in the British Crime Survey (whose sample during some rounds of the survey in the 1980s covered Scotland, south of the Caledonian Canal). There are differences in the crimes or offence classifications to reflect the differing legal systems, but the results from the surveys are broadly comparable.
Back to table of contents