1. Key points
In 2012 period life expectancy at birth in the UK was 79.0 for males and 82.7 for females
By 2037 period life expectancy at birth is projected to reach 84.1 years for males and 87.3 years for females, an increase of around five years since 2012
By 2037 cohort life expectancy at birth is projected to reach 94.3 for males and 97.3 for females, 10 years longer than period life expectancy
Period life expectancy at birth is projected to rise by eight years over the 50 years to 2062, reaching 87.3 years for males and 90.3 years for females
By 2062, cohort life expectancy at birth is projected to reach 100 years for females in each UK constituent country except Scotland where it is projected to reach 99.4 years
Cohort life expectancy for a man aged 65 in 2012 is projected to be 21.2 years and for a woman 23.9 years
2. Introduction
ONS have released today tables of life expectancy (ex), probability of death (qx) and numbers of persons surviving (lx) from the 2012-based National Population Projections. These tables contain historic and projected figures for 1981 to 2062 on a period and cohort basis from life tables calculated using observed and projected deaths and population estimates and projections.
Period and cohort life tables are produced biennially based on the assumptions for future mortality from the National Population Projections (NPP). These tables give historic and projected statistics by single year of age and sex, from 1981 to the NPP base year (2012) and then 50 years into the future from the base year (2013 to 2062). The historic life tables are based on unsmoothed calendar year mortality rates and the projected mortality rates from the NPP. This release relates to the 2012-based NPP published on the 6th November 2013.
Period life tables are calculated using age-specific mortality rates for a given period, with no allowance for any actual or projected future changes in mortality. This means that period life expectancy at birth for a given time period and area is an estimate of the average number of years a new born baby would survive if he/she experienced the particular area’s age-specific mortality rates for that time period throughout his/her life. Period life expectancy is therefore a useful measure of mortality rates in a given period and provides an objective means of comparison of the trends in mortality over time and with other countries.
Cohort life tables are calculated using age-specific mortality rates related to specific generations (cohorts) and which allow for known and projected changes in mortality. For example, cohort life expectancy at age 65 in 2012 would be worked out using the mortality rate for age 65 in 2012, for age 66 in 2013 for age 67 in 2014 and so on. This uses observed mortality rates in 2012 and projected mortality rates from 2013. Therefore, cohort figures are regarded as a more appropriate measure of how long a person of a given age would be expected to live on average than period life expectancy.
Life tables and life expectancy figures provide users with an indicator of the health of the nation which can be used to inform policy, planning and research in both public and private sectors in areas such as health, population, pensions and insurance. Key uses include:
to study the course of mortality throughout the life cycle
as an indicator of the health of the nation
to inform policy regarding state pension age
to assess risk for life assurance and pension liability
Public Sector users of life tables include the Government Actuary’s Department, Department of Work and Pensions, HM Treasury, Department of Health, Public Health England and Health Trusts. Outside of government, users include academics and students, the news media, financial advisors/consultants, insurance companies and actuarial professions, and members of the general public
Back to table of contents3. Method
A life table is purely a hypothetical calculation. It is a statistical tool typically used to portray expectation of life at various ages. The basic assumption is that a given number of births (100,000 born in a given year, known as the radix of the life table) are subject, as the survivors pass through each year of age, to the mortality rates prevailing for each age.
Period life tables deal with mortality rates in a particular year only. The mortality rates for each age are used to calculate how many of the 100,000 births will reach each year of age until eventually all have died. This enables the total number of years lived to be calculated. When this total is divided by the number of persons in the life table (100,000), the result is the average number of years lived or the mean expectation of life at birth. The total number of years lived from any given age can also be calculated and when divided by the number of survivors entering that year of age, the figure obtained is the expectation of life in years for those persons.
Cohort life tables are calculated using age-specific mortality rates which allow for known and projected changes in mortality. A cohort life table provides mortality rates that vary over time for each age. For example, cohort life expectancy at age 65 in 2012 would be worked out using the mortality rate for age 65 in 2012, for age 66 in 2013 for age 67 in 2014 and so on. This uses observed mortality rates in 2012 and projected mortality rates from 2013. Therefore, cohort figures are regarded as a more appropriate measure of how long a person of a given age would be expected to live on average than period life expectancy.
Life tables are usually constructed separately for males and females because of their very different mortality patterns. A life table describes the course of mortality throughout the life cycle. A life table contains:
mx The central rate of mortality, defined as the average annual number of deaths at age x last birthday in the year or years to which the life table relates divided by the average population at that age over the same period.
qx The mortality rate between age x and (x + 1), that is the probability that a person aged x exactly will die before reaching age (x + 1).
lx The number of survivors to exact age x of 100,000 live births of the same sex who are assumed to be subject throughout their lives to the mortality rates experienced in the year or years to which the life table relates.
dx The number dying between exact age x and (x + 1) described similarly to lx, that is dx= lx- lx+1.
ex The average period expectation of life at exactly age x, that is the average number of years that those aged x exactly will live thereafter based on the mortality rates experienced in the year or years to which the life table relates.
The method of constructing a life table is widely available in demographic text books, for example, Hinde A, Demographic Methods1.
Notes for method
- Hinde, A. 1998 Demographic Methods, Hodder Arnold London
4. Mortality projections
The National Population Projections are produced primarily to provide an estimate of the future population of the UK and its constituent countries as a common framework for use in national planning. Usually, a new set of projections is made every two years based on assumptions which are judged to be the most appropriate from the statistical evidence available at the time. The projections are made for successive years running from one mid-year to the next using the cohort component method. For each age, the starting population plus net inward migrants, less the number of deaths, produces the number in the population, aged one year older, at the end of the year. To this has to be added survivors of those born during the year.
Mortality projections are based largely on extrapolation of past trends in rates of mortality improvement. Expert opinion is used to inform the assumptions made about future mortality rates.
The assumptions used in the 2012-based projections are that annual rates of improvement in mortality rates would converge to 1.2% for most ages in 2037 (the 25th year of the 2012-based projections), and remain constant at 1.2% a year thereafter. However, those born after 1922 and before 1939 have exhibited greater rates of improvement over the last 25 years than those born earlier or later. There is currently no evidence that these differentials are declining. Similar cohort effects seen in other countries suggest that these differentials may persist well into the oldest ages. As a result, it is assumed that these cohorts will continue to experience higher rates of improvement, rising from 1.0% a year for those born in 1922 to a peak of 2.5% a year for those born in 1931 and 1932 and then declining back to 1.2% a year for those born in 1939 and later. For those born before 1922, rates of improvement are assumed to be lower than 1.2% in 2037. These are the same assumptions for the rates of mortality improvement in the target year as those used in the 2010-based projections (where the target year was 2035).
ONS produces two additional variants to the principal projection; high life expectancy and low life expectancy. The variants differ from the principal projection in the assumed annual rates of improvement, by plus or minus 2% at the base year (2012) and plus or minus 1.2% at the target year (2037). These give alternative scenarios and show how projected life expectancy could vary over the projection period.
More information on the assumption setting process for future mortality patterns are outlined in: 4. Mortality assumptions: 2012-based national population projections.
Back to table of contents5. Life expectancy (ex) at birth
Period life expectancy at birth is projected to rise by eight years for males and females over the 50 year projection period. A baby boy born in 2062 is projected to live to 87.3 years and a baby girl to 90.3 years. Over the last 30 years (1982 to 2012) period life expectancy at birth has increased by around eight years for males and six years for females from 71.1 and 77.0 years respectively. The corresponding life expectancies in 2012 were 79.0 years for males and 82.7 years for females. Figure 1 shows period life expectancy at birth for males and females 1982 to 2012 and then for each of the variant life expectancy projections to 2062. In the period high life expectancy variant, life expectancy at birth is projected to reach age 92.6 and age 95.1 for males and females respectively in 2062, but the low life expectancy variant projects period life expectancy as low as 81.9 and 85.5 respectively.
In all three projections male life expectancy is lower than female life expectancy in the equivalent projection. However, there is some crossover of males and females across the variant projections. The life expectancies from the high life expectancy variant for males cross over the female principal projection in 2046 and the principal projection for males crosses the low life expectancy projection for females in 2049.
Figure 1: Period Life Expectancy at Birth, United Kingdom, 1982 to 2062
2012-based Principal Projection and High and Low Life Expectancy Variants
Source: Office for National Statistics
Notes:
- HLE - High Life Expectancy variant; LLE - Low Life Expectancy variant.
Download this chart Figure 1: Period Life Expectancy at Birth, United Kingdom, 1982 to 2062
Image .csv .xlsCohort life expectancy at birth is about 10 years higher than period life expectancy at birth for both males and females in each year over the projection period (principal projection). A baby boy born in 2012 could expect to live for 90.6 years and a baby girl 93.9 years. This is projected to rise to 98.0 and 100.7 years respectively in 2062. Cohort life expectancy is always higher than period life expectancy because cohort life expectancy makes allowance for future mortality improvements. It is calculated using age-specific mortality rates which allow for known and projected changes in mortality in later years. For example, cohort life expectancy at age 65 in 2012 would be worked out using the mortality rate for age 65 in 2012, for age 66 in 2013, for age 67 in 2014, and so on. Therefore, cohort figures are sometimes regarded as a more appropriate measure of how long a person of a given age would be expected to live on average than period life expectancy.
Figure 2 shows cohort life expectancy at birth in the United Kingdom for the principal projection and the high and low life expectancy variants. Cohort life expectancy is projected to rise from 85.1 years for males and 89.2 for females in 1982, to 98.0 years and 100.7 years respectively in 2062. The high life expectancy variant shows cohort life expectancy rising above 115 years in 2062 for both males and females. However, one must be aware that these projections are for 50 years in the future and are projecting life expectancy from birth i.e. a further 100 years into future. These babies (born in 2062) will not reach their 100th birthday until 2162. The further away from the projection base year the more uncertain the statistics become, therefore these figures should be treated with caution.
Figure 2: Cohort Life Expectancy at Birth, United Kingdom, 1982 to 2062
2012-based Principal Projection and High and Low Life Expectancy Variants
Source: Office for National Statistics
Notes:
- HLE - High Life Expectancy variant; LLE - Low Life Expectancy variant.
Download this chart Figure 2: Cohort Life Expectancy at Birth, United Kingdom, 1982 to 2062
Image .csv .xlsMortality assumptions for recent projections have been determined by analysis of historic changes in mortality rates over differing periods of time and setting assumptions which produce similar improvements over the same periods in the future. The recent past trends (40 years) show average annual improvements of 2% for males and 1.5% for females. There has been an element of ‘catching up’ for males in this period with higher rates of improvement in mortality than for females. This is a result of a change in working and social behaviours. For example, relatively high numbers of men who started smoking earlier in the 20th century have now given up, with smoking prevalence lowest for the oldest age groups. Changes in patterns of male employment in heavy industry may also have had some effect. There continues to be much debate amongst demographers as to whether life expectancy will continue to increase at current rates indefinitely or whether lifestyle factors such as a rise in levels of obesity and in antibiotic resistance may cause the rate of mortality improvement to stop or even decline.
ONS discusses experts’ opinions on such factors at a meeting with an expert panel and the resulting views are taken into consideration when setting assumptions on future mortality. However, evidence of these factors is difficult to determine and ONS produces projections which are essentially an extrapolation of past trends, using expert opinion to check for plausibility. Therefore the past trend in increasing life expectancy is projected to continue into the future. The variant life expectancy projections provide alternative scenarios and there is a levelling off of life expectancy with the low life expectancy variant and a relatively large increase in life expectancy with the high life expectancy variant.
Table 1 gives the period and cohort life expectancy figures at birth from the principal projection for the UK and each of the constituent countries, in the base year 2012, in 2037 and 2062.
Of the four countries in the UK, England has the highest life expectancy at birth for both males and females in all years and Scotland has the lowest (Table 1). By 2062, cohort life expectancy at birth is projected to reach 100 years for females in each country except Scotland who reach just under at 99.4 years. The differences between life expectancies in England and Scotland are projected to decrease slightly over the projection period, but remain at around two years.
Table 1: Life Expectancy at Birth, UK and Constituent Countries, Principal Projection
| 2012 | 2037 | 2062 | ||||
| Period | Cohort | Period | Cohort | Period | Cohort | |
| Males | ||||||
| United Kingdom | 79.0 | 90.6 | 84.1 | 94.3 | 87.3 | 98.0 |
| England | 79.3 | 90.8 | 84.4 | 94.5 | 87.5 | 98.1 |
| Wales | 78.3 | 90.0 | 83.6 | 93.0 | 86.8 | 95.1 |
| Northern Ireland | 78.1 | 89.9 | 83.3 | 93.7 | 86.6 | 97.4 |
| Scotland | 76.8 | 88.6 | 82.0 | 92.6 | 85.4 | 96.5 |
| Females | ||||||
| United Kingdom | 82.7 | 93.9 | 87.3 | 97.3 | 90.3 | 100.7 |
| England | 82.9 | 94.1 | 87.6 | 97.5 | 90.5 | 100.9 |
| Wales | 82.1 | 93.5 | 87.0 | 97.0 | 90.0 | 100.4 |
| Northern Ireland | 82.3 | 93.4 | 86.9 | 96.9 | 89.8 | 100.3 |
| Scotland | 80.8 | 92.2 | 85.5 | 95.8 | 88.6 | 99.4 |
| Source: Office for National Statistics | ||||||
Download this table Table 1: Life Expectancy at Birth, UK and Constituent Countries, Principal Projection
.xls (26.6 kB)6. Life expectancy at age 65
Table 2 presents life expectancy at age 65, that is the average number of years remaining once a person has reached age 65. Over the last 30 years (1982 to 2012) period life expectancy at age 65 has increased by 5.3 years for men, from 13.0 years in 1982 to 18.3 years in 2012. Women’s has increased by 3.7 years over the same period from 17.0 years to 20.7 years. Increases in cohort life expectancy at age 65 have been higher, at seven years for men and six years for women.
Over the next 25 years (2012 to 2037) period life expectancy for men aged 65 is projected to reach 22.3 years (principal projection) and 24.7 years for women. The corresponding projected cohort life expectancies at age 65 are 24.1 years and 26.7 years respectively. These are projected increases of around three to four years by 2037. The projected increases in life expectancy at age 65 rise to around six years in the cohort high life expectancy variant and fall to less than a year in the cohort low life expectancy variant.
By 2062 period life expectancy is projected to reach 24.9 years for men and 27.2 years for women. Cohort life expectancy is slightly higher at 27.0 years and 29.5 years for men and women respectively. These give overall increases of six to seven years over the 50 year projection period (principal projection). In contrast, the high life expectancy variant gives increases of 11 years (period) and 13 years (cohort) in male and female life expectancy at age 65. The cohort high life expectancy variant in 2062 is 35.7 years for men and 37.9 years for women; this means that the average 65 year old in 2062 would get to celebrate their 100th birthday.
Table 2: Period and Cohort Life Expectancy at Age 65, United Kingdom, 1982, 2012, 2037 and 2062
| 2012-based Principal Projection and High and Low Life Expectancy Variants | ||||||||
| 1982 | 2012 | 2037 | 2062 | |||||
| Period | Cohort | Period | Cohort | Period | Cohort | Period | Cohort | |
| Males | ||||||||
| Principal | 13.0 | 14.2 | 18.3 | 21.2 | 22.3 | 24.1 | 24.9 | 27.0 |
| High Life Expectancy | 13.0 | 14.2 | 18.3 | 22.4 | 24.1 | 28.7 | 29.4 | 35.7 |
| Low Life Expectancy | 13.0 | 14.2 | 18.3 | 20.3 | 20.7 | 20.7 | 20.7 | 20.7 |
| Females | ||||||||
| Principal | 17.0 | 18.0 | 20.7 | 23.9 | 24.7 | 26.7 | 27.2 | 29.5 |
| High Life Expectancy | 17.0 | 18.0 | 20.7 | 25.2 | 26.3 | 31.2 | 31.4 | 37.9 |
| Low Life Expectancy | 17.0 | 18.0 | 20.7 | 22.9 | 23.2 | 23.2 | 23.2 | 23.2 |
| Source: Office for National Statistics | ||||||||
Download this table Table 2: Period and Cohort Life Expectancy at Age 65, United Kingdom, 1982, 2012, 2037 and 2062
.xls (33.8 kB)7. International comparison
Table 3 provides a comparison of period life expectancies in 2012 and projected period life expectancy in 2062 (or nearest projection year available) for a selection of countries selected purely by the availability of the relevant data. From the countries shown in Table 3, in 2012 Switzerland has the highest life expectancy for males and Japan has the highest for females. In 2012 the UK has the second lowest life expectancy at birth of the eight countries for both males and females (the lowest being the USA but note that the latest figures are for 2010). However, by 2062 the UK has the highest projected life expectancy for males and second highest for females, with only Japan projecting higher life expectancies at birth for females. This suggests that the UK may be more optimistic than some other countries when setting the assumptions for future mortality.
Table 3: Period Life Expectancy at Birth in Selected Countries, 2012 and 2062
| Principal Projection | ||||
| Country | 2012 | 2062 | ||
| Males | Females | Males | Females | |
| United Kingdom | 79.0 | 82.7 | 87.3 | 90.3 |
| The Netherlands (2060) | 79.1 | 82.8 | 84.5 | 87.4 |
| Sweden | 79.5 | 83.4 | 84.9 | 87.0 |
| Norway | 79.4 | 83.4 | 86.2 | 89.3 |
| Switzerland | 80.5 | 84.7 | 86.1 | 90.2 |
| USA (2010 & 2060) | 75.7 | 80.8 | 82.8 | 86.8 |
| Japan | 79.9 | 86.4 | 84.2 | 90.9 |
| Australia (2061) | 79.7 | 84.2 | 85.2 | 88.3 |
| Source: Office for National Statistics; CBS Statistics Netherlands; SCB Statistics Sweden; SSB Statistics Norway; Swiss Federal Statistical Office; U.S. Census Bureau; Australian Bureau of Statistics; and Ministry of Health, Labour and Welfare Japan | ||||
Download this table Table 3: Period Life Expectancy at Birth in Selected Countries, 2012 and 2062
.xls (33.8 kB)8. Probability of dying (qx)
The mortality rate (qx) measures the proportion of people reaching a given birthday within a calendar year who die before their next birthday, that is, the probability that a person aged x will die before reaching age (x + 1). Once all the qx mortality rates have been calculated, a life table can be constructed, as the qx rates are required in order to calculate a life expectancy figure.
Figure 3 presents qx mortality rates plotted on the logarithmic scale for males and females for the years 1982, 2012 and 2062 for the principal projection. The graph shows period data by age for the UK. The main feature is that the mortality rates are lower in 2062 than in 2012 at every age for both males and females.
In each of the three years shown the pattern of initially high mortality at birth can be seen: from the age of one, mortality falls and remains low until around the age of 16. Mortality rates then begin to increase steadily throughout the rest of the life course. Males have higher mortality rates during the life course than females. Note the bulge for males between the ages of 16 and 25 where the probability of dying between birthdays increases sharply before returning to the steady increase by age. This bulge in male deaths remains in the projections for 2062. In contrast, for females, although mortality at this age is lower in 2012 than for males, the bulge appears to have disappeared by 2062.
Figure 3: 2012-based Period Mortality Rates (qx), United Kingdom, 1982, 2012, 2062
Principal Projection

Source: Office for National Statistics
Download this image Figure 3: 2012-based Period Mortality Rates (qx), United Kingdom, 1982, 2012, 2062
.png (26.6 kB) .xls (36.4 kB)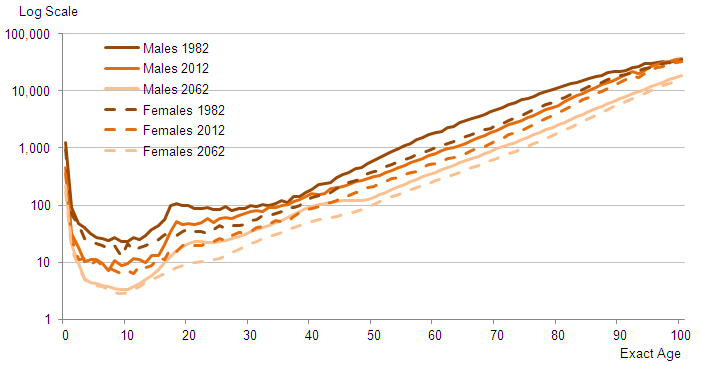
Publishing the qx tables enables users to produce their own life tables or their own projections of mortality, which is particularly useful for pension and insurance analysis.
Back to table of contents9. Numbers of survivors (lx)
The numbers of survivors by age in the life table are the numbers alive at an exact age from a starting population of 100,000 (at age 0). The starting population at age zero is an arbitrary number called the radix, and since everybody ultimately dies, the lx is a curve which takes the value 100,000 (at age 0) and falls to zero at whatever age represents the maximum attainable human life-span. The data in the tables published alongside this statistical bulletin stop at age 100 and, as Figure 4 shows, the curves do not quite fall to zero by age 100, particularly in 2062.
Figure 4 presents the lx values from the male and female period life tables for selected years. The graph shows two main features. Firstly, there is the survival to older ages. This is shown by the increasing age over time at where the slope begins its rapid decline. For example, the age at which the number of survivors falls below 90,000 is increasing; in 1982 for males it was age 55, in 2012 it is projected to be age 62, and in 2062 it is projected to be age 71. Secondly, the gap between numbers of males and females surviving to older ages is narrowing. This is particularly noticeable at age 70; in 1982 the gap between numbers of men and women surviving to age 70 was almost 15,000 per 100,000 born; by 2062 this is projected to reduce to just over 3,000.
Figure 4: Numbers of Survivors by Age, from the Period Life Tables, United Kingdom, 1982, 2012 and 2062
Principal Projection
Source: Office for National Statistics
Notes:
- The lx is often used to calculate the probability of surviving from one age to an older age. The probability of surviving to age 100 is the focus of a short story and infographic which are also published today to accompany this release.
Download this chart Figure 4: Numbers of Survivors by Age, from the Period Life Tables, United Kingdom, 1982, 2012 and 2062
Image .csv .xlsThe lx is often used to calculate the probability of surviving from one age to an older age. The probability of surviving to age 100 is the focus of a short story and infographic which are also published today to accompany this release.
Back to table of contents