Table of contents
- Key points
- Introduction
- 2012-based Principal Population Projections
- Births, deaths and net migration
- Changing age structure
- Children
- Older people
- People of working age and state pension age
- Variant population projections
- Assumptions underlying the 2012-based projections
- Comparison with previous projections
- Further information
- Background notes
- Methodology
1. Key points
The UK population is projected to increase by 9.6 million over the next 25 years from an estimated 63.7 million in mid-2012 to 73.3 million in mid-2037
The UK population is projected to reach 70 million in 2027
Projected natural increase (more births than deaths) accounts for 57 per cent of the projected increase over the next 25 years
Over the ten year period to mid-2022, the UK population is projected to increase by 4.3 million to 68.0 million
The population is projected to continue ageing with the average age rising from 39.7 years in 2012 to 40.6 years in mid-2022 and 42.8 by mid-2037
The number of people aged 80 and over in the UK is projected to more than double to 6 million by mid-2037
2. Introduction
This bulletin presents the key findings from the 2012-based national population projections. These are based on the estimated population at 30 June 2012, and include results from the 2011 Census. They replace the 2010-based projections published by ONS in October 2011. The national projections are produced by the Office for National Statistics on behalf of the National Statistician and the Registrars General of Scotland and Northern Ireland.
National population projections by age and sex are produced for the UK and its constituent countries every two years. The projections are based on the most recently available mid-year population estimates and a set of underlying demographic assumptions regarding future fertility, mortality and migration. They are not forecasts and do not attempt to predict the impact that future government policies, changing economic circumstances or other factors might have on demographic behaviour, for example, government policies on immigration or student fees.
The national projections provide an estimate of the future size and age structure of the population of the UK (and of its constituent countries). They ensure that users can work on consistent assumptions. Examples of uses made of the population projections include:
The Office for Budget Responsibility uses the projections as a key input to their long-term fiscal projections published in the fiscal sustainability report
The Department for Work and Pensions uses the projections extensively to produce forecasts of expenditure for benefits and pensions and as a key input for analysis on policy areas such as extending working lives
The Department for Education uses the projections as the basis for their projections of future school pupil numbers
The national population projections provide the base for other products such as subnational population projections and household projections, which are widely used for resource allocation and planning
Projections become increasingly uncertain the further they are carried forward into the future, due to the inherent unpredictability of demographic behaviour. To give users an indication of this, a number of variant projections are also available which provide other future scenarios based on alternative assumptions of future fertility, mortality and migration. They do not represent upper or lower bounds, but do illustrate what the population could look like if, for example, fertility was to become lower than assumed for the principal projection, which is the main or central projection.
This bulletin focuses on the first 25 years of the projections. Longer term projections to mid-2112 are also available on the ONS website for users who require them, but these should be treated with caution. Longer term projections are not considered appropriate for a wide range of uses, particularly when broken down by age, but have been made available in line with making datasets publicly available under the government’s transparency agenda. For more information on how ONS population projections meet user needs along with information on their fitness for purpose, please see the report on quality and methodology (109.5 Kb Pdf) .
Back to table of contents3. 2012-based Principal Population Projections
The United Kingdom population is projected to increase by 4.3 million to 68.0 million over the 10 year period to mid-2022. This increase is equivalent to an annual growth rate of 0.6 per cent each year between mid-2012 and mid-2022. The UK population is projected to increase from an estimated 63.7 million in mid-2012 to 73.3 million in mid-2037 (Table 1). It is projected that the population of the UK will reach 70 million in mid-2027.
The population of England is projected to increase by 7 per cent by mid-2022. The population of the other UK countries are also projected to increase, but at a slower rate. Northern Ireland is projected to increase by 5 per cent over the same period, while Scotland and Wales are projected to increase by 4 per cent by mid-2022.
Table 1: Estimated and projected population of the United Kingdom and constituent countries, mid-2012 to mid-2037
| millions | ||||||
| 2012 | 2017 | 2022 | 2027 | 2032 | 2037 | |
| United Kingdom | 63.7 | 65.8 | 68 | 70 | 71.7 | 73.3 |
| England | 53.5 | 55.4 | 57.3 | 59.1 | 60.7 | 62.2 |
| Wales | 3.1 | 3.1 | 3.2 | 3.2 | 3.3 | 3.3 |
| Scotland | 5.3 | 5.4 | 5.5 | 5.6 | 5.7 | 5.8 |
| Northern Ireland | 1.8 | 1.9 | 1.9 | 2 | 2 | 2 |
| Notes: | ||||||
| 1. Figures may not sum due to rounding. | ||||||
Download this table Table 1: Estimated and projected population of the United Kingdom and constituent countries, mid-2012 to mid-2037
.xls (21.0 kB)4. Births, deaths and net migration
Of the 4.3 million projected increase in the UK population over the next 10 years, some 2.6 million (61 per cent) is a result of projected natural increase (more births than deaths) while the remaining 1.7 million (39 per cent) is the projected net number of migrants (Table 2). Similarly, of the 9.6 million projected increase in the population by mid-2037, 5.4 million (57 per cent) is due to projected natural increase and 4.2 million (43 per cent) is due to projected net migration.
Table 2: Projected components of change, United Kingdom, mid-2012 to mid-2037
| millions | ||||||
| 2012-2017 | 2017-2022 | 2022-2027 | 2027-2032 | 2032-2037 | ||
| Population at start | 63.7 | 65.8 | 68.0 | 70.0 | 71.7 | |
| Births | 4.0 | 4.1 | 4.0 | 4.0 | 4.0 | |
| Deaths | 2.8 | 2.8 | 2.9 | 3.1 | 3.3 | |
| Natural change | 1.3 | 1.3 | 1.2 | 0.9 | 0.7 | |
| Net migration | 0.8 | 0.8 | 0.8 | 0.8 | 0.8 | |
| Total change | 2.1 | 2.1 | 2.0 | 1.8 | 1.6 | |
| Population at end | 65.8 | 68.0 | 70.0 | 71.7 | 73.3 | |
| Notes: | ||||||
| 1. Figures may not sum due to rounding. | ||||||
Download this table Table 2: Projected components of change, United Kingdom, mid-2012 to mid-2037
.xls (29.7 kB)The projected numbers of future births and deaths are themselves partly dependent on the assumed level of net migration. Because migration is concentrated at young adult ages, the assumed level of net migration affects the projected number of women of childbearing age and hence the projected number of births. Of the 5.4 million natural increase projected between mid-2012 and mid-2037, only 3.8 million would occur if net migration were zero at each and every age throughout the projection period (Table 3). Thus, about 60 per cent of the projected increase in the population over the period mid-2012 to mid-2037 is either directly attributable to future migration (43 per cent), or indirectly attributable to the effect of fertility and mortality on these future migrants (17 per cent).
Table 3: Projected population growth by component, United Kingdom, mid-2012 to mid-2037
| Millions | |
| Total population increase between mid-2012 and mid-2037 | 9.6 |
| Resulting from: | |
| Assumed net migration | 4.2 |
| Natural change assuming zero net migration | 3.8 |
| Additional natural change from assumed level of net migration | 1.6 |
Download this table Table 3: Projected population growth by component, United Kingdom, mid-2012 to mid-2037
.xls (26.6 kB)5. Changing age structure
Over the 10 year period to mid-2022, the number of children aged under 16 is projected to increase from 12 million in mid-2012 to 13 million in mid-2022 (Table 4), and then stay at around this level for the next 15 years.
Table 4: Projected population by age, United Kingdom, mid-2012 to mid-2037
| millions | ||||||
| Ages | 2012 | 2017 | 2022 | 2027 | 2032 | 2037 |
| 0-14 | 11.2 | 11.7 | 12.2 | 12.3 | 12.2 | 12.2 |
| 15-29 | 12.6 | 12.4 | 12.1 | 12.3 | 12.9 | 13.3 |
| 30-44 | 12.8 | 12.7 | 13.3 | 13.6 | 13.5 | 13.2 |
| 45-59 | 12.6 | 13.3 | 13.0 | 12.6 | 12.4 | 13.0 |
| 60-74 | 9.4 | 10.1 | 10.7 | 11.6 | 12.3 | 12.1 |
| 75 and over | 5.0 | 5.5 | 6.6 | 7.7 | 8.5 | 9.5 |
| 75-84 | 3.6 | 3.8 | 4.6 | 5.3 | 5.4 | 5.9 |
| 85 & over | 1.4 | 1.7 | 2.0 | 2.4 | 3.1 | 3.6 |
| All ages | 63.7 | 65.8 | 68.0 | 70.0 | 71.7 | 73.3 |
| Median age (years) | 39.7 | 40.1 | 40.6 | 41.3 | 42.1 | 42.8 |
| Under 16 | 12.0 | 12.4 | 13.0 | 13.1 | 13.0 | 13.0 |
| Working age* | 39.4 | 41.0 | 42.4 | 42.9 | 43.1 | 44.2 |
| Pensionable age* | 12.3 | 12.4 | 12.5 | 13.9 | 15.6 | 16.1 |
| Old age support ratio* (working age/pensionable age) | 3.2 | 3.3 | 3.4 | 3.1 | 2.8 | 2.7 |
| Notes: | ||||||
| 1. * Working age and pensionable age populations based on State Pension age for given year. Between 2012 and 2018, State Pension age will change from 65 years for men and 61 years for women, to 65 years for both sexes. Then between 2019 and 2020, State Pension age will change from 65 years to 66 years for both men and women. Between 2034 and 2046, State Pension age will increase in two stages from 66 years to 68 years for both sexes. This is based on State Pension age under the 2011 Pensions Act. | ||||||
Download this table Table 4: Projected population by age, United Kingdom, mid-2012 to mid-2037
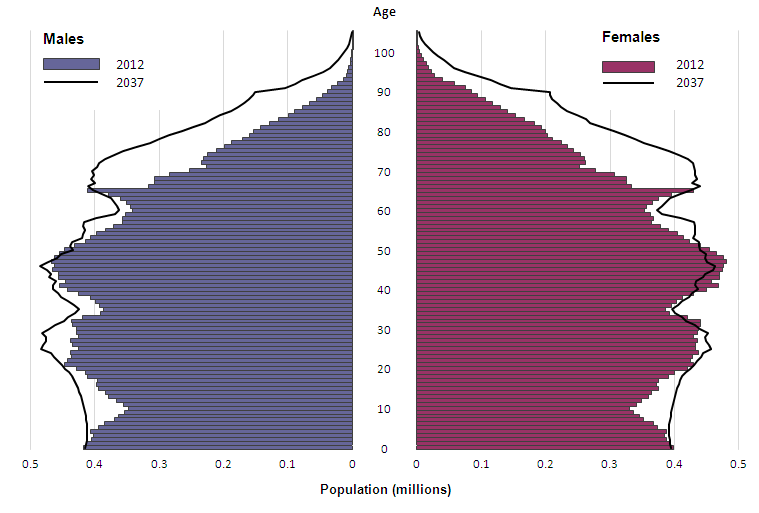
.xls (30.7 kB)A population pyramid is a good way of illustrating the age and sex structure of the population. Figure 1 represents the population of the UK as estimated in mid-2012 and projected for mid-2037. Each bar in the pyramid represents a single year of age and the length of the bar relates to the number of people of that age in the population. The size and composition of the population is determined by the pattern of births, deaths and migration which have taken place in previous years. The solid bars represent the estimated population for mid-2012 and the lines represent the projected population for mid-2037.
The 2012 pyramid clearly shows:
a sharp spike in the population, for those age 64 and 65 years old, which reflect the high numbers of births in the years after the Second World War. This includes those males born between 1 July 1946 and 30 June 1947 who will have reached state pension age in the year to mid-2012
the wider area of the pyramid for those aged in their late forties who were born during the baby boom of the 1960s
the sharp narrowing of the pyramid for people aged around 10 years, a consequence of low numbers of births just after the turn of the century, and the increasing broadening of the base of the pyramid from the higher numbers of births in recent years
females outnumbering males at older ages, reflecting their historically higher life expectancy
Now looking at the projected population at mid-2037, we can see that:
the projected increase in the numbers of children is at school age rather than pre-school age
the working aged population will remain broadly similar
what is most marked is the increase in the population at older ages as the large number of the population who were born in the 1960s become over 70
Figure 1: Estimated and projected age structure of the United Kingdom population, mid-2012 and mid-2037
Download this image Figure 1: Estimated and projected age structure of the United Kingdom population, mid-2012 and mid-2037
.png (28.2 kB) .xls (35.3 kB)6. Children
The number of children aged under five is not projected to change much over the 25 years to mid-2037, but the number of primary school age children is projected to increase by 13 per cent to reach 5.7 million by mid-2037 (Figure 2). Over the same period, the number of children aged 12 to 16 is projected to rise by 10 per cent to 4.1 million.
Figure 2: Estimated and projected numbers of children aged 0 to 16, United Kingdom, mid-2012 and mid-2037
Download this chart Figure 2: Estimated and projected numbers of children aged 0 to 16, United Kingdom, mid-2012 and mid-2037
Image .csv .xls7. Older people
The number of people aged 80 and above is projected to more than double by mid-2037, the number of people aged 90 and over is projected to more than triple, and the number of centenarians is projected to rise from 13,000 in mid-2012 to 111,000 in mid-2037, a more than eightfold increase (Figure 3). This increase in the numbers of older people means that by mid-2037 one in 12 of the population is projected to be aged 80 and over.
Figure 3: Estimated and projected population aged 70 and over, United Kingdom, mid-2012 and mid-2037
Download this chart Figure 3: Estimated and projected population aged 70 and over, United Kingdom, mid-2012 and mid-2037
Image .csv .xls8. People of working age and state pension age
Despite increases to state pension age under current legislation (see Background Note 10), the number of people of state pension age is projected to increase by 31 per cent from 12.3 million in mid-2012 to 16.1 million by mid-2037 (Table 4). This reflects the higher number of people who were born in the 1960s ‘baby boom’ reaching state pension age within the 25 year period to mid-2037.
Over the same period, the number of people of working age is projected to rise by 12 per cent from 39.4 million in mid-2012 to 44.2 million by mid-2037. The definition of working age used in this bulletin is people aged between 16 and state pension age. In mid-2012, there were 0.3 million more people of state pension age than children aged under 16; by mid-2037 this difference is projected to exceed 3.1 million.
There were 3.21 people of working age for every person of state pension age in mid-2012. By mid-2022, allowing for the change in state pension age, this ‘old age support ratio’ is projected to rise slightly to 3.39. However, it fluctuates over this period as the population ages and further changes in state pension age are enacted between 2034 and 2036 (Table 4). It is projected to fall to 2.74 by mid-2037. Details of further changes to state pension age proposed by the government can be found in Background Note 10.
Back to table of contents9. Variant population projections
Projections are uncertain and become increasingly so the further they are carried forward in time. In addition to the principal (main or central) projection, variant projections are produced based on alternative, but plausible, assumptions of future fertility, mortality and net migration. These variant projections are intended to provide an indication of uncertainty and sensitivity to alternative assumptions; they do not represent upper or lower limits of future demographic behaviour.
Six ‘single component’ variant projections are available, where only one component of population change is varied from the principal assumptions. In addition, three further variant projections are also available (see Background Note 8). These are:
the ‘high population’ variant which assumes a combination of high fertility, high life expectancy and high net migration
the ‘low population’ variant which assumes a combination of low fertility, low life expectancy and low net migration
the ‘zero net migration’ (or ‘natural change only’) variant which assumes the same levels of fertility and life expectancy as the principal projection, but that there will be zero net migration (that is, migration inflows and outflows are exactly equal at every age)
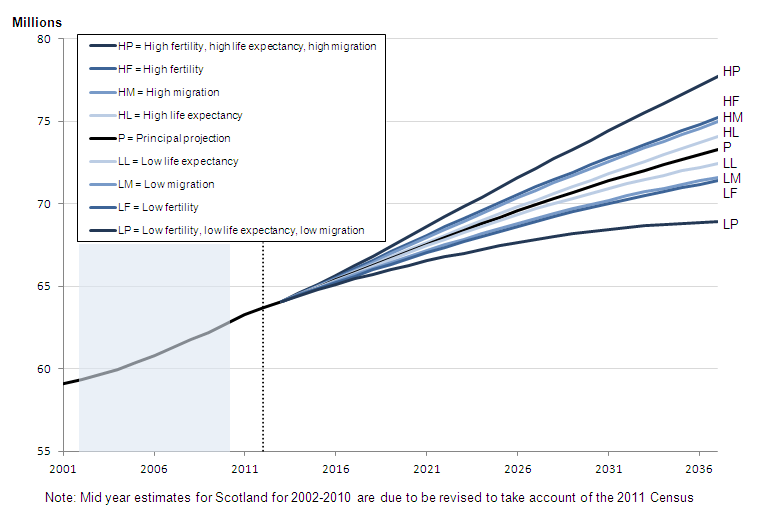
All the variant projections result in an increasing population between mid-2012 and mid-2037 however the rate of increase varies between them. Details of the principal and variant assumptions are outlined later in this bulletin and are summarised in Figure 4.
Under the high fertility variant projection for the UK the population increases to 68.6 million, 0.6 million more than the principal projection by mid-2022. Using the low fertility variant would see an increase to 67.4 million, about 0.6 million lower than the principal over the same period. By mid-2037, the UK population according to the high fertility variant would be 1.9 million higher than the principal, while the low fertility variant would result in a population 1.9 million lower than the principal, a difference of around 2.5 per cent. In the short term, the fertility variants have the largest impact on the projected numbers of children and young adults. The high and low fertility variants project there to be around 1.4 million more or less children aged 0 to 15 in mid-2037 compared with the principal projection, which is a difference of around 10 per cent.
Figure 4: Estimated and projected population of the United Kingdom, mid-2001 to mid-2037

Notes:
- Mid year estimates for 2002-2010 are due to be revised to take account of the 2011 Census for Scotland. Revised population estimates for Scotland and the UK for 2002–2010 were not available at the time of projection.
Download this image Figure 4: Estimated and projected population of the United Kingdom, mid-2001 to mid-2037
.png (34.5 kB) .xls (37.9 kB)The high and low migration variants result in populations of 0.5 million higher and lower respectively than the principal in mid-2022. By mid-2037, the high and low migration variants differ from the principal by 1.7 million.
The high and low life expectancy variants do not have as great an impact on the projections as the high and low fertility and migration variant assumptions. They result in populations of 0.1 million higher and lower respectively than the principal in mid-2022 and 0.8 million higher and lower over the 25 year period to mid-2037.
When the higher or lower assumptions for all components of population change are combined in the high population and low population variants, the possible range for total population size is considerably wider, with values of 1.2 million above or below the principal by mid-2022 and about 4 million above or below the principal by mid-2037.
Back to table of contents10. Assumptions underlying the 2012-based projections
The 2012-based national population projections are based on the estimated population at the middle of 2012 and a set of demographic assumptions about future fertility, mortality and migration based on analysis of trends and expert advice. The assumptions underlying the 2012-based national population projections are compared with those used for the 2010-based projections in Table 5.
Fertility
The long-term assumption of completed family size for the UK for the principal projection is higher than the 2010-based projections at 1.89 children per woman. The corresponding assumptions for all four constituent countries have also increased by the same amount. This increase is based on the observation that the falling completed family size for women has slowed in recent years, and younger cohorts partway through their childbearing years look set to have similar levels of completed fertility to those who have recently completed childbearing. These projections assume that the total fertility rate for the UK decreases slightly from mid-2012 to mid-2013 then stabilises at 1.89 from then on. These assumptions are different from those used in the 2010-based projections that started from a higher base, assumed higher levels of fertility in the short term and then assumed lower levels in the longer term.
The high and low fertility variants assume long-term family sizes of 0.2 children per woman higher or lower than the principal assumptions, that is, 2.09 and 1.69 children per woman for the UK.
Table 5: Long-term principal assumptions for the 2012-based national population projections compared with assumptions for the 2012-based projections
| United Kingdom | England | Wales | Scotland | Northern Ireland | |
| Fertility – Long-term average number of children per woman | |||||
| 2012-based | 1.89 | 1.9 | 1.9 | 1.75 | 2 |
| 2010-based | 1.84 | 1.85 | 1.85 | 1.7 | 1.95 |
| Mortality - Expectation of life at birth in 2037* | |||||
| Males 2012-based | 84 | 84.3 | 83.6 | 81.9 | 83.3 |
| Males 2010-based | 83.6 | 83.9 | 83.1 | 81.1 | 82.6 |
| Females 2012-based | 87.3 | 87.5 | 86.9 | 85.4 | 86.8 |
| Females 2010-based | 87.2 | 87.4 | 86.8 | 85.4 | 86.8 |
| Net migration † – Annual long-term assumption | |||||
| 2012-based | 165,000 | 143,500 | 6,000 | 15,500 | 0 |
| 2010-based | 200,000 | 172,500 | 10,000 | 17,500 | 0 |
| Notes: | |||||
| 1. * Expectations of life for 25 years ahead given as example year. Note these are period expectations of life based on the mid-year mortality rates assumed for the year 2037 and do not take account of the continuing improvement in mortality projected beyond 2037. | |||||
| 2. † Net migration includes international migration and cross-border migration between the countries of the UK. | |||||
Download this table Table 5: Long-term principal assumptions for the 2012-based national population projections compared with assumptions for the 2012-based projections
.xls (28.7 kB)Mortality
The mortality assumptions are set in terms of rates of improvement; these improvements are then applied to mortality rates, year on year. The 2012-based projections assume that rates of improvement will converge to 1.2 per cent for most ages in mid-2037 (the 25th year of the projections), and remain at 1.2 per cent each year thereafter. Those born between 1923 and 1938 are assumed to experience higher rates of improvement than 1.2 per cent in mid-2037, while those born before 1922 are assumed to experience annual mortality improvements below 1.2 per cent in mid-2037. These are the same assumptions for the rates of mortality improvement in the target year as those used in the 2010-based projections (where the target year was 2035).
These rates of improvement are best illustrated using the projected period life expectancies at birth. For mid-2037 these are around 0.1 years higher than in the previous projections for females and 0.4 to 0.8 years higher for males.
The high and low life expectancy variants assume annual rates of mortality improvement from mid-2037 to be 1.2 per cent higher or lower than the principal assumptions (that is, 2.4 per cent and 0.0 per cent for most ages). Thus the variant projections assume life expectancy at birth in mid-2037 to be 2.1 years higher or lower for males and 1.8 years higher or lower for females.
Migration
The long-term assumption for net migration to the United Kingdom is +165,000 each year, compared with +200,000 a year in the 2010-based projections. The assumed level of annual net migration to England is +143,500, which is 29,000 lower than for the 2010-based projections. For Wales it is 4,000 lower at +6,000 a year, and for Scotland it is 2,000 lower at +15,500 a year. The assumption for Northern Ireland is the same as that used for the 2010-based projections.
These changes reflect the most recent trends in both international migration and cross-border migration between the four countries of the UK. New methods have been used to model migration trends in setting the migration assumptions for the 2012-based projections.
The high and low migration variants assume long-term annual net migration to the UK to be 60,000 people higher or lower than the principal assumption (that is, +225,000 and +105,000).
Back to table of contents11. Comparison with previous projections
Since the 2010-based projections were published the results of the 2011 Census have been released and used to rebase the population estimates series. There were around 500,000 more people estimated by the 2011 United Kingdom Census than had been previously estimated. At mid-2012 the estimated population of the UK was about 460,000 higher than that projected for mid-2012 in the 2010-based projections.
The population of the UK is projected to grow at a slower rate in the 2012-based projections than the 2010-based projections, and at mid-2022 it is projected to be 100,000 (0.2 per cent) lower than in the previous (2010-based) projections (Table 6).
The slower projected growth is due to the change in the assumptions made for the 2012-based projections, with the assumptions for migration being lower and those for fertility being higher in the long term, but lower in the short term than the 2010-based projections.
These changed assumptions result in there being projected over the decade to mid-2022:
around 230,000 fewer births (as the short term fertility assumption is lower than that used in the 2010-based projections)
50,000 fewer deaths
400,000 fewer net migrants
In summary, although the 2012-based projections started from a higher base, the slower projected growth compared to the 2010-based projections means that the projected population in mid-2022 is fairly similar in the two sets of projections.
Table 6: Comparison of 2012-based and 2010-based principal projections, United Kingdom
| Millions | Population at mid-2022 | |||
| 2012-based projections | 2010-based projections | Difference | % difference | |
| United Kingdom | 68 | 68.1 | -0.1 | -0.2% |
| England | 57.3 | 57.4 | -0.1 | -0.2% |
| Wales | 3.2 | 3.2 | 0 | -0.3% |
| Scotland | 5.5 | 5.5 | 0 | -0.2% |
| Northern Ireland | 1.9 | 1.9 | 0 | -0.5% |
| Notes: | ||||
| 1. Figures rounded to one decimal place. | ||||


