1. How ethnic groups vary across some of the social determinants of health
The revised Race Disparity Audit (RDA) published in March 2018 found disparities between ethnic groups in various aspects of public life, some of which were pronounced, influencing relative life chances and quality of life. A report by Public Health England showed that the Bangladeshi and Pakistani ethnicities stood out as having particularly poor health outcomes.
While the shared cultural practices associated with ethnic heritage is an important determinant of health, there are also important interconnections between ethnic group membership and other determinants of health such as:
- socio-economic position
- area context
- access to housing
- living arrangements
An important question in examining risk of coronavirus (COVID-19)-related death is how much variation can be explained independently by ethnicity and how much by variation in experience and intensity of disadvantage? As there is a social gradient in general mortality risk, it is important to illustrate how indicators of disadvantage are distributed across ethnic groups.
At the time of the 2011 Census, there was considerable variability between ethnic groups in the proportion of their respective populations assigned to the most advantaged Higher Managerial and Professional socio-economic class. For example, people with Indian ethnicity were twice as likely to be classified to this class than those with either Bangladeshi or Pakistani ethnicity. Those of Black or Mixed ethnicity had a smaller percentage of their respective populations assigned to this class than those with White ethnicity.
As occupation may change over time, since the 2011 UK Census an analysis of 2019 Annual Population Survey data suggested the Bangladeshi and Pakistani community has increased by approximately 17%, and the Black community by 19%. This is in contrast with the increase in the White population being under 1%. In all three of these groups, the percentage of the population in higher managerial and professional occupations has remained relatively constant, implying little social mobility since the census.
For those with no occupation information to classify from their census record, the Bangladeshi and Pakistani ethnic groups were the most likely to be classified as "never worked or long-term unemployed1, substantially higher than those of White, Indian or Chinese ethnicity.
Another indicator of social disadvantage is living in an overcrowded household (defined as having fewer bedrooms than needed to avoid undesirable sharing). Analysis of the English Housing Survey showed that between 2014 and 2017, around 679,000 (3%) of the estimated 23 million households in England were overcrowded; however, there were marked contrasts between ethnic groups. While only 2% of White British households experienced overcrowding, it was 30% of Bangladeshi households (the highest percentage), 16% of Pakistani households and 12% of Black households.
There is also a contrast in the propensity to live in a multi-family household. An unpublished analyses of Labour Force Survey data showed that in 2018, those with a Bangladeshi and Pakistani ethnicity were much more likely than any other ethnic group to live in a multi-family household, concurring with the overcrowded household contrast reported previously in this section.
In 2018 the percentage of economically active people who were unemployed also varied sizably by ethnicity. While 4% of the White and Indian ethnic populations were unemployed, it was 8% among those of Bangladeshi or Pakistani ethnicity and 9% of those with Black ethnicity.
Occupations involving close contact with the public are deemed to be a risk factor for COVID-19 infection. Figure 1 shows how ethnicities are distributed when working in occupations classified to the transport and drivers and operatives standard occupational classification sub-major group, which encompasses bus, coach and taxi drivers and those driving other types of industrial and agricultural vehicles.
Figure 1: A higher percentage of the workforce classified to the transport and drivers and operative sub-major group were from the Bangladeshi and Pakistani ethnicity group
Percentage of workforce classified to the transport and drivers and operatives sub-major group of the standard occupational classification 2010, UK, 2018 to 2019
Source: Annual Population Survey 2018 to 2019
Notes:
- Other ethnic group encompasses Asian other, Arab and other ethnic group categories in the classification.
- 'Mixed' encompasses White and Black Caribbean; White and Asian; White and Black African; and Other Mixed ethnic group categories in the classification.
- 'Black' encompasses Black Caribbean; Black African; and Black Other ethnic group categories in the classification.
Download this chart Figure 1: A higher percentage of the workforce classified to the transport and drivers and operative sub-major group were from the Bangladeshi and Pakistani ethnicity group
Image .csv .xlsThere is a noticeably greater propensity for those with a Bangladeshi and Pakistani ethnicity to be working in these occupations. In fact, these ethnicities were twice as likely as others to be working in such occupations. In contrast those classified to the Chinese ethnicity were least likely to be working in these jobs.
The brief overview in this section gives a flavour of the differences in the social determinants of health across ethnic groups, with those of Bangladeshi, Pakistani and Black ethnicities experiencing greater levels of social disadvantage than those of White, Indian or Chinese ethnicities.
Notes for: How ethnic groups vary across some of the social determinants of health:
- Never worked or long-term unemployed contains those aged 16 to 74 years who have never worked or are economically active and have not worked since 2009. The category excludes full-time students.
2. Linked data and methodological adjustments
These analyses are based on a unique linked dataset that encompasses Census 2011 records and death registrations with England and Wales coverage. It was created by first linking the 2011 Census to the Patient Register (PR) records between 2011 and 2013 where NHS number was added to those census records identified in the patient register. Second, by using NHS number and a deterministic match key linkage method where NHS number was unavailable, death registrations were linked to 2011 Census records up to 17 April 2020.
The linked population has a very similar distribution across a range of characteristics derivable from the census data as the total census, and so can be considered representative of the general population of England and Wales in 2011. Examination of linkage rates for ethnic groups showed distributions at 2011 Census and the linked population were relatively consistent across all categories, although there was more significant variation in unlinked records. For all ethnic groups, linkage rates of NHS number exceeded 80% in all cases.
The study population included all usual residents coded to an ethnic group in 2011 and not known to have died before 2 March 2020 (N=48,422,583). Those enumerated in 2011 answering the "Intention to Stay" question, because they had entered the UK in the year before the 2011 Census took place, were excluded from the analyses because of their high propensity to have left the UK before the analysis period under investigation. However, this leaves uncertainty in the extent of emigration of usual residents between 27 March 2011 and 2 March 2020, which is dealt with later in this section.
The number of deaths occurring between 2 March 2020 and 10 April 2020 that were registered by 17 April 2020 amounted to 75,905. Of these, 68,155 were successfully linked to the 2011 Census record (90%). However, only 68,138 were usable because 17 were linked to non-usual residents, which we excluded from our study population.
Back to table of contents3. Methodology to adjust for emigration since the 2011 Census
We use data from the NHS Patient Register and the International Passenger Survey (IPS) to estimate emigration between March 2011 and March 2020 by broad age group and ethnicity. As we only have IPS data up to year ending March 2019, we assume emigration rates observed between March 2019 and March 2020 are the same as those observed in the previous year.
These emigrations and deaths are used to ensure that this analysis refers to people still in the population of England and Wales and at risk of COVID-19 from 2 March 2020 by applying out migration adjustment factors to deplete time at risk resulting from expected out migration since 2011 Census.
Back to table of contents4. Logistic regression method
By using logistic regression models, we can estimate whether the risk of dying from the coronavirus (COVID-19) is greater among Black, Asian and minority ethnic (BAME) groups than the White population, once we adjust for a range of geographical, demographic and socio-economic factors.
The dependent variable is a binary variable equal to one if the individual died from COVID-19 between 2 March 2020 and 10 April 2020, otherwise it is equal to zero. In our analytical dataset, we include all those who died from COVID-19 in this period and a weighted 1% random sample of those who did not. The regression estimates are weighted using the probability not to have migrated between 2011 and 2020.
We estimate separate models for males and females, as the risk of COVID-19 death differs markedly across gender. In our baseline model, we only adjust for age, using five-year age groups. We then adjust for geographical, demographic and socio-economic characteristics that are likely to influence the risk of dying from COVID-19 and differ across ethnic groups separately for males and females. These characteristics are retrieved from the 2011 Census and so may not accurately reflect people's socio-economic conditions in 2020, especially among young people, whose circumstances are likely to have changed. However, the risk of dying from COVID-19 is very low among children and young adults. For older adults, who are less likely to experience social mobility, the measurement error may be less of a concern.
First, we adjust for geographical factors. The probability to be infected by COVID-19 is likely to vary by region of residence, with London being the most severely affected region in terms of COVID-19 related hospital admissions. BAME are also more likely to live in London and in urban areas generally compared with the White population. Therefore, we adjust for region of residence and whether the individual lives in a rural or urban area, using the Rural Urban Classification1.
Second, we adjust for level of deprivation of the area by adding the Index of Multiple Deprivation (IMD) 2010 decile of the postcode of the residence in our model. The IMD is an overall measure of deprivation based on factors such as:
- income
- employment
- health
- education
- crime
- living environment
- access to housing within an area
A previous ONS publication showed that people living in more deprived areas are twice as likely to die from COVID-19 than those living in less deprived areas. As BAME are also more likely to live in more deprived area than those of White ethnicity, it is important to account for area deprivation.
Third, we adjust for the household composition (living alone, family with no children, family with children, other) and country of birth (UK born, non-UK born). Household composition varies by ethnicity. For instance, only 17.0% of the Asian population live in a one-person household, compared with 30.9% among those of White ethnicity. Living in a household with larger numbers of people is likely to increase the risk of being infected by COVID-19. Since this likelihood varies by ethnicity, it is a possible mediator for the relationship between ethnicity and the risk of dying from COVID-19.
Fourth, we adjust for socio-economic characteristics retrieved from the 2011 Census, which are a proxy of the socio-economic status (SES) of the individuals. We include in our model the level of highest qualification (Degree, A-level or equivalent, GCSE or equivalent, no qualification), the National Statistics Socio-economic Classification (NS-SEC) of the household head, and household tenure (owned, privately or socially rented, or other). These measures of SES vary across ethnic groups. For instance, 10.0% of people with White ethnicity were in higher managerial and professional occupations, compared with 15.4% of people from the Indian ethnic group and 6.9% from the Black ethnic group.
Measures of SES are associated with health outcomes and mortality2, and so are likely to be associated with the risk of dying from COVID-19. SES could have an impact on the risk of infection and also on the risk of dying if infected. In further work, we plan to derive an indicator of whether anyone in the household works in a high-risk occupation, such as in health care or in the transport sector.
Finally, we adjust for some measures of health from the 2011 Census. We include in the model self-reported health (very good, good, fair, poor, very poor) and a variable indicating if the individual has an activity limiting health problem or disability. Existing evidence suggests that physical health, in particular obesity, has a strong effect on the risk of dying from COVID-19. Health status varies across ethnic groups. For instance, the proportion of individuals being overweight differs markedly across ethnic groups. 62.9% of the White British population is overweight or obese, compared with 72.8% of the Black ethnic group.
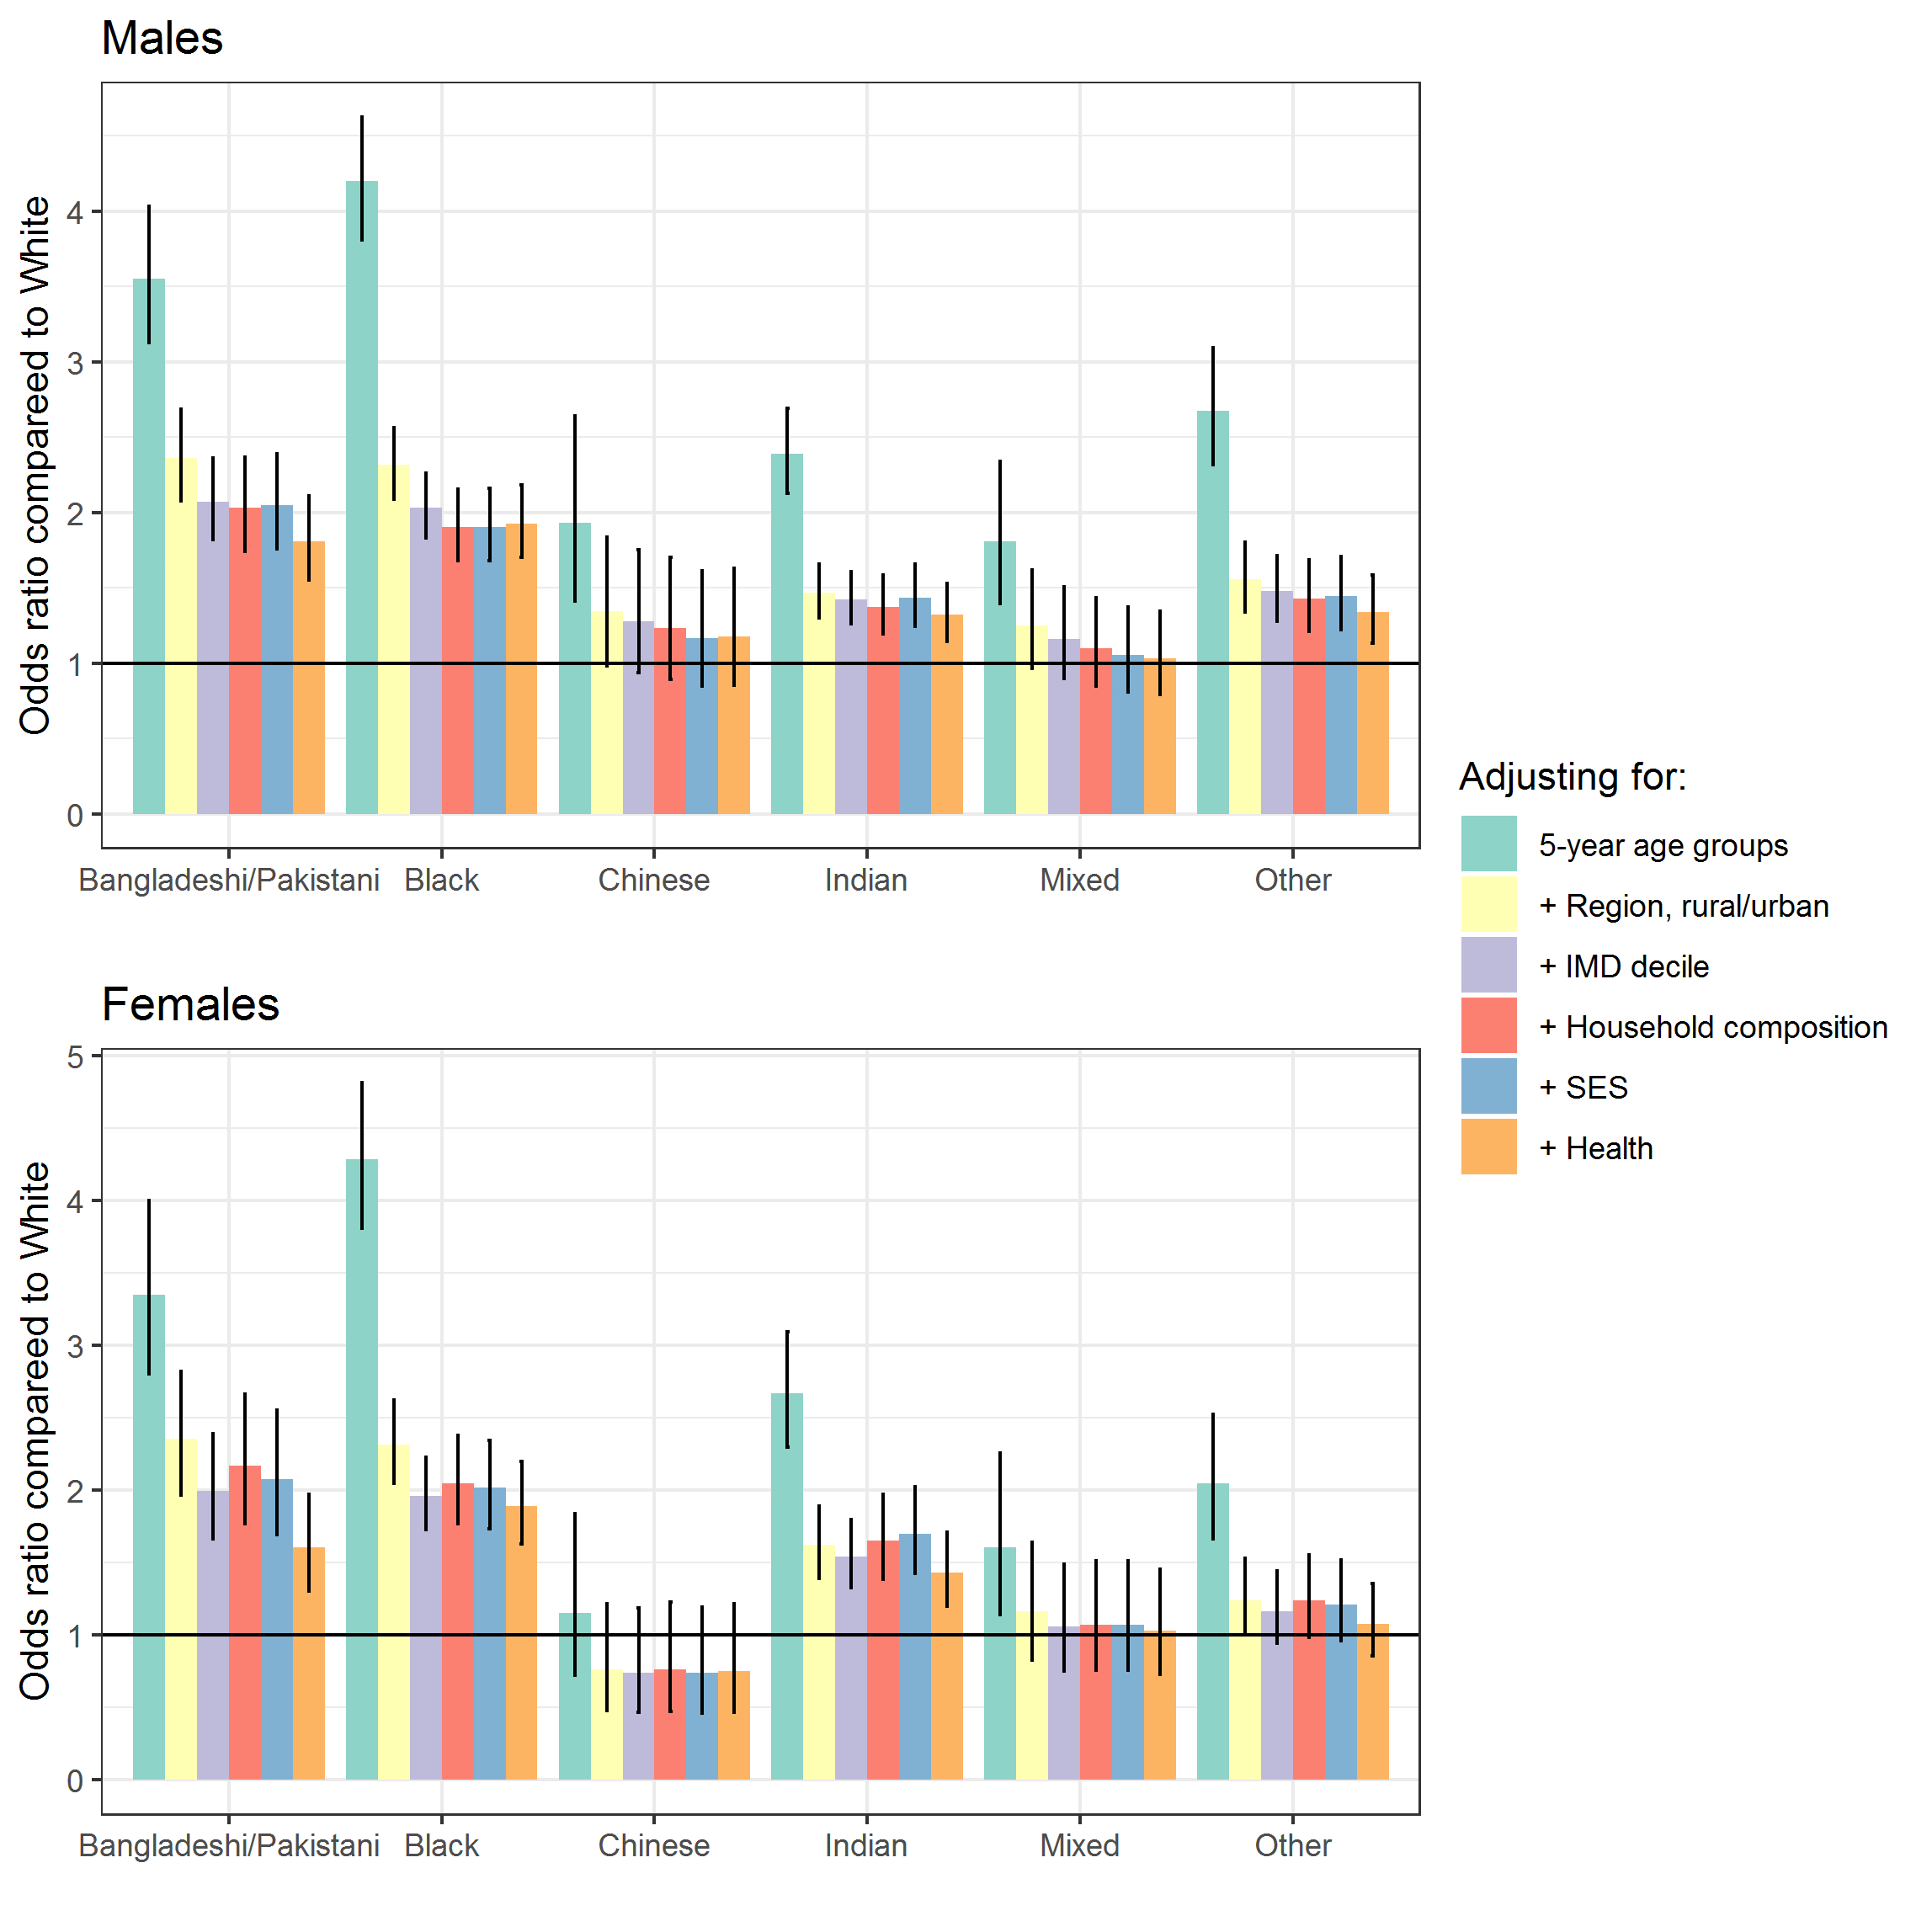
In Coronavirus-related deaths by ethnic group, England and Wales: 2 March 2020 to 10 April 2020 (Figure 4) we reported the odds ratios for the age-adjusted model and the fully adjusted model. In Figure 2 in this section we show how the odds ratios of dying from COVID-19 relative to the White population vary depending on the set of household and individual characteristics we adjust for. We report the corresponding model metrics in Table 1.
We find that adjusting for region of residence and the rural and urban classification improves the model fit and reduces substantially the odds ratios for all ethnic groups. Ethnic minority groups are also more likely to live in London and in an urban area compared with the White population. The probability to be infected by COVID-19 is likely to vary by region of residence and to be higher in more densely populated urban areas.
Adjusting for the IMD decile of the Lower layer Super Output Area (LSOA) of residence further reduces the odds ratios for all groups, albeit to a small extent. Adjusting for household composition and wider socio-economic status improves the model slightly but has little effect on the odds ratios for most groups. Adjusting for health as measured in the 2011 Census improves the model fit and also reduces the odds ratios for several groups, in particular the Bangladeshi and Pakistani ethnic group.
Figure 2: Risk of COVID-19 death by ethnic group, different specifications
Download this image Figure 2: Risk of COVID-19 death by ethnic group, different specifications
.png (118.9 kB) .xlsx (30.7 kB)
| Men | Women | |||||
|---|---|---|---|---|---|---|
| Specification | Area under the curve | Deviance | Pseudo R Squared | Area under the curve | Deviance | Pseudo R Squared |
| Age | 0.91 | 114764.44 | 0.16 | 0.91 | 81626.29 | 0.15 |
| + Region, urban/rural | 0.92 | 113141.54 | 0.18 | 0.91 | 80599.39 | 0.16 |
| + IMD decile | 0.92 | 112985.94 | 0.18 | 0.92 | 80414.48 | 0.16 |
| + Household composition | 0.92 | 112867.37 | 0.18 | 0.92 | 80313.36 | 0.16 |
| + Socio-economic Status | 0.92 | 112498.20 | 0.18 | 0.92 | 79944.46 | 0.17 |
| + Health | 0.93 | 111577.83 | 0.19 | 0.93 | 78932.52 | 0.18 |
Download this table Table 1: Logistic regression models metrics
.xls .csvNotes for Logistic regression method:
The Rural-Urban Classification categorises geographical areas on the basis of physical settlement and related characteristics into four urban and six rural classes.
For more information see Glymour MM, Avendano M and Kawachi I (2014). Socioeconomic Status and Health, in: Berkman L, Kawachi I and Glymour M (Editors), Social Epidemiology (2nd edition., pages 17 to 62), Oxford University Press.