Table of contents
- Main points
- Important information
- UK suicides
- Suicide rates by age
- Suicide rates by country
- Methods of suicide
- Registration delays
- Narrative conclusions in England and Wales
- Use of the statistics
- Policy context
- Comparison with other countries
- Methodological changes
- Where to go for help
- References
- Background notes
- Methodology
1. Main points
There were 6,122 suicides of people aged 10 and over registered in the UK in 2014, 120 fewer than in 2013 (a 2% decrease)
The UK suicide rate was 10.8 deaths per 100,000 population in 2014. The male suicide rate was more than 3 times higher than the female rate, with 16.8 male deaths per 100,000 compared with 5.2 female deaths
The male suicide rate in the UK decreased in 2014 from 17.8 to 16.8 deaths per 100,000 population; while the female suicide rate increased from 4.8 to 5.2 deaths per 100,000 population
The highest suicide rate in the UK in 2014 was among men aged 45 to 59, at 23.9 deaths per 100,000, slightly lower than the record high seen in 2013. This age group also had the highest rate among women, at 7.3 deaths per 100,000 population
The most common suicide method in the UK in 2014 was hanging, which accounted for 55% of male suicides and 42% of female suicides
The suicide rate in England increased in 2014 (10.3 deaths per 100,000). The increase was driven by a rise in female suicides. Suicide rates decreased in Wales (9.2 deaths per 100,000), Scotland (14.5 deaths per 100,000) and Northern Ireland (16.5 deaths per 100,000)
The highest suicide rate in England was in the North East at 13.2 deaths per 100,000 population; London had the lowest at 7.8 per 100,000
2. Important information
This bulletin presents the latest figures from the Office for National Statistics (ONS) on deaths from suicide in the UK. Figures from 1981 are available to download and are discussed in the commentary to provide further context to the latest data.
Change to the National Statistics suicide definition
In 2016, the National Statistics definition of suicide has been modified to include deaths from intentional self-harm in 10- to 14-year-old children in addition to deaths from intentional self-harm and events of undetermined intent in people aged 15 and over.
All data presented in this bulletin and in the accompanying reference tables has been revised to reflect this change so that data for 2014 is comparable with previous years. For information about the National Statistics suicide definition and about how including these child suicides has impacted on the statistics, see the “Methodological changes” section towards the end of this bulletin.
Registration delays
The figures presented here are for deaths registered each year, rather than deaths occurring in each year. Except in Scotland (see Background note 7), all suicides are certified by a coroner following an inquest. Due to the length of time it takes a coroner to complete an inquest, half of the total number of suicides registered in the UK in 2014 will have actually occurred prior to 2014. Nevertheless, general suicide trends are broadly equivalent regardless of whether the data is analysed by year of occurrence or year of registration. See the “Impact of registrations delays on suicides” section for more information.
Information for the media
If you are a journalist covering a suicide-related issue, please consider following the Samaritans’ media guidelines on the reporting of suicide, due to the potentially damaging consequences of irresponsible reporting. In particular, the guidelines advise including links to sources of support for anyone affected by the themes in the article, such as Samaritans.
Back to table of contents3. UK suicides
In 2014, a total of 6,122 suicides of people aged 10 and over were registered in the UK, 120 fewer than in 2013 (a 2% decrease). Historically, a generally downward trend in suicide rates was observed between 1981 and 2007, with a decrease from 14.7 to 10.0 deaths per 100,000 population (see Figure 1). Suicide rates began to increase in 2008 – peaking at 11.1 deaths per 100,000 in 2013, before dropping slightly in 2014 to 10.8 deaths per 100,000.
Of the total number of suicides registered in 2014 in the UK, 76% were males and 24% were females. Suicide rates have been consistently lower in females than in males throughout the time period covered by this data. Although suicide rates fell significantly for both sexes between 1981 and 2007, the fall was more pronounced among females. Consequently, the proportion of male to female suicides has increased since 1981 when 63% were male and 37% were female. Since 2007, the female suicide rate has stayed relatively constant and was 5.2 deaths per 100,000 in 2014.
However, the male rate increased significantly between 2007 and 2013, peaking at 17.8 deaths per 100,000 population in 2013, before falling significantly to 16.8 deaths per 100,000 in 2014.
Figure 1: Age-standardised suicide rates by sex, deaths registered between 1981 and 2014
UK
Source: Office for National Statistics, National Records of Scotland, Northern Ireland Statistics and Research Agency
Notes:
- The National Statistics definition of suicide is given in the 'Suicide definition' section.
- Figures are for persons aged 10 years and over.
- Age-standardised suicide rates per 100,000 population, standardised to the 2013 European Standard Population. Age-standardised rates are used to allow comparison between populations which may contain different proportions of people of different ages.
- Figures include deaths of non-residents.
- Figures are for deaths registered, rather than deaths occurring in each calendar year. Due to the length of time it takes to complete a coroner’s inquest, it can take months or even years for a suicide to be registered. More details can be found in the registration delays section.
Download this chart Figure 1: Age-standardised suicide rates by sex, deaths registered between 1981 and 2014
Image .csv .xls4. Suicide rates by age
Males
Men aged 45 to 59 had the highest suicide rate in 2014 for the second year in a row with a rate of 23.9 deaths per 100,000 population. Between 2000 and 2011, the rate in this age group was the second highest, behind men aged 30 to 44. Since 2007, the rate in the 45 to 59 age group has been increasing.
Men aged 30 to 44 had the second highest suicide rate, at 21.3 deaths per 100,000 population in 2014 (see Figure 2). The suicide rate in this age group has remained relatively stable over the last decade and in 2014 it was significantly higher than the suicide rate in young men under 30 and older men aged 60 and over – highlighting that it is middle-aged men that are at greatest risk from suicide.
The suicide rate in older men was significantly lower than for middle-aged men. Despite a small increase in 2013, suicide rates in men aged 60 to 74 years and those aged 75 and over have decreased steadily since 1981 (13.6 and 14.4 deaths per 100,000 population respectively in 2014).
Males aged under 30 had the lowest suicide rate of any age group, at 9.9 deaths per 100,000 population. This suicide rate in males aged under 30 has remained stable since 2002.
From 1981, suicides in men aged over 60 have been steadily decreasing, while other age groups have shown more variable trends. The 30 to 44 age group had the highest rate from 1995 to 2012. More recently, the 45 to 59 age group has had the highest suicide rate, overtaking the younger age group, having increased by over a third since 2007.
Suicides by 10- to 29-year-olds increased throughout the mid 1980s up until the late 1990s before showing a steady decline until 2005. Since then, the rate has remained relatively stable. This age group has consistently had the lowest suicide rate since 2001.
Figure 2: Age-specific suicide rate, males, deaths registered between 1981 and 2014
UK
Source: Office for National Statistics, National Records of Scotland, Northern Ireland Statistics and Research Agency
Notes:
- The National Statistics definition of suicide is given in the 'Suicide definition' section.
- Figures are for persons aged 10 years and over.
- Age-specific suicide rate per 100,000 population.
- Figures include deaths of non-residents.
- Figures are for deaths registered, rather than deaths occurring in each calendar year. Due to the length of time it takes to complete a coroner’s inquest, it can take months or even years for a suicide to be registered. More details can be found in the registration delays section.
Download this chart Figure 2: Age-specific suicide rate, males, deaths registered between 1981 and 2014
Image .csv .xlsFemales
In 2014, the age group with the highest suicide rate for females was 45- to 59-year-olds, with a rate of 7.3 deaths per 100,000 population (see Figure 3). This has been the case since 2003. Analysing this data by 5 year age group shows that females aged 50 to 54 have the highest suicide rate at 8.0 per 100,000 population.
Between 1981 and 1994, female suicide rates decreased across all broad age groups apart from 10- to 29-year-olds. Suicide rates for women under 60 have remained relatively constant since 2008. Suicide rates in women aged 60 and over continue to show a broadly decreasing trend and have shown the biggest reduction since 1981.
Since 2005, the 30 to 44 age group has had the second highest female suicide rate reaching 6.1 deaths per 100,000 population in 2014. This rate is significantly higher than the under 30 and over 60 age groups.
The lowest rate has consistently been for those aged 10 to 29, where the 2014 rate was 3.2 deaths per 100,000. This age group was the only group to show a significant increase between 2013 and 2014, bringing the suicide rate to a similar level as seen between 2009 and 2011. Some annual fluctuations have been observed but there have been no clear trends over time.
The 60 to 74 and the 75 and over age groups had the same suicide rate in 2014 for females (4.6 deaths per 100,000 population). Both of these age groups have shown dramatic decreases since 1981. Since 2008, the rates have shown no significant changes.
Figure 3: Age-specific suicide rate, females, deaths registered between 1981 and 2014
UK
Source: Office for National Statistics, National Records of Scotland, Northern Ireland Statistics and Research Agency
Notes:
- The National Statistics definition of suicide is given in the 'Suicide definition' section.
- Figures are for persons aged 10 years and over.
- Age-specific suicide rate per 100,000 population.
- Figures include deaths of non-residents.
- Figures are for deaths registered, rather than deaths occurring in each calendar year. Due to the length of time it takes to complete a coroner’s inquest, it can take months or even years for a suicide to be registered. More details can be found in the registration delays section.
Download this chart Figure 3: Age-specific suicide rate, females, deaths registered between 1981 and 2014
Image .csv .xls5. Suicide rates by country
Between 1981 and 2005, Scotland had the highest suicide rate of all the constituent countries of the UK. During this period, Northern Ireland generally had the lowest rate. England showed a decreasing trend during this period, and Wales fluctuated year on year between 11.0 and 14.9 deaths per 100,000 population. In 2005, the suicide rate in Northern Ireland showed a large increase and had the highest rate in the UK. Since this time, the highest suicide rate has varied between Northern Ireland and Scotland, with England having the lowest rate until 2014 when the rate rose above that seen in Wales.
Figure 4: Age-standardised rate by country, deaths registered between 1981 and 2014
UK
Source: Office for National Statistics, National Records of Scotland, Northern Ireland Statistics and Research Agency
Notes:
- The National Statistics definition of suicide is given in the 'Suicide definition' section.
- Figures are for persons aged 10 years and over.
- Age-standardised suicide rates per 100,000 population, standardised to the 2013 European Standard Population. Age-standardised rates are used to allow comparison between populations which may contain different proportions of people of different ages.
- Figures for Scotland and Northern Ireland include deaths of non-residents. Figures for England and Wales exclude deaths of non-residents.
- Figures are for deaths registered, rather than deaths occurring in each calendar year. Due to the length of time it takes to complete a coroner’s inquest, it can take months or even years for a suicide to be registered. More details can be found in the registration delays section.
Download this chart Figure 4: Age-standardised rate by country, deaths registered between 1981 and 2014
Image .csv .xlsEngland
There were 4,882 suicides among people aged 10 and over registered in England in 2014, 155 more than 2013 (a 3% increase). Of these, more than three-quarters (76%) were male (3,701 male suicides and 1,181 female suicides in 2014). The increase in suicides in 2014 has been driven by an increase in the number of female suicides, with 14% more suicides in females in England in 2014 than in 2013. In contrast, male suicide rates have remained stable. In recent years there has been an increase in suicide prevention strategies and support targeted at males in an effort to counteract the high rates of male suicide. The increase in the suicide rate for all persons in England in 2014 contrasts with the rest of the UK, as suicide rates fell in Wales, Scotland and Northern Ireland in 2014 (see Figure 4).
Overall, the age-standardised suicide rate for persons increased slightly, from 10.1 deaths per 100,000 population in 2013 to 10.3 in 2014. This is not a significant increase, although it is the highest suicide rate seen since 2004 when the rate was also 10.3 deaths per 100,000.
The female age-standardised rate increased significantly from 4.3 to 4.9 deaths per 100,000 population between 2013 and 2014, the highest since 2005; while the equivalent male rate decreased marginally from 16.1 to 16.0 deaths per 100,000 population.
English regions
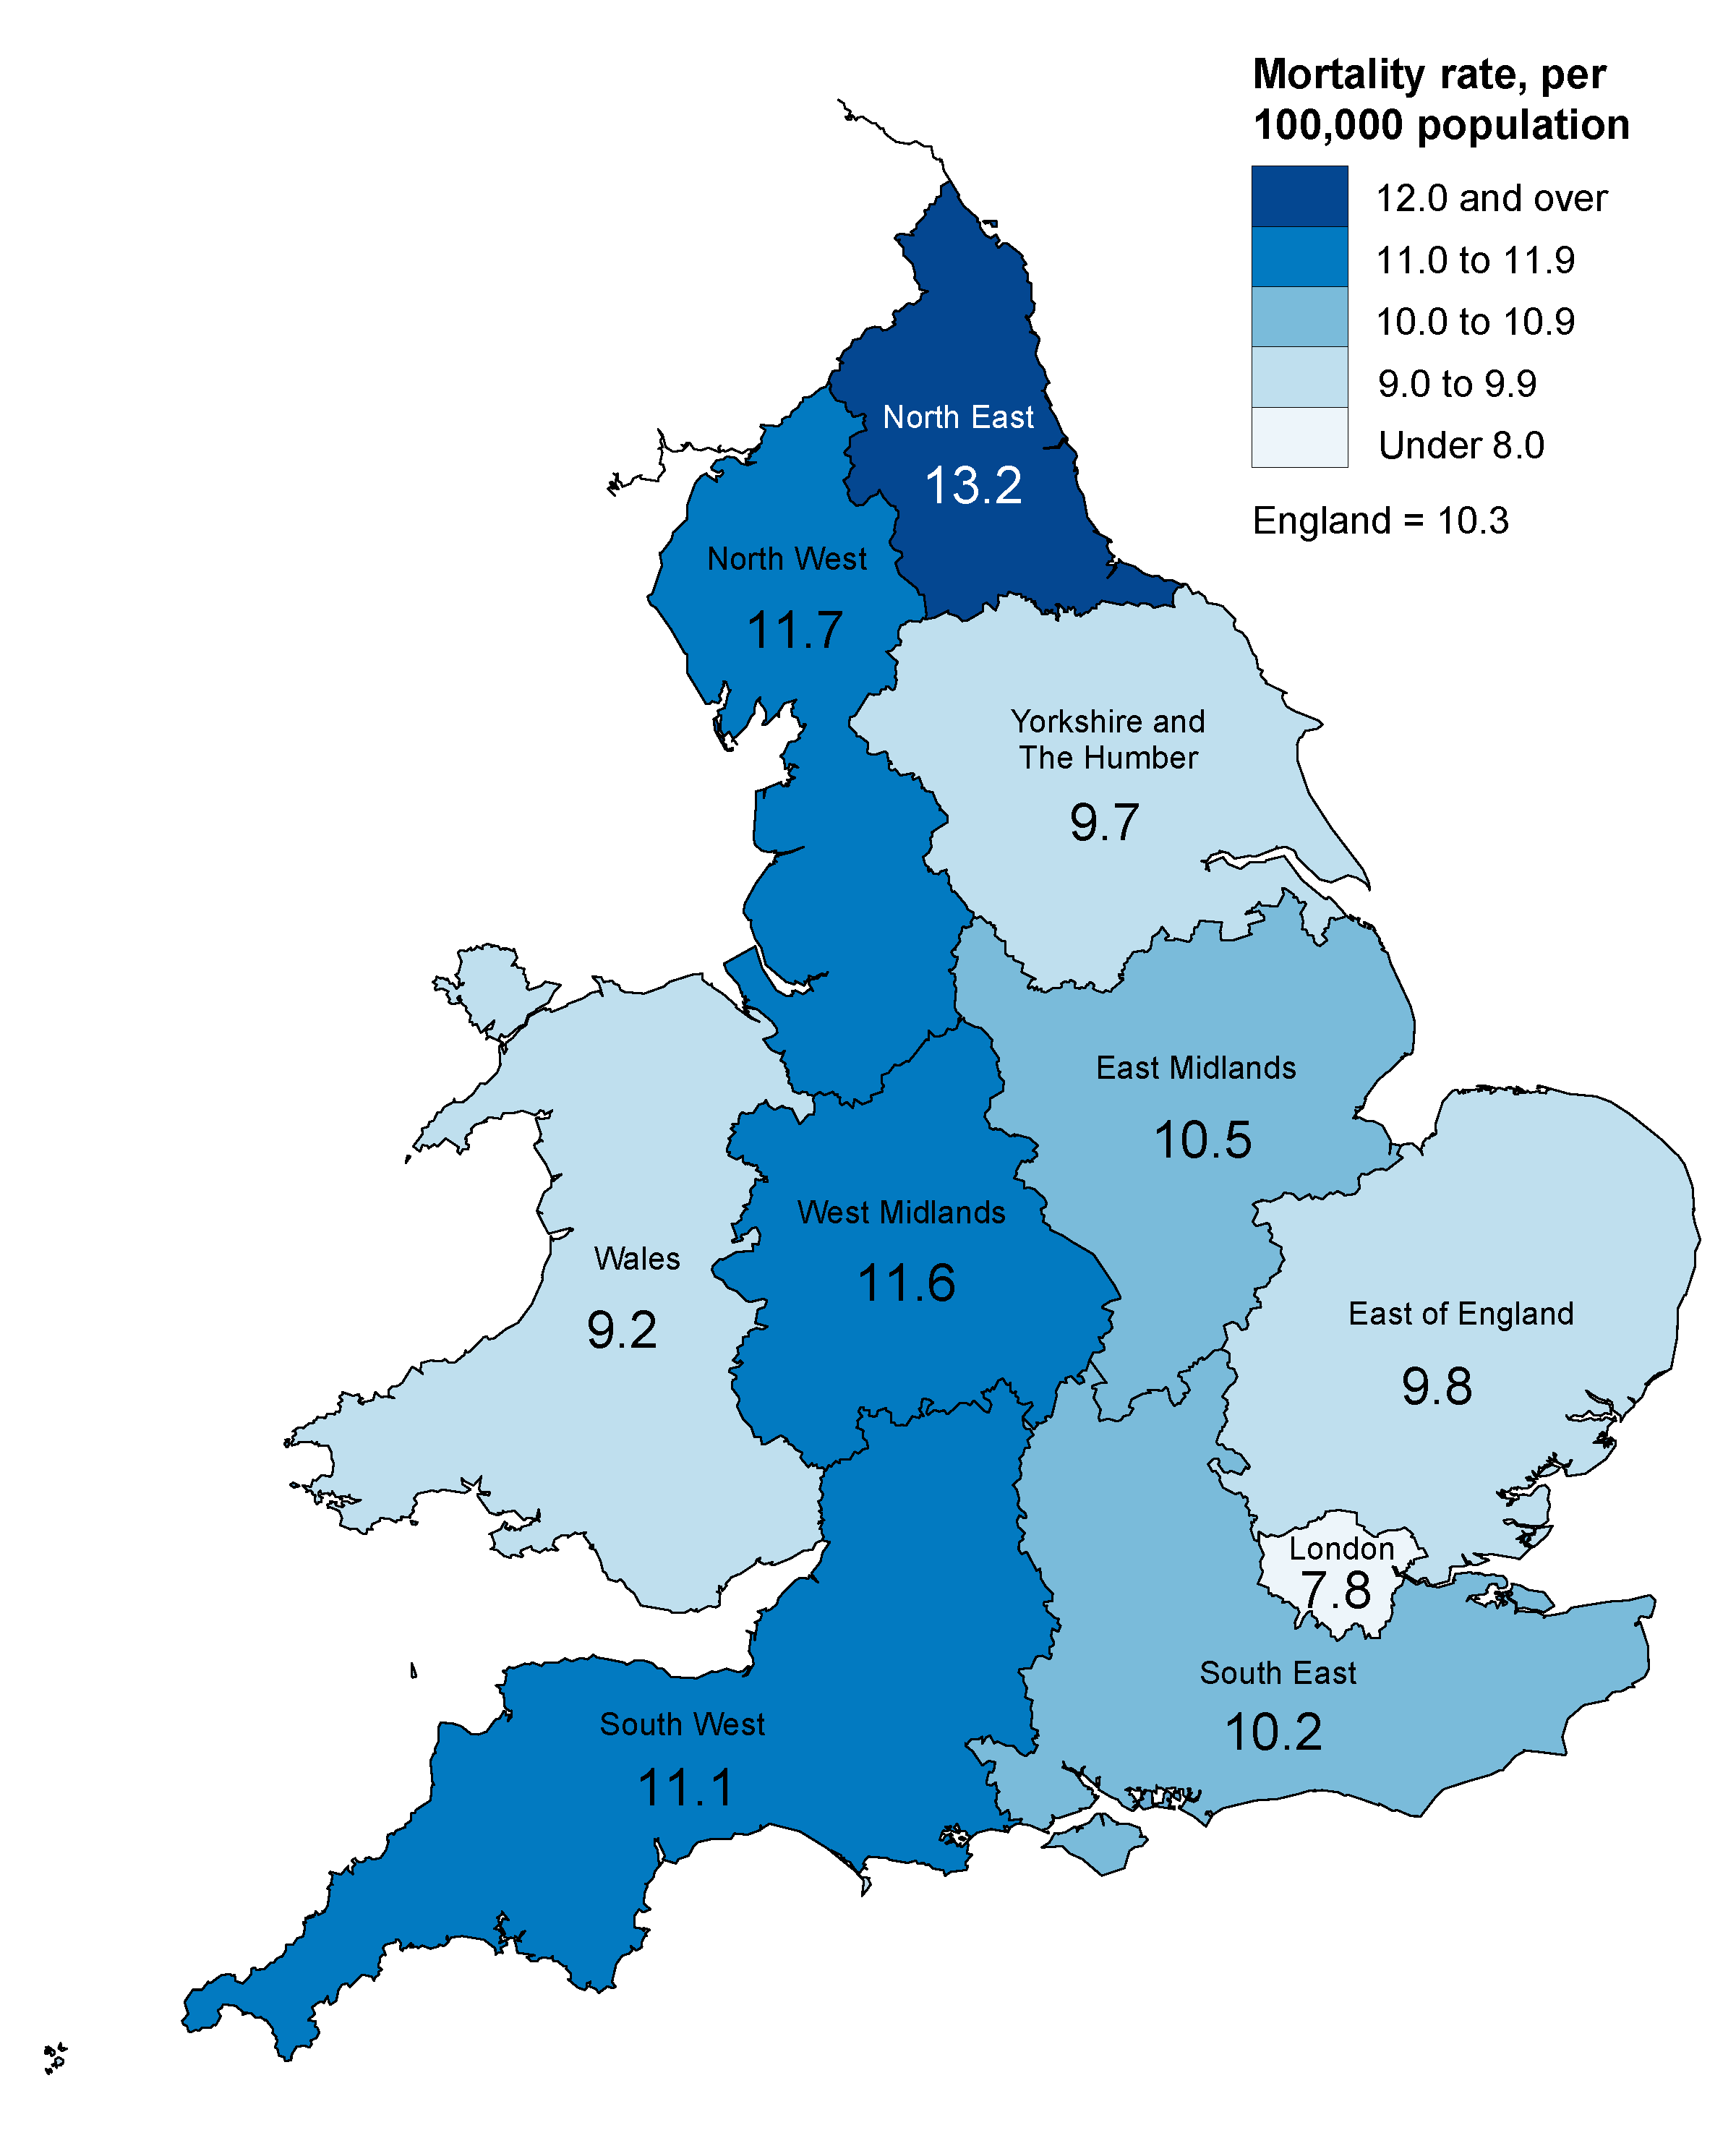
In 2014, the suicide rate was highest in the North East at 13.2 deaths per 100,000 population and lowest in London at 7.8 per 100,000 (see Figure 5). The suicide rate in the North East was significantly higher than all other regions apart from the South West, West Midlands and the North West in 2014.
Suicide rates increased across all English regions in 2014 apart from Yorkshire and The Humber, the South East and the South West. The biggest percentage increase was seen in the West Midlands where the rate increased by 18%, from 9.8 deaths per 100,000 population in 2013 to 11.6 deaths per 100,000 population in 2014. This may be related to the decrease in hard-to-code narrative conclusions used for suicides by coroners in this region. For more information, see the narrative conclusions section. The biggest percentage decrease was observed in Yorkshire and The Humber, which saw an 11% decrease from 10.9 to 9.7 deaths per 100,000 population.
Reference Table 7 shows that since 2009, suicide rates have tended to be highest in the North East, North West and South West of England; while London tends to have the lowest rates. The age-standardised all persons rate of 7.8 deaths per 100,000 population in London in 2014 was the second lowest rate of any region since 1981.
The male suicide rate was highest in the North East in 2014 at 21.4 deaths per 100,000 population, followed by the West Midlands and North West, with rates of 18.5 and 17.7 deaths per 100,000 population respectively. This was an increase in the North East from the previous year, when the rate was 20.8 deaths per 100,000. For males, the North East suicide rate was significantly higher than all other regions, apart from the North West and West Midlands in 2014. London was significantly lower than all other English regions in 2014, with a suicide rate of 12.4 deaths per 100,000 population.
In contrast with males, the female suicide rate was highest in the South West in 2014, with 6.5 deaths per 100,000 population. This is the highest female suicide rate across all English regions since 2004. Since 2006, the South West has consistently had one of the highest suicide rates for females. The lowest suicide rate was in London, where there were 3.5 deaths per 100,000 population in 2014.
In the aggregated period 2012 to 2014, Preston had the highest suicide rate of all English local authorities with a rate of 18.6 deaths per 100,000 population. Stevenage had the lowest suicide rate (2.9 deaths per 100,000 population). Deaths, rates and median registration delays are available for English and Welsh local authorities in the local authority reference tables.
Wales
There were 247 suicides in people aged 10 and over in Wales in 2014 (199 male, 48 female suicides); this is a decrease of 146 deaths since 2013.
The age-standardised suicide rate for all persons dropped significantly in 2014 from 14.7 deaths per 100,000 population in 2013 to 9.2 deaths per 100,000 population in 2014 (a 37% decrease). This is the lowest suicide rate observed since the beginning of our time series in 1981.
Similar trends were seen in males and females in Wales. The age-standardised suicide rate for males decreased significantly, from 24.5 deaths per 100,000 population in 2013 to 15.3 deaths per 100,000 population in 2014; this is the lowest since 2008, and the second lowest since 1981. The male suicide rate in Wales was significantly higher than the rate in England between 2010 and 2013. However, the sharp fall in the suicide rate in Wales in 2014, means that the Welsh suicide rate is now lower than in England.
For females, the rate decreased from 5.5 to 3.4 deaths per 100,000 population; the lowest since the beginning of our time series in 1981. The female suicide rate in Wales was slightly higher than in England between 2010 and 2013, but the contrasting trends in England and Wales in 2014 mean that the suicide rate in Wales was significantly lower than that seen in England in 2014.
In 2014, there was a lot of activity surrounding the consultation on the new “Talk To Me 2” Welsh suicide prevention strategy which may have had a positive effect in reducing the number of suicides in Wales. However, it is too soon to tell if the sharp fall in the suicide rate in Wales in 2014 is the start of a downward trend or simply a large annual fluctuation. Analysis of when the deaths occurred suggests the decrease may not be as large as it appears. Not all suicides that occurred in 2014 have been registered yet; however, when late registrations of deaths that occurred in 2013 and 2014 are included in the figures, the drop in the suicide rate between 2013 and 2014 is no longer significant.
Blaenau Gwent had the highest suicide rate of all Welsh local authorities in the aggregated period 2012 to 2014 (16.0 deaths per 100,000 population). The lowest rate was in Torfaen where the rate was 5.4 deaths per 100,000 population.
Figure 5: Age-standardised suicide rate by country and region, deaths registered in 2014
England and Wales
Source: Office for National Statistics
Notes:
- The National Statistics definition of suicide is given in the 'Suicide definition' section.
- Figures are for persons aged 10 years and over.
- Age-standardised suicide rates per 100,000 population, standardised to the 2013 European Standard Population. Age-standardised rates are used to allow comparison between populations which may contain different proportions of people of different ages.
- Figures are for persons usually resident in each area, based on boundaries as of November 2015.
- Figures are for deaths registered, rather than deaths occurring in 2014. Due to the length of time it takes to complete a coroner’s inquest, it can take months or even years for a suicide to be registered. More details can be found in the registration delays section.
Download this image Figure 5: Age-standardised suicide rate by country and region, deaths registered in 2014
.png (192.0 kB) .xls (62.5 kB)
Scotland
There were 696 suicides in Scotland in 2014, 98 fewer than the previous year. In 2014, the suicide rate in Scotland was the lowest since 1981 at 14.5 deaths per 100,000 population. This is 13% lower than the rate in 2013, though it is not quite a statistically significant change. Since 2011, the suicide rate in Scotland has been showing a decreasing trend, following year-on-year fluctuations from 2002 onwards.
The number of male suicides in Scotland fell by 19% in 2014 (from 610 in 2013 to 497 in 2014). The male suicide rate decreased significantly, from 26.4 deaths per 100,000 population in 2013 to 20.2 deaths per 100,000 population in 2014. This rate is the lowest since 1981, although it is not the lowest number of deaths observed in this time due to population changes.
The number of female suicides increased by 15 deaths, from 184 deaths in 2013 to 199 deaths in 2014. Female suicides fluctuate year on year and do not show any clear trends. The suicide rate increased to 8.6 deaths per 100,000 population in 2014, but was still lower than most years since 1981.
Northern Ireland
The number of suicides in Northern Ireland decreased from 303 deaths in 2013 to 268 deaths in 2014. Northern Ireland has had the highest suicide rate in the UK since 2012. In 2014, there were 16.5 deaths per 100,000 population in Northern Ireland. Since 2006, there have been no obvious trends in suicide rates in Northern Ireland, with the rate fluctuating between 15.7 and 19.3 deaths per 100,000 population. There was a notable increase between 2004 and 2006 when the rate increased from 9.8 deaths per 100,000 population in 2004 to 14.1 deaths per 100,000 in 2005 and again up to 18.5 deaths per 100,000 population in 2006. Since then the rate has consistently remained above 15 deaths per 100,000. Prior to April 2006, there were seven Coroner’s districts in Northern Ireland. Following a review of the Coroner’s Service, the separate districts were amalgamated into one centralised Coroner’s Service which coincides with the increase in suicide deaths.
Males made up 77% of all suicides in Northern Ireland in 2014. There was a decrease from 229 male deaths in 2013 to 207 deaths in 2014. This corresponds with a decrease in the male suicide rate from 29.3 deaths per 100,000 population in 2013 to 25.9 deaths per 100,000 population in 2014.
Female suicides decreased from 74 deaths in 2013 to 61 deaths in 2014 representing an 18% decrease. The suicide rate decreased from 9.1 deaths per 100,000 to 7.4 deaths per 100,000 population.
Back to table of contents6. Methods of suicide
The 2 most common methods of suicide among men in the UK are hanging followed by poisoning (Figure 6). The same pattern has been seen for women since 2013, previously, the most common method of suicide for women was poisoning.
For both men and women, the proportion of deaths from poisoning has fallen over the last decade or so, to 19% for men and 37% for women in 2014. Conversely, the proportion of suicides from hanging has increased over the same period, to 55% for men and 42% for women in 2014. The proportion of suicides involving drowning, falls and other methods have remained fairly consistent over the past decade.
Figure 6: Proportion of suicides by method and sex, deaths registered in 2014
UK
Source: Office for National Statistics, National Records of Scotland, Northern Ireland Statistics and Research Agency
Notes:
- The National Statistics definition of suicide is given in the 'Suicide definition' section.
- Figures are for persons aged 10 years and over.
- Figures include deaths of non-residents.
- Figures are for deaths registered, rather than deaths occurring in 2014. Due to the length of time it takes to complete a coroner’s inquest, it can take months or even years for a suicide to be registered. More details can be found in the registration delays section.
Download this chart Figure 6: Proportion of suicides by method and sex, deaths registered in 2014
Image .csv .xlsA study by the World Health Organisation (WHO) in 2008, which compared methods of suicide by country), found that methods vary between countries and that this difference is driven primarily by the availability of means. For example, while hanging was the most common method in the majority of countries, suicide involving firearms was the most common method in the United States and jumping from a height was the most common method in Hong Kong.
The report also highlighted differences in method between the sexes, with men tending to choose a more violent mechanism, such as hanging or suicide by firearm, whereas women choose less violent mechanisms such as poisoning.
The increase in the proportion of suicides from hanging seen in the UK, in particular in women, may be related to restrictions on the availability of other methods, for example, drugs used in overdose and to a misconception that hanging is a quick and painless way to die (Biddle et al, 2010). Analysis conducted using our data by Hawton et al in 2012 revealed that there was a major reduction in deaths involving co-proxamol following its withdrawal in 2005. In a separate study published in 2013, Hawton et al found that UK legislation to reduce the size of paracetamol packages was followed by a significant reduction in the number of deaths due to paracetamol overdose.
Back to table of contents7. Registration delays
In common with most other UK mortality statistics, suicide figures are presented for deaths registered in a particular calendar year, which enables figures to be published in a timely manner. The alternative would be to publish statistics based on the year in which the death occurred − however, this would delay publication, cause repeated revisions to historical data and be inconsistent with other published mortality figures.
Publishing suicide figures based on year of registration means that many deaths appear in the statistics of a year which is later than the year in which the death occurred. Differences in the death registration systems in England, Wales, Scotland and Northern Ireland mean that the length of registration delays varies between countries, which has implications for the comparability of mortality statistics across the UK (see Background note 7). That is, the UK suicide figures for deaths registered in 2014 will comprise deaths occurring in different time periods for different countries of the UK. However, as suicide trends tend to change relatively slowly over time, this is unlikely to have a great impact on the usability of UK suicide statistics.
Figure 7 shows that registration delays are now fairly similar in England, Wales and Northern Ireland, but are much shorter in Scotland.
In 2014, the median registration delay for suicides in England was 150 days. Of the 4,822 suicides in England registered in 2014, 49% occurred before 2014. In England, the average registration delay gradually increased until 2008; since then the delay has been fairly stable.
For Wales, the median registration delay for suicides was 133 days in 2014, 10 days shorter than 2013. Out of the 247 suicides in Wales registered in 2014, 42% occurred before 2014. The average registration delay gradually increased up to 2009 and has steadily decreased since then.
In Northern Ireland, median registration delays for suicides peaked in 2005 at 334 days, but had decreased sharply to 138 days by 2012. In 2014, it increased slightly by 5 days to 146 days.
In 2014, the median registration delay in Scotland was just 7 days. Scotland has a different registration system to the rest of the UK which results in far more timely registrations. Although the registration delay has increased slightly since 2001, almost all suicides in Scotland are registered in the year that they occur.
Figure 7: Median registration delay for suicides, deaths registered between 2001 and 2014
UK
Source: Office for National Statistics, National Records of Scotland, Northern Ireland Statistics and Research Agency
Notes:
- The National Statistics definition of suicide is given in the 'Suicide definition' section.
- Figures are for persons aged 10 years and over.
- The registration delay is calculated as the difference between the date each death occurred and the date it was registered, measured in days. Additional information on the calculation of registration delays is provided in Background note 7.
- Figures include deaths of non-residents.
- Figures are for deaths registered, rather than deaths occurring in each calendar year. Due to the length of time it takes to complete a coroner’s inquest, it can take months or even years for a suicide to be registered.
Download this chart Figure 7: Median registration delay for suicides, deaths registered between 2001 and 2014
Image .csv .xlsAdditional information on registration delays for suicides, including separate figures for males and females and an indication of the range of registration delays (the lower and upper quartile) can be found in Reference Table 18.
Further analysis has been carried out on the England and Wales data for 2001 to 2013 based on the date the suicide occurred, to test whether the registration delays made any significant difference to the findings. For England and Wales combined and England alone, there was a significant difference between the rates produced using suicide registrations and occurrences in 2012. This was also seen in males. There were no significant differences in results for any other year for males, females or persons in England and Wales combined and separately.
The time trend in suicide rates was very similar whether using date of registration or occurrence. The main difference is that the occurrence-based trend appears slightly shifted to the left of the chart in comparison, this is expected as the deaths occurred before they were registered.
Back to table of contents8. Narrative conclusions in England and Wales
There are around 30,000 coroner’s inquests held in England and Wales each year. In 2014, 87% of these inquests received a “short form” conclusion such as accident, misadventure, natural causes, suicide or homicide. The remaining 13% were “narrative conclusions” which can be used by a coroner or jury instead of a short form conclusion to express their findings as to the cause of death. A narrative conclusion can be given in a range of different circumstances and for a variety of causes of death (see Table 1).
Table 1: Number of narrative conclusions by underlying cause of death, deaths registered in 2014
| England and Wales | ||||
| Underlying cause of death | Hard-to-code narrative conclusion | Other type of narrative conclusion | All narrative conclusions | |
| All causes | 2,468 | 1,366 | 3,834 | |
| Diseases | 1,343 | 543 | 1,886 | |
| Neoplasms | 241 | 131 | 372 | |
| Circulatory | 349 | 165 | 514 | |
| Respiratory | 119 | 46 | 165 | |
| Digestive system | 151 | 75 | 226 | |
| Other disease or condition | 483 | 126 | 609 | |
| External causes | 1,125 | 823 | 1,948 | |
| Transport accidents | 76 | 31 | 107 | |
| Other accidents | 961 | 203 | 1,164 | |
| Intentional self-harm | 0 | 191 | 191 | |
| Undetermined intent | 0 | 273 | 273 | |
| Other external cause | 88 | 125 | 213 | |
| Source: Office for National Statistics | ||||
| Notes: | ||||
| 1. Underlying cause of death was defined using the International Classification of Diseases, Tenth Revision (ICD–10) codes shown in Box 1 below. | ||||
| 2. Figures include deaths of non-residents. | ||||
| 3. Figures are for deaths registered, rather than deaths occurring in 2014. Due to the length of time it takes to complete a coroner’s inquest, it can take months or even years for a death to be registered. | ||||
| 4. Narrative conclusions are a factual record of how, and in what circumstances the death occurred. They are sometimes returned where the cause of death does not easily fit any of the standard verdicts. Hard-to-code narrative conclusions are those where no indication of the deceased's intent has been given by the certifier, which makes it difficult for ONS to assign an underlying cause of death. | ||||
Download this table Table 1: Number of narrative conclusions by underlying cause of death, deaths registered in 2014
.xls (52.2 kB)In 2014, around half of all narrative conclusions in England and Wales resulted from an external cause of death (an injury or poisoning) rather than a disease. Some of these narrative conclusions clearly state the intent (for example, accidental) and mechanism (for example, hanging, poisoning) of death. However, in some cases, the coroner may not indicate unambiguously whether the fatal injury was accidental, or if there was a deliberate intent to self-harm, or if the deceased’s intent could not be determined. We define deaths where the intent has not been specified as “hard-to-code”. The rules for coding cause of death mean that, if no indication of intent has been given by the certifier, a death from injury or poisoning must be coded as accidental.
Table 2: Hard-to-code narrative conclusions as a percentage of all inquest verdicts by country and Region, deaths registered between 2010 to 2014
| England, regions in England and Wales | |||||
| % | |||||
| 2010 | 2011 | 2012 | 2013 | 2014 | |
| England | 12 | 6 | 7 | 8 | 8 |
| North East | 8 | 2 | 3 | 3 | 3 |
| North West | 15 | 6 | 7 | 7 | 10 |
| Yorkshire and The Humber | 10 | 9 | 11 | 10 | 10 |
| East Midlands | 11 | 5 | 8 | 10 | 11 |
| West Midlands | 20 | 8 | 8 | 8 | 5 |
| East of England | 13 | 10 | 11 | 12 | 9 |
| London | 8 | 6 | 6 | 8 | 9 |
| South East | 8 | 5 | 5 | 7 | 7 |
| South West | 8 | 5 | 6 | 7 | 8 |
| Wales | 8 | 4 | 5 | 4 | 13 |
| Source: Office for National Statistics Notes: 1. Narrative conclusions are a factual record of how, and in what circumstances the death occurred. They are sometimes returned where the cause of death does not easily fit any of the standard verdicts. Hard-to-code narrative conclusions are those where no indication of the deceased's intent has been given by the certifier, which makes it difficult for ONS to assign an underlying cause of death. A more in depth explanation can be found in the Narrative conclusions in England and Wales section. 2. Figures exclude deaths of non-residents. 3. Based on boundaries as of November 2015. 4. Figures are for deaths registered, rather than deaths occurring in each calendar year. Due to the length of time it takes to complete a coroner’s inquest, it can take months or even years for a suicide to be registered. 5. Percentages are calculated as the number of hard-to-code narrative conclusions as a percentage of all inquest verdicts. | |||||
Download this table Table 2: Hard-to-code narrative conclusions as a percentage of all inquest verdicts by country and Region, deaths registered between 2010 to 2014
.xls (30.7 kB)Between 2001 and 2010, there were large year-on-year increases in the number of narrative conclusions returned by coroners in England and Wales (Reference Table 15). The number of hard-to-code narrative conclusions registered in England in 2010 (3,170) was almost 30 times the number registered in 2001 (107). In Wales, the number increased from just 2 in 2001 to 147 in 2010. This was a concern as it may have been masking the true number of suicides that occurred during this period.
Following our improvements in the coding of narrative conclusions in 2011, the number of hard-to-code conclusions decreased between 2010 and 2011 by 46% in England (from 3,170 to 1,727) and by 49% in Wales (from 147 to 75). However, since 2012, the number of hard-to-code narrative conclusions has begun to rise, and in 2014 they had risen to 2,252 in England and more than doubled in Wales, from 91 in 2013 to 203 in 2014.
There is considerable variation in the use of narrative conclusions between coroners and therefore between regions (see Table 2). This leads to concerns that the use of narrative conclusions could be distorting local area suicide statistics. Carroll, et al (2011) found that in the 10 English coroners’ jurisdictions where the highest proportion of “other” verdicts were given, the incidence of suicide decreased by 16% between 2001 to 2002 and 2008 to 2009, whereas it did not change in areas served by the 10 coroners who used narratives the least.
The North East had the lowest number of hard-to-code narrative conclusions; 62 in 2014. These accounted for 2.7% of all inquests, the lowest percentage across all regions of England and Wales. In contrast, the North East had the highest suicide rate.
The West Midlands saw the biggest increase in suicides of all English regions in 2014. This region also saw the largest decrease in hard-to-code narrative conclusions. It is possible that the reason the suicide rate increased is due to coroners in this area not giving a narrative conclusion as often, or giving clearer narrative conclusions, making the death easier to code as a suicide or otherwise.
We undertook an analysis to assess the impact of narrative conclusions on suicide rates in England and Wales in 2011 (Hill and Cook, 2011). Simulated age-standardised suicide rates were calculated for the years 2001 to 2009 using 2 different assumptions:
scenario 1: suicide rates were calculated assuming all deaths where a hard-to-code narrative conclusion meant that the death been coded as an accidental hanging (ICD-10 codes W75 to W76) or accidental poisoning (ICD-10 codes X40 to X49) were intentional self-harm
scenario 2: suicide rates were calculated assuming that half of these deaths were intentional self-harm
The results showed that, between 2001 and 2009, there were no statistically significant differences between the published and simulated suicide rates at national level. These analyses have been repeated annually for deaths registered in 2010 onwards (Suicides in the United Kingdom, 2012, 2013, 2014, 2015). We have has now repeated the Scenario 1 analysis using the latest figures for regions of England, and for Wales (see Background note 6) using the new suicide definition. The change to the definition has resulted in the back series being revised to include 10- to-14-year-olds. For the purposes of the simulation, deaths from undetermined intent in children aged 10 to 14 were also included.
Figure 8 shows the results of adding all accidental hangings and poisonings with a hard-to-code narrative conclusion (ages 10 and over) and deaths from undetermined intent in 10- to-14-year-olds, to existing suicide figures (Scenario 1), for England and Wales between 2001 and 2014. Reference Table 16 also provides simulated suicide rates for English regions. As expected, the simulated suicide rates are slightly higher than the standard suicide rates. In 2013 and 2014, the simulated rates were significantly higher than the standard rates in England at national level for all persons. No other significant differences were found for scenario 1. Scenario 1 can be considered a worst-case scenario, as it is unlikely that all of the extra deaths which were included were actually suicides. Scenario 2 (where half of all accidental hangings and poisonings with a hard-to-code narrative conclusion were added) is more realistic, and here, no significant differences were observed between the simulated rates and the standard suicide rates.
Figure 8: Scenario 1 simulated suicide rate, deaths registered between 2001 and 2014
England and Wales
Source: Office for National Statistics
Notes:
- Suicide rates were calculated assuming all deaths where a hard-to-code narrative verdict meant that the death been coded as an accidental hanging (ICD-10 codes W75-W76) or accidental poisoning (ICD-10 codes X40-X49) were intentional self-harm. These deaths were added to those already included in the National Statistics suicide definition, and suicide rates were recalculated.
- Figures are for persons aged 10 years and over.
- Age-standardised suicide rates per 100,000 population, standardised to the 2013 European Standard Population. Age-standardised rates are used to allow comparison between populations which may contain different proportions of people of different ages.
- Figures exclude deaths of non-residents.
- Based of boundaries as of November 2015.
- Figures are for deaths registered, rather than deaths occurring in each calendar year. Due to the length of time it takes to complete a coroner’s inquest, it can take months or even years for a suicide to be registered.
Download this chart Figure 8: Scenario 1 simulated suicide rate, deaths registered between 2001 and 2014
Image .csv .xls9. Use of the statistics
Suicide statistics are important for monitoring trends in deaths resulting from self-harm. These statistics provide an important indicator of the wider mental health of the nation. They are used to inform policy, planning and research in both the public and private sector, enabling policy makers and support services to target their resources most effectively. The main users include the Department of Health and devolved health administrations, public health organisations, local and health authorities, academics and charity organisations.
For example, Barr et al (2012) used our suicide data to carry out a time trend analysis in England which suggested that the recent economic downturn in the UK could have lead to an increase in suicides. They found that local areas with greater rises in unemployment also experienced larger increases in male suicides.
Back to table of contents10. Policy context
A review by the Samaritans in 2012 emphasised that middle-aged men in lower socio-economic groups are at particularly high risk of suicide. They pointed to evidence that suicidal behaviour results from the interaction of complex factors such as unemployment and economic hardship, lack of close social and family relationships, the influence of a historical culture of masculinity, personal crises such as divorce, as well as a general “dip” in subjective well-being among people in their mid-years, compared with both younger and older people. This has been reflected in the suicide prevention strategies produced by the UK’s constituent countries which place emphasis on a targeted approach for at-risk groups.
Each constituent country of the UK has a suicide prevention strategy in place which aims to identify risk factors, take action via cross-sector organisations, and reduce suicide rates.
In September 2012, the Department of Health launched “Preventing Suicide in England: a cross-government outcomes strategy to save lives”. This strategy aims to reduce the suicide rate and improve support for those bereaved by suicide and was informed by an earlier consultation on preventing suicide in England. The strategy outlines 6 areas for action including: reducing the risk of suicide in main high-risk groups (for example, people in the care of mental health services, people with a history of self-harm, people in contact with the criminal justice system and men aged under 50); reducing access to the means of suicide; and supporting research, data collection and monitoring. Public Health England have recently launched a new “finger-tip” tool to aid suicide prevention and to allow local authorities to monitor trends in their area.
The Welsh Assembly Government published “Talk to Me: The National Action Plan to Reduce Suicide and Self Harm in Wales, 2009–2014” with a follow-up strategy called “Talk to Me 2” launched in July 2015. It aims to promote, co-ordinate and support plans and programmes for the prevention of suicidal behaviours and self-harm via collaborative work across statutory and third sector organisations. There are 6 objectives: awareness raising, improving responses to crisis and early intervention, providing information and support for the bereaved, supporting the media in responsible reporting, reducing access to the means of suicide and monitoring systems to improve understanding of suicide and self-harm.
In Scotland, following a 10-year “Choose Life” suicide prevention strategy and action plan launched in 2002, a summary of progress to date and recommendations for the final phase of the strategy were reported in “Refreshing the National Strategy and Action Plan to Prevent Suicide in Scotland”, published by the Scottish Government in 2010. In 2013, the “Scottish Government: Suicide Prevention Strategy 2013–2016” was launched. The main themes are: responding to people in distress, talking about suicide, improving the NHS response to suicide, developing the evidence base and supporting change and improvement.
In 2006, the Department of Health, Social Services and Public Safety in Northern Ireland (DHSSPS) published “Protect Life: A Shared Vision – The Northern Ireland Suicide Prevention Strategy and Action Plan, 2006–2011”. The strategy included 2 targets: to obtain a 10% reduction in the overall suicide rate by 2008 and reduce the overall suicide rate by a further 5% by 2011. The aims, objectives and approach are similar to those in other UK countries and specific actions focusing on both the general population and the target population were also highlighted. In 2012, the strategy was refreshed to cover the period 2011 to March 2014 and the DHSSPS published an evaluation of the original “Protect Life” strategy. A new “Protect Life” strategy is currently under development and is expected to be issued for consultation in 2016. The previous strategy remains current in the mean time.
People with mental illness have a higher suicide risk than the general population (Windfur and Kapur, 2011). A “National Confidential Inquiry into Suicide and Homicide by People with Mental Illness” was set up to help reduce this risk. The recommendations of this project could assist health professionals and policymakers improve patient safety and reduce the suicide risk of individuals who are in contact with mental health services. The most recent annual report from the Confidential Inquiry was published in July 2015.
Back to table of contents11. Comparison with other countries
It is not always possible to compare UK suicide statistics with those of other countries because of differences in the way suicide is defined and recorded. For example, deaths from injuries and poisonings of undetermined intent are included in UK suicide figures (as well as deaths from intentional self-harm). However, many other countries, including Canada, United States and France, use a narrower definition that does not include deaths from injuries and poisonings of undetermined intent. The Australian Bureau of Statistics uses a similar definition to these countries, but does not routinely report on suicides of children under the age of 15.
Suicide figures published by Eurostat for European countries are based on a broadly comparable definition of deaths from intentional self-harm only. These are available for all ages and rates for males and females are age-standardised to the European Standard Population. The UK suicide rate is quite low compared to other European countries. Age-specific (or “crude”) rates for particular age groups are also available.
_(per_100_000_inhabitants)_YB15.png)
Suicide figures published by the World Health Organization (WHO) use official figures made available to WHO by its member states. These are based on actual death certificates signed by legally authorised personnel, usually doctors and, to a lesser extent, police officers. Although they are not all directly comparable or timely, the suicide figures published by the WHO give an overall perspective of the extent of suicide deaths around the world.
Back to table of contents12. Methodological changes
Suicide definition
The previous National Statistics definition of suicide includes deaths from intentional self-harm (where a coroner has given a suicide conclusion or made it clear in the narrative conclusion that the deceased intended to kill themselves) and events of undetermined intent (mainly deaths where a coroner has given an open conclusion) in people aged 15 and over.
Causes of death are coded using the International Classification of Diseases, Tenth Revision (ICD-10) from 2001 and Ninth Revision (ICD-9) from 1981 to 2000 (World Health Organisation). The codes used are:
International Classification of Diseases, Tenth Revision (ICD-10) from 2001 and Ninth Revision (ICD-9) from 1981 to 2000 (World Health Organisation)
| ICD-9 codes | ICD-10 codes | Description |
| E950-E959 | X60-X84 | Intentional self-harm |
| E980-E9891,2 | Y10-Y342,3 | Injury/poisoning of undetermined intent |
| Y87.0 / Y87.24 | Sequelae of intentional self-harm / event of undetermined intent | |
| Source: Office for National Statistics | ||
| Notes: | ||
| 1. Excluding E988.8 for England and Wales. | ||
| 2. Excluding injury/poisoning of undetermined intent for persons aged 10-14. These deaths are included in the simulations in Reference Tables 13 and 14. | ||
| 3. Excluding Y33.9 where the coroner's verdict was pending in England and Wales for the years 2001-2006. | ||
| 4. Y87.0 and Y87.2 are not included for England and Wales. | ||
Download this table International Classification of Diseases, Tenth Revision (ICD-10) from 2001 and Ninth Revision (ICD-9) from 1981 to 2000 (World Health Organisation)
.xls (34.8 kB)In 2016, the suicide definition was revised to include deaths from intentional self-harm in children aged 10 to 14. Previously we did not include suicides in young children due to the very small numbers involved (see Table 3). However, after discussions with Public Health England and the constituent countries of the UK, it was decided that it was appropriate to include them. Deaths from an event of undetermined intent in 10- to- 14-year-olds are not included in these suicide statistics, because although for older teenagers and adults we assume that in these deaths the harm was self-inflicted, for younger children it is not clear whether this assumption is appropriate.
The number of deaths from intentional self-harm in 10- to 14-year-olds is very low, as is the number of deaths where the intent was undetermined. There has been some debate surrounding the inclusion of deaths of undetermined intent in this younger age group, and the definition may be subject to change in the future. We welcome feedback on the revised suicide definition.
Research has been conducted and it was found that the inclusion of these deaths has not had a significant impact on the overall age-standardised rates. Suicide rates calculated using this new definition are around 6% lower than the previous suicide rates. The full back-series of data from 1981 has been revised using this new definition, which allows accurate comparisons to be made over time.
Samaritans have produced a useful report explaining how to interpret suicide statistics including the difference between crude rates and age-standardised rates.
Table 3: Number of potential child suicides by sex, intent, United Kingdom, deaths registered 2001-2014
| Year | Intentional self-harm | Undetermined intent | Total suicides | ||
| Boys | Girls | Boys | Girls | ||
| 2001 | 4 | 3 | 4 | 4 | 15 |
| 2002 | 5 | 5 | 2 | 4 | 16 |
| 2003 | 2 | 2 | 7 | 6 | 17 |
| 2004 | 4 | 1 | 5 | 4 | 14 |
| 2005 | 4 | 4 | 10 | 4 | 22 |
| 2006 | 4 | 3 | 5 | 2 | 14 |
| 2007 | 10 | 4 | 5 | 6 | 25 |
| 2008 | 6 | 6 | 2 | 6 | 20 |
| 2009 | 4 | 3 | 3 | 3 | 13 |
| 2010 | 1 | 3 | 6 | 3 | 13 |
| 2011 | 8 | 4 | 8 | 1 | 21 |
| 2012 | 10 | 2 | 6 | 6 | 24 |
| 2013 | 5 | 4 | 7 | 1 | 17 |
| 2014 | 7 | 6 | 6 | 5 | 24 |
| Source: Office for National Statistics, National Records of Scotland and Northern Ireland Statistics and Research Agency | |||||
| Notes: | |||||
| 1. The National Statistics definition of suicide is given in the 'Suicide definition' section. | |||||
| 2. Figures are for persons aged 10 years and over. | |||||
| 3. Figures include deaths of non-residents. | |||||
| 4. Figures are for deaths registered, rather than deaths occurring in each calendar year. Due to the length of time it takes to complete a coroner’s inquest, it can take months or even years for a suicide to be registered. | |||||
Download this table Table 3: Number of potential child suicides by sex, intent, United Kingdom, deaths registered 2001-2014
.xls (55.8 kB)Coding changes
In January 2014, an update to the ICD-10 software (IRIS) was introduced. Analysis suggests that this change has not had a significant impact on the coding of suicides and events of undetermined intent. More information about coding changes and their impact on mortality statistics is available on our website.
Several changes were introduced in 2011 that could have affected suicide statistics. In respect of narrative conclusions, an advice note was issued to coroners explaining what information is required in a narrative conclusion to help us code cause of death using the International Classification of Diseases. Also, additional guidance was given to our coding team to improve coding of narrative conclusions. Finally, an update of the ICD-10 software (version 2010) was introduced in the UK, which included a rule change that affected deaths coded as an event of undetermined intent. The switch to ICD-10 version 2010 resulted in a 0.2% increase in the number of deaths coded as suicide in England and Wales. These changes were outlined in more detail in the statistical bulletin Suicides in the UK, 2011, which is available on our website.
Back to table of contents13. Where to go for help
If you are struggling to cope, please call Samaritans on 08457 90 90 90 (UK) 1850 60 90 90 (ROI), email jo@samaritans.org, or visit the Samaritans website to find details of the nearest branch. Samaritans is available round the clock, every single day of the year, providing a safe place for anyone struggling to cope, whoever they are, however they feel, whatever life has done to them.
Resources are also available online: “U can Cope” includes a film and resources that are designed for people in distress and those trying to support them, to instil hope, promote appropriate self-help and inform people regarding useful strategies and how they can access help and support; “Staying safe if you’re not sure life’s worth living” includes practical, compassionate advice and many useful links for people in distress.
Next publication:
January/February 2017
Issued by: Office for National Statistics, Government Buildings, Cardiff Road, Newport NP10 8XG
Back to table of contents