1. Main findings
There were an estimated 24,000 excess winter deaths in England and Wales in 2011/12 – an 8 per cent reduction compared with the previous winter
As in previous years, there were more excess winter deaths in females than in males in 2011/12
Between 2010/11 and 2011/12 male excess winter deaths decreased from 11,270 to 10,700, and female deaths from 14,810 to 13,300
The majority of deaths occurred among those aged 75 and over; there were 19,500 excess winter deaths in this age group in 2011/12 compared with 4,500 in the under 75-year-olds
The excess winter mortality index was highest in London in 2011/12, whereas in 2010/11 it was highest in Wales. Wales had one of the lowest levels of excess winter mortality last winter, second only to the North East of England
2. Summary
In common with other countries, in England and Wales more people die in the winter than in the summer. This statistical bulletin presents provisional figures of excess winter deaths (also referred to as excess winter mortality – EWM) in England and Wales for the winter period 2011/12, and final figures for the winter period 2010/11.
Historical trends from 1950/51 onwards are also presented for comparison. Figures are presented by sex, age, region and cause of death. Figures on temperature and influenza incidence are also provided to add context to the mortality figures.
There were an estimated 24,000 excess winter deaths in England and Wales in 2011/12 – an 8 per cent reduction compared with the previous winter. As in previous years, there were more excess winter deaths in females than in males in 2011/12 (13,300 compared with 10,700). In common with other years, in 2011/12 the majority of deaths occurred among those aged 75 and over. There were 19,500 excess winter deaths in this age group last winter compared with 4,500 in the under 75-year-olds.
Unusually, mortality peaked in February, which is likely to be related to increased influenza, as the rise in deaths coincided with the peak in the influenza-like illness rate. In addition, February was the coldest winter month and the increased deaths closely followed a period of colder than average temperatures.
Back to table of contents3. Method for calculating excess winter mortality
Excess deaths
The ONS standard method defines the winter period as December to March, and compares the number of deaths that occurred in this winter period with the average number of deaths occurring in the preceding August to November and the following April to July:
EWM = winter deaths - average non-winter deaths
This produces the number of excess winter deaths, which is then rounded to the nearest 10 for final data and to the nearest 100 for provisional data.
Excess winter mortality index
The EWM index is calculated so that comparisons can be made between sexes, age groups and regions, and is calculated as the number of excess winter deaths divided by the average non-winter deaths, expressed as a percentage:
EWM Index = (EWM / average non-winter deaths) x 100
The EWM index is presented with 95 per cent confidence intervals, which are calculated as:
EWM index ± 1.96 x (EWM Index / √ EWM)
More details about how EWM is calculated are available in Background notes 2 and 3.
Back to table of contents4. Results
EWM in England and Wales
In England and Wales there were an estimated 24,000 more deaths in the winter period of 2011/12 than in the non-winter period. This equates to around 15 per cent more deaths in the winter period, compared with the non-winter period. There was an 8 per cent decrease in the number of excess winter deaths in 2011/12 compared with the previous winter of 2010/11 when there were 26,080 excess winter deaths.
The highest excess winter mortality of recent years was seen in 2008/09 when there were 36,450 excess winter deaths. The number of excess winter deaths in the most recent winter was 34 per cent lower than the level seen in 2008/09 and was the lowest number of excess winter deaths since 2006/07.
Figure 1. Excess winter deaths by year and five-year central moving average, 1950/51–2011/12
England and Wales
Source: Office for National Statistics
Notes:
- EWM figures are based on deaths occurring in each period.
- Data include non-residents who died in England or Wales.
Download this chart Figure 1. Excess winter deaths by year and five-year central moving average, 1950/51–2011/12
Image .csv .xlsHistorical trends in EWM in England and Wales are presented in Figure 1 for deaths occurring between 1950/51 and 2011/12. A five-year moving average is also presented to smooth out any short-term fluctuations. This shows a sharp drop in EWM occurred between 1960/61 and 1965/66, followed by a slight increase and another sharp drop between 1969/70 and 1972/73. The EWM levels then followed a gradual decrease, albeit with some fluctuations from 1973/74 up until 1996/97.
There were relatively high numbers of deaths in the winters of 1998/99 and 1999/2000, but deaths dropped sharply the following winter. Since then the downward trend seems to have levelled off, with an average of 26,400 excess winter deaths each year between 2000/01 and 2011/12.
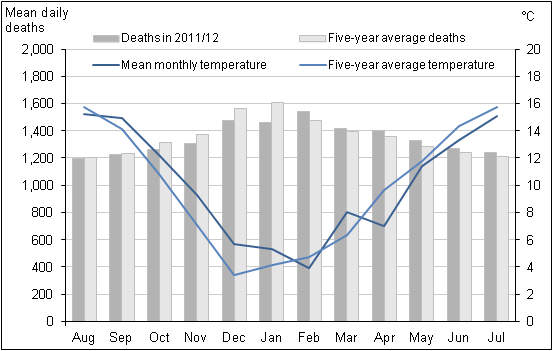
Figure 2. Mean number of daily deaths each month and mean monthly temperatures, August 2011 to July 2012
England and Wales
Source: Office for National Statistics and The Met Office
Notes:
- The mean number of daily deaths is based on deaths occurring in each month. Numbers of deaths from January to July 2012 are provisional, and have been adjusted to take account of late registrations, see methods section.
- Five-year averages for each month are calculated using data from the previous five years, excluding the current year.
- Data include non-residents who died in England or Wales.
Download this image Figure 2. Mean number of daily deaths each month and mean monthly temperatures, August 2011 to July 2012
.png (23.4 kB) .xls (41.0 kB)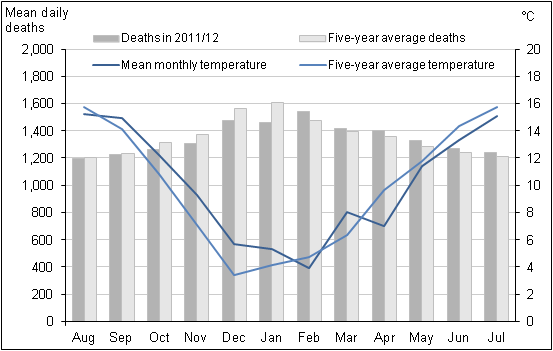
When monthly mortality data for 2011/12 were compared with the five-year average of deaths occurring between 2006/07 and 2010/11 in the relevant months (Figure 2), the number of deaths were lower than average for the period August 2011 to January 2012, and higher than average between February and July 2012.
After two cold winters, the mean temperatures for months in winter 2011/12 were warmer than the five-year average, with the exception of February, giving us the warmest winter since 2006/07. The winter of 2011/12 also saw the lowest number of excess winter deaths since 2006/07. Conversely, mean temperatures in the four non-winter months following winter 2011/12 were lower than the five year average.
Overall, deaths in January 2012 were about 9 per cent lower than average. This might be explained by a higher than average temperature throughout January and a low rate of influenza-like illness (ILI – measured using the Royal College of General Practitioners influenza-like illness consultation rate).
Unusually deaths peaked in February 2012, whereas normally the highest mortality is seen in January. There was a period from 12 February to 2 March when daily deaths exceeded the five year average by more than 70 deaths per day.
This higher mortality is likely to be related to increased influenza, as this peak in deaths coincided with the peak in the ILI rate (The Royal College of General Practitioners Research and Surveillance Centre, 2012). In addition, February was the coldest winter month and the increase in deaths closely followed a period of colder than average temperatures from the 27 January to 13 February 2012 (Met Office Hadley Centre, 2012). This lag effect is well recognised in the literature (Donaldson and Keatinge, 1997).
The numbers of deaths by month, sex and age group for regions of England and Wales in 2011 are available to download from the ONS website (579.5 Kb Excel sheet).
Figure 3. Excess winter deaths and average winter temperature, 1999/2000–2011/12
England and Wales
Source: Office for National Statistics and The Met Office
Notes:
- EWM figures are based on deaths occurring in each period.
- Mortality data include non-residents who died in England or Wales.
- Mean winter temperature is calculated using average monthly temperatures from December to March.
Download this chart Figure 3. Excess winter deaths and average winter temperature, 1999/2000–2011/12
Image .csv .xlsFigure 3 shows that there is no clear relationship between the average winter temperature and the level of excess winter mortality, as the number of excess winter deaths in 2011/12 was only slightly lower than the previous two years, despite the overall winter temperature being much milder.
According to the English Housing Survey in 2010 a greater proportion of homes had cavity wall insulation, modern central heating and double-glazing compared with 1996, meaning homes are becoming more energy efficient. Also, a greater proportion of homes had loft insulation in 2010, compared with 2003 (Department for Communities and Local Government, 2012).
This is may be related to the Carbon Emissions Reduction Target (CERT) which requires all domestic energy suppliers with a customer base in excess of 250,000 customers to make savings in the amount of CO2 emitted by householders through professionally installed insulation measures (The Department of Energy and Climate Change, 2012).
Between April 2008 and July 2012 it has been reported that this scheme enabled over 2 million British homes to get cavity wall and loft insulation installed. (Ofgem, 2012)
These improvements to homes may have altered the relationship between the weather outdoors and winter mortality.
Figure 4. Weekly deaths from all causes and RCGP Influenza-like Illness (ILI) consultation rates per 100,000 population, 1999-2012
England and Wales
Source: Office for National Statistics and The Royal College of General Practitioners Research and Surveillance Centre
Notes:
- Mortality data are based on deaths occurring each week. Numbers of deaths from January to July 2011 are provisional,and have been adjusted to take account of late registrations (see methods section).
- Mortality data include non-residents who died in England or Wales.
Download this chart Figure 4. Weekly deaths from all causes and RCGP Influenza-like Illness (ILI) consultation rates per 100,000 population, 1999-2012
Image .csv .xlsThe last influenza epidemic occurred in 1999/2000 and was associated with a high level of excess winter mortality, as illustrated in Figure 4. In contrast, the ILI activity in the winter of 2011/12 was the lowest on record. It is also one of only three winter periods since 1988/89 (along with 2001/02 and 2002/03) that has not crossed the baseline seasonal activity threshold (See Background note 4).
The spike in ILI activity associated with the H1N1 ‘Swine flu’ pandemic in summer 2009 can also clearly be seen on the graph and, unusually, it coincides with a period of relatively low mortality. The H1N1 ‘Swine flu’ virus was the predominant strain of influenza in the winter of 2010/11. However, very few influenza A (H1N1) positive specimens were detected last winter, and influenza A (H3N2) was the dominant circulating virus for the 2011/12 season with some influenza B (Health Protection Agency, 2012a).
The peak in the rate of ILI occurred at a later point in the 2011/12 winter season than in previous years. Influenza activity peaked in mid-February (week 7) – around two weeks after temperatures began to fall.
Given the exceptionally low levels of ILI and mild winter temperatures seen in 2011/12, we might have expected even lower levels of excess winter deaths. However, Figure 1 suggests that levels of excess winter mortality may be reaching a plateau.
EWM by sex and age
In 2011/12 there were 10,700 excess winter deaths in males and 13,300 excess winter deaths in females. The majority of these deaths occurred among those aged 75 and over in both sexes, with females aged 85 and over having the greatest number of excess winter deaths.
A higher proportion of the female population are aged 75 and over (9.2 per cent compared with 6.4 per cent of males in 2011). In people aged over 85, women outnumber men two to one. (ONS, 2012a) This may wholly, or partially, explain the higher number of excess winter deaths in women.
In 2011/12 EWM decreased significantly compared with 2010/11 for both males and females aged under 75. The number of excess winter deaths in males under 75 decreased by 30 per cent from 3,860 in 2010/11 to 2,700 in 2011/12. For females under 75, excess winter deaths decreased by 36 per cent from 2,830 in 2010/11 to 1,800 in 2011/12.
The pattern in EWM for the people aged 75 and over was not as clear. There was no significant difference in EWM in males aged 75 to 84 years between winter 2010/11 and winter 2011/12. However, excess winter deaths in 2011/12 for males aged 85 and over were significantly higher than the previous winter. Females aged 75 to 84 years experienced a significant decrease in EWM in 2011/12 compared with 2010/11. However, there was no significant change in EWM for females aged 85 and over between 2010/11 and 2011/12.
Figure 5a. Excess winter mortality by sex and age group, 2009/10–2011/12
Males, England and Wales
Source: Office for National Statistics
Notes:
- Figures are based on deaths occurring in each period.
- Data include non-residents who died in England or Wales.
Download this chart Figure 5a. Excess winter mortality by sex and age group, 2009/10–2011/12
Image .csv .xls
Figure 5b. Excess winter mortality by sex and age group, 2009/10–2011/12
Females, England and Wales
Source: Office for National Statistics
Notes:
- Figures are based on deaths occurring in each period.
- Data include non-residents who died in England or Wales.
Download this chart Figure 5b. Excess winter mortality by sex and age group, 2009/10–2011/12
Image .csv .xlsEWM by region
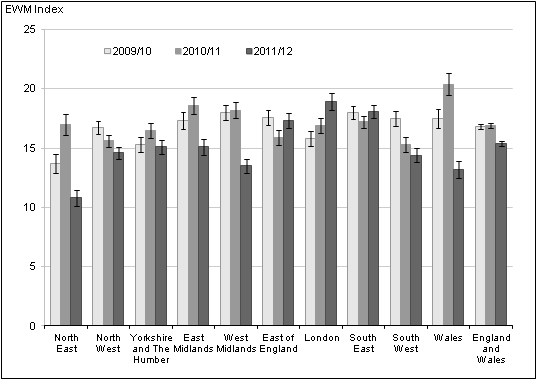
Figure 6 presents the EWM index and confidence limits for English regions and Wales for the last three winters. More detailed data showing the number of excess winter deaths and the EWM index by age and region of England, and Wales from 1991/92 to 2011/12 is available in Reference Table 2.
For England and Wales overall, excess winter mortality decreased from the levels seen in the previous year, but this pattern varied between the regions of England, and Wales. Within England there was a decrease in all but three regions. The regions of London, the South East and the East of England showed an increase in EWM between 2010/11 and 2011/12, with the largest percentage point increase occurring in London (2.0 percentage points higher). London also had the highest EWM index in 2011/12, with 18.9 per cent more deaths in winter compared with the non-winter period, compared with an average of 15.4 per cent for England and Wales.
In 2011/12, the area with the largest percentage point decrease was Wales (7.2 percentage points lower than 2010/11). Wales had the highest EWM index in 2010/11, but had the second lowest in 2011/12. The North East had a percentage point decrease of 6.2 and moved from having the fifth highest EWM in 2010/11 to having the lowest in 2011/12.
Reference Table 2 shows that the increase in London occurred exclusively in people aged 85 and over. Furthermore, people aged 85 and over in London had the highest EWM index of any age group in any region. The Health Protection Agency reported that London had the highest level of influenza-like illness (ILI) within England and Wales (Health Protection Agency, 2012a), which may partly explain why this region also showed the highest level of excess winter mortality.
Overall there were substantial year-on-year changes in the rank order of Wales and the regions of England for EWM. For example, the North East had the lowest EWM index in the winter of 2009/10, in 2010/11 was ranked mid-table and then in 2011/12 has moved back to having the lowest EWM. Research examining EWM among the elderly found little evidence for any consistent variation by geographical region within the UK (Wilkinson et al, 2004).
Figure 6. Excess winter mortality for regions of England, and Wales, 2009/10–2011/12
Source: Office for National Statistics
Notes:
- Figures are based on deaths occurring in each period.
- Figures for English regions and Wales include deaths of persons usually resident in each area, based on boundaries as of August 2012. Figures for England and Wales combined also include deaths of non-residents.
Download this image Figure 6. Excess winter mortality for regions of England, and Wales, 2009/10–2011/12
.png (13.6 kB) .xls (55.8 kB)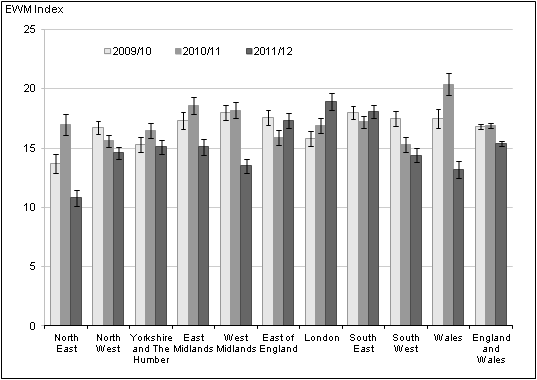
EWM by Local Authority
Figures showing excess winter deaths, the EWM index and confidence limits for local authorities in England and Wales have been published alongside the excess winter mortality report for the first time this year (previously this data was only available on request). A consistent time series of data from 1991/92 to 2010/11, based on local authority boundaries as of August 2012, is available to download from the ONS website (579.5 Kb Excel sheet).
Local area EWM data is not available for the most recent winter (2011/12) as this data is provisional, and the estimation methods used to produce national and regional figures are not reliable for small geographic areas.
The local authority with the lowest EWM index in 2010/11 was Tamworth; it has also had relatively low EWM over the last five years. The area with the highest EWM index in 2010/11 was Bridgend where about 36 per cent more deaths occurred in winter than in the non-winter period. The City of London and Isles of Scilly have been excluded as numbers are too small to allow meaningful comparisons.
It is important to note that, EWM figures for local areas tend to be quite variable from one year to the next and there is no consistent pattern in EWM for any of the local authorities in England or Wales. The majority of local authorities that had the ten lowest EWM indexes in 2010/11 have previously been ranked towards the middle of the table of local authorities and it is a similar story for the ten areas that currently have the highest EWM indices.
Final EWM in 2010/11 by underlying cause of death
Information presented earlier in this bulletin refers to provisional EWM figures for 2011/12; this section refers to final 2010/11 EWM figures by underlying cause of death. Table 1 shows the number of excess winter deaths and the EWM index by age group for circulatory diseases, respiratory diseases, injury and poisoning and dementia and Alzheimer’s disease, in England and Wales for the winters of 2008/09 to 2010/11.
Despite EWM increasing from 2009/10 to 2010/11 not all of the causes examined showed an increase in excess winter mortality. Respiratory diseases caused the largest number of excess winter deaths in 2010/11, accounting for 39 per cent of all excess winter deaths. Moreover, respiratory disease had the largest seasonal effect of all of the causes included in Table 1, as this cause had the highest EWM index for all three of the winters that were analysed.
In 2010/11, 51 per cent more people died from respiratory diseases in the winter compared with the non-winter period, which is significantly higher than in 2009/10 (43 per cent more deaths in the winter compared with the non-winter period), but significantly lower than 2008/09 (73 per cent more deaths in winter).
The majority of excess winter deaths from respiratory diseases occurred in people aged 75 and over. However, the EWM index shows that a greater seasonal effect is sometimes seen in younger age groups. In 2010/11 this was particularly apparent in people aged under 65 years, when 94 per cent more people died from respiratory diseases in the winter compared with the non-winter period.
In 2009/10 circulatory diseases caused the most number of excess winter deaths compared with other causes, but in 2010/11, circulatory diseases caused the second highest number of excess winter deaths. Deaths from circulatory disease still accounted for 26 per cent of all excess winter deaths in 2010/11, although this figure was about 29 per cent lower than in 2009/10 and about 45 per cent lower than in 2008/09.
Unusually, in 2010/11 there were more excess winter deaths of people under 65 years of age than there were for people aged 65 to 74, whereas excess winter mortality from circulatory diseases normally increases with age.
Dementia and Alzheimer’s disease was one of the leading causes of death in 2011 (ONS, 2012b), and also displays marked seasonal effects. In 2010/11 there were 4,110 excess winter deaths from this cause, 70 per cent higher than in 2009/10, and 33 per cent higher than in 2008/09. The number of excess winter deaths from dementia and Alzheimer’s disease were much higher in people aged 75 and over, with over 12 times as many deaths as those aged under 75.
However, the greatest seasonal effect was seen in people under 75. The reasons for the seasonal pattern in deaths from dementia and Alzheimer's disease are not clear. However, it may be related to the greater vulnerability of people with these conditions to respiratory diseases, difficulties with self-care, and falls, all of which may be more important in winter months.
Injury and poisoning deaths include accidental falls which can be affected by wintry conditions – for example, icy pavements. However, external causes usually only account for a small proportion of all excess winter deaths. In winter 2010/11 the number of excess winter deaths from injury and poisoning in people aged 75 and over fell compared with 2009/10. However, in the younger age groups (75 years and under) excess winter mortality from injury and poisoning increased in 2010/11 compared with 2009/10.
A more detailed version of Table 1 by sex and age group is available to download from the ONS website (579.5 Kb Excel sheet).
Excess winter mortality by age group and underlying cause of death
| England and Wales | |||||||
| Cause | Age | 2008/09 | 2009/10 | 2010/11 | |||
| Excess winter deaths | EWM Index | Excess winter deaths | EWM Index | Excess winter deaths | EWM Index | ||
| Circulatory diseases (ICD-10 I00–I99) | 0–64 | 840 | 14.6 | 620 | 10.8 | 850 | 15.9 |
| 65–74 | 1,300 | 17.9 | 1,170 | 16.7 | 810 | 11.9 | |
| 75–84 | 4,330 | 26.1 | 3,150 | 20.0 | 2,300 | 15.4 | |
| 85+ | 6,000 | 28.8 | 4,670 | 22.5 | 2,890 | 14.5 | |
| All ages | 12,470 | 24.7 | 9,610 | 19.5 | 6,850 | 14.6 | |
| Respiratory diseases (ICD-10 J00–J99) | 0–64 | 1,130 | 74.3 | 470 | 28.3 | 1,470 | 94.4 |
| 65–74 | 1,520 | 55.9 | 860 | 31.4 | 1,410 | 52.1 | |
| 75–84 | 4,260 | 67.3 | 2,540 | 41.9 | 2,670 | 41.9 | |
| 85+ | 7,110 | 83.3 | 4,290 | 50.0 | 4,560 | 50.2 | |
| All ages | 14,020 | 73.4 | 8,160 | 42.9 | 10,110 | 51.3 | |
| Dementia and Alzheimer's disease (ICD-10 F01, F03, G30) | 0–64 | 50 | 71.6 | 30 | 41.8 | 60 | 67.6 |
| 65–74 | 180 | 56.2 | 140 | 42.8 | 240 | 56.9 | |
| 75–84 | 870 | 44.3 | 690 | 34.3 | 1,080 | 39.3 | |
| 85+ | 1,990 | 46.9 | 1,570 | 33.9 | 2,730 | 43.3 | |
| All ages | 3,090 | 46.8 | 2,420 | 34.5 | 4,110 | 43 | |
| Injury and poisoning (ICD-10 V01–Y89, U50.9) | 0–64 | -30 | -1.0 | -10 | -0.5 | 120 | 4.2 |
| 65–74 | 80 | 21.6 | 50 | 11.3 | 90 | 20.7 | |
| 75–84 | 230 | 30.6 | 160 | 21.5 | 100 | 12.7 | |
| 85+ | 320 | 27.8 | 340 | 29.6 | 200 | 17.6 | |
| All ages | 600 | 11.9 | 530 | 10.6 | 500 | 9.8 | |
| All causes | 0–64 | 2,950 | 10.9 | 2,100 | 7.8 | 3,630 | 13.9 |
| 65–74 | 3,960 | 15.6 | 2,620 | 10.3 | 3,050 | 12 | |
| 75–84 | 11,380 | 24.0 | 7,830 | 16.9 | 7,350 | 15.9 | |
| 85+ | 18,160 | 33.6 | 13,260 | 24.3 | 12,040 | 21.3 | |
| All ages | 36,450 | 23.7 | 25,810 | 16.8 | 26,080 | 16.9 | |
| Source: Office for National Statistics | |||||||
| Notes: | |||||||
| 1. Underlying cause of death is defined using the International Classification of Diseases, Tenth Revision (ICD 10). From January 2011 ONS has used an updated version of ICD 10, which will affect the assignment of underlying cause of death for deaths registered after this date. More details about the impact of this change are available on the ONS website: www.ons.gov.uk/ons/rel/subnational-health3/results-of-the-icd-10-v2010-bridge-coding-study--england-and-wales--2009/2009/statistical-bulletin--results-of-the-bridge-coding-study.pdf | |||||||
| 2. Figures are based on deaths occurring in each period. | |||||||
| 3. Figures for England and Wales include deaths of non-residents. | |||||||
Download this table Excess winter mortality by age group and underlying cause of death
.xls (39.4 kB)5. Causes of excess winter mortality
A study by Healy (2003) showed that EWM varied widely within Europe. The results show that countries with low winter temperatures in Scandinavia and Northern Europe, such as Finland and Germany had very low rates of EWM. Conversely, countries with very mild winter temperatures in Southern Europe such as Portugal and Spain had very high rates of EWM. England and Wales both have higher than average EWM and exhibit high variation in seasonal mortality.
There are many reasons why countries with milder winter climates have such a high level of winter mortality. For example, people who live in countries with warmer winters tend to take fewer precautions against the cold. The Eurowinter group (1997) reported that compared with people living in countries with cold winters, those from warmer countries were less likely to wear warm protective clothing in cold weather.
Countries with milder winters also tend to have homes with poorer thermal efficiency (for example, fewer homes have cavity wall insulation and double glazing), which makes it harder to keep homes warm during the winter (Healy, 2003). It has been shown that low indoor temperature is associated with higher EWM from cardiovascular disease in England (Wilkinson et al., 2001).
Although EWM is associated with low temperatures, conditions directly relating to cold, such as hypothermia, are not the main cause of excess winter mortality. The majority of additional winter deaths are caused by cerebrovascular diseases, ischaemic heart disease and respiratory diseases (The Eurowinter group, 1997 and ONS, 2011). Although cancer causes more than a quarter of all deaths annually, previous research (Johnson and Griffiths, 2003) found that there was no clear seasonal pattern for these deaths.
The cold can have various physiological effects, which may lead to death in vulnerable people. Woodhouse et al (1993) reported that colder home temperature was associated with increased blood pressure in older people. The Eurowinter group (1997) noted that cold causes haemoconcentration, which leads to thrombosis, and that cold can also lower the immune system’s resistance to respiratory infections.
Additionally, the level of influenza circulating in the population increases in winter. In vulnerable groups, for example in the elderly or those with pre-existing health problems, influenza can lead to life-threatening complications, such as bronchitis or secondary bacterial pneumonia (Health Protection Agency, 2010).
Previous research has shown that although mortality does increase as it gets colder, temperature only explains a small amount of the variance in winter mortality, and high levels of excess winter mortality can occur during relatively mild winters (Brown et al, 2010). Curwen and Devis (1988) showed that both temperature and levels of influenza were important predictors of excess winter mortality. Thus, the relationship between temperature, influenza and winter mortality is complex.
Back to table of contents6. Policy context
There are a number of policies aimed at tackling excess winter mortality, such as winter fuel payments (Directgov, 2012), and the seasonal flu vaccination programme (NHS Choices, 2012). Nevertheless, in his 2009 annual report the Chief Medical Officer noted that although excess winter deaths have declined over the last 50 years, the number was still too high (Donaldson, 2010). He argued that many of these deaths were preventable and that more needed to be done to protect vulnerable people during cold winter months.
This prompted the Government to develop an annual Cold Weather Plan for England, which was launched in November 2011; the 2012 plan was released in October 2012. (Department of Health, 2012). The plan aims to minimise the health impact of severe winter weather, thus reducing the number of excess winter deaths. It uses a system of cold weather alerts, so that when severe winter weather is forecast (or occurring) health and social care services are prompted to take action.
For example, they should contact people identified to be at risk and ensure that rooms are adequately heated and that people are receiving all the benefits and services to which they are entitled. The plan also aims to raise public awareness of the potential harm caused by severe winter weather, and contains advice about the measures individuals can take to protect themselves.
The Government has also established the ‘Warm Homes, Healthy People’ fund from winter 2011/12, which aims to make funds available to local authorities and charities to help them reduce illness and death caused by living in cold homes. An estimated 130,000 to 200,000 people in England (62 per cent of them elderly) received assistance including help with loft insulation and emergency repairs, provision of warm goods, benefits advice and fuel vouchers. However, the impact of this fund on cold-related mortality has not yet been assessed (Health Protection Agency, 2012b).
Back to table of contents7. Uses of EWM data
EWM figures are widely used to inform policy, planning and research in the public sector, in particular to measure the effectiveness of cold weather planning. Local authorities and primary care organisations use ONS data to assess levels of excess winter mortality in their area. This may become even more relevant in the future as local authorities are encouraged to bid for money from the ‘Warm Homes, Healthy People’ fund. In addition, charities use excess winter mortality statistics to support a variety of campaigns.
Back to table of contents8. Comparisons with the rest of the UK
UK figures are not available as ONS only hold mortality data for England and Wales. National Records of Scotland (NRS) produce an annual winter mortality report, which is available on their website.
Northern Ireland Statistics and Research Agency (NISRA) produced a report on excess winter mortality in 2011 which is available on their website.
Winter mortality figures for Scotland and Northern Ireland are both based on death registrations, where as England and Wales figures are based on occurrences. In Scotland a death must be registered within eight days, and fact of death can be registered (with a cause given as unascertained, pending investigations) before the Procurator Fiscal has completed their investigations.
Therefore Scottish mortality data are not subject to the same registration delays as mortality data for England and Wales. Hence, almost all deaths that occurred in the relevant period will be included in the Scottish figures, meaning winter mortality figures from Scotland are comparable with ONS figures for England and Wales.
However, this is not true for Northern Ireland mortality data, as for some causes of death there can be a significant delay between when the death occurred and when it was registered. NISRA have compared EWM figures based on occurrences and registrations and the difference is quite large in some years. Therefore EWM figures from Northern Ireland and England and Wales are not directly comparable.
Back to table of contents