Table of contents
- Main points
- Important information
- Deaths from all drug poisonings
- Deaths related to drug misuse
- Drug-related deaths involving specific substances
- Opiates
- Heroin and morphine
- Other opiates, including tramadol and methadone
- Cocaine
- Amphetamines, including ecstasy
- New psychoactive substances (including "legal highs")
- Benzodiazepines
- Zopiclone and zolpidem
- Antidepressants
- Paracetamol and other analgesics
- Barbiturates
- Antipsychotics
- Age-specific mortality rates for deaths related to drug misuse
- Geographical variations in deaths related to drug misuse
- Comparisons with other countries
- Number of deaths related to drug misuse by underlying cause
- Impact of registration delays on drug-related deaths
- New method for calculating confidence intervals around mortality rates
- Changes to the coding of underlying cause of death
- Policy context
- Uses made of this data
- References
- Background notes
- Methodology
1. Main points
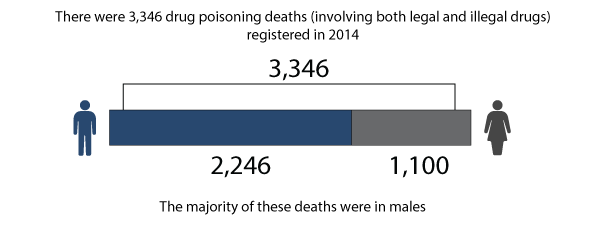
There were 3,346 drug poisoning deaths registered in England and Wales in 2014, the highest since comparable records began in 1993
Of these, 2,248 (or 67%) were drug misuse deaths involving illegal drugs
The mortality rate from drug misuse was the highest ever recorded at 39.9 deaths per million population
Males were over 2.5 times more likely to die from drug misuse than females (58.0 and 21.9 deaths per million population for males and females respectively)
Deaths involving heroin and/or morphine increased by almost two-thirds between 2012 and 2014, from 579 to 952 deaths
Deaths involving cocaine increased sharply to 247 in 2014 – up from 169 deaths in 2013
People aged 40 to 49 had the highest mortality rate from drug misuse (88.4 deaths per million population); followed by people aged 30 to 39 (87.9 deaths per million)
In England there was a 17% rise in the drug misuse mortality rate in 2014, to 39.7 per million population, while in Wales the rate fell by 16% to 39.0 deaths per million, the lowest since 2006
Within England, the North East had the highest mortality rate from drug misuse in 2014 for the second year running (69.3 deaths per million population), while London had the lowest (25.4 deaths per million)
All figures presented in this bulletin are based on deaths registered in a particular calendar year. Out of the 3,346 drug-related deaths registered in 2014, half (1,682) occurred in years before 2014
2. Important information
This bulletin presents the latest figures from the Office for National Statistics (ONS) on deaths related to drug poisoning (involving both legal and illegal drugs) and drug misuse (involving illegal drugs) in England and Wales. Figures from 1993 onwards are available to download, and are discussed in the commentary to provide further context to the latest data.
Drug use and drug dependence are known causes of premature mortality, with drug poisoning accounting for 1 in 7 deaths among people in their 20s and 30s in 2014 (see Background note 6). Drug-related deaths occur in a variety of circumstances, each with different social and policy implications. Consequently, there is considerable political, media and public interest in these figures.
This bulletin covers accidents and suicides involving drug poisonings, as well as deaths from drug abuse and drug dependence. It doesn’t include other adverse effects of drugs (for example, anaphylactic shock). Drug poisoning deaths involve a broad spectrum of substances, including legal and illegal drugs, prescription-type drugs (either prescribed to the individual or obtained by other means) and over-the-counter medications. Some of these deaths may also be from complications of drug abuse, such as deep vein thrombosis or septicaemia from intravenous drug use, rather than an acute drug overdose.
The definition of a drug misuse death is (a) deaths where the underlying cause is drug abuse or drug dependence and (b) deaths where the underlying cause is drug poisoning and where any of the substances controlled under the Misuse of Drugs Act 1971 are involved. This definition has been used across the UK. More details can be found in Background note 5.
The figures presented here are for deaths registered each year, rather than deaths occurring each year. Almost all drug-related deaths are certified by a coroner. Due to the length of time it takes a coroner to complete an inquest, half of drug-related deaths registered in 2014 will have actually occurred prior to 2014. See the "Impact of registration delays on drug-related deaths" section below for more information. Nevertheless, general trends in drug-related deaths are broadly equivalent, regardless of whether the data is analysed by year of occurrence or year of registration. Extra information is provided in the commentary where differences in the trends do exist.
Back to table of contents3. Deaths from all drug poisonings
There were 3,346 drug poisoning deaths (involving both legal and illegal drugs) registered in 2014. As in previous years, the majority (just over two-thirds) of these deaths were males (2,246 male deaths and 1,100 female deaths).
Figure 1: Number of deaths from drug-related poisoning, by sex, deaths registered in 2014
England and Wales
Source: Office for National Statistics
Notes:
- Cause of death was defined using the International Classification of Diseases, Tenth Revision (ICD-10) codes shown in Background note 4.
- Figures are for deaths registered, rather than deaths occurring in 2014.
- Figures for England and Wales include deaths of non-residents.
Download this image Figure 1: Number of deaths from drug-related poisoning, by sex, deaths registered in 2014
.png (10.7 kB) .xls (55.8 kB)
In 2014, the mortality rate for all drug-related deaths increased significantly for both males and females to 80.7 and 38.8 deaths per million population respectively. This increase is likely to be related to the availability and consumption of heroin/morphine (see the "heroin and morphine" section).
Figure 3 shows that the mortality rate from all drug poisoning is significantly higher in males than in females. The Crime Survey for England and Wales showed that men are more likely to take illicit drugs than women (Home Office, 2015a). This partly explains the higher mortality rate from drug poisoning in males. However, this cannot be the only explanation, as more than 30% of drug poisoning deaths are not related to drug misuse.
There have been significant rises in the male mortality rates for all drug-related poisonings over the last 2 years. The mortality rate reached 80.7 deaths per million population in 2014, the highest since 2001. This reverses the declining trend that had been seen between 2009 and 2012. Before this, the male mortality rate for all drug-related poisonings rose steeply from 1993 and peaked in 1999. Since then, mortality rates have been lower but there have been large fluctuations over the years, especially over the 11-year period from 1999 to 2009.
Female mortality rates have steadily increased each year since 2009. They showed a particularly marked 19% increase in 2014, reaching an all time high of 38.8 deaths per million population in 2014. This follows on from relatively stable rates between 1993 and 2004 and then a declining trend, reaching the lowest level in 2007 (26.6 deaths per million population).
Back to table of contents4. Deaths related to drug misuse
The pattern of mortality from drug misuse closely matches the overall trend seen for all drug-related deaths. Of the 3,346 drug poisoning deaths in 2014, 2,248 (67%) were from drug misuse which involves illegal drugs. The proportion of drug poisoning deaths involving illegal drugs has generally increased over the past 20 years (from 38% in 1993), but has stabilised in recent years.
Figure 2: Number and percentage of deaths from drug-related poisoning and drug misuse, deaths registered in 2014
England and Wales

Source: Office for National Statistics
Notes:
- Cause of death was defined using the International Classification of Diseases, Tenth Revision (ICD-10). More details can be found in Background notes 4 and 5.
- Figures are for deaths registered, rather than deaths occurring in 2014.
- Figures for England and Wales include deaths of non-residents.
Download this image Figure 2: Number and percentage of deaths from drug-related poisoning and drug misuse, deaths registered in 2014
.png (11.0 kB) .xls (60.4 kB)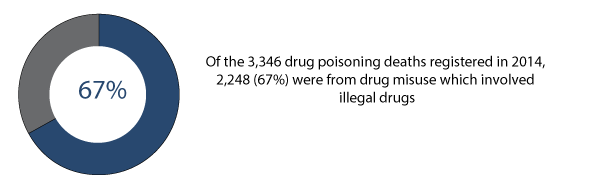
In 2014, there were 1,624 male drug misuse deaths and 624 female drug misuse deaths. The male mortality rate increased significantly to reach a new peak of 58.0 deaths per million population. The female mortality rate also increased sharply to a record high of 21.9 deaths per million.
In 2014, 72% of male drug-related deaths and 57% of female deaths were due to drug misuse. This proportion has increased since 1993, when drug misuse caused 44% of male drug-related deaths and 29% of female deaths. Figure 3 illustrates that over time the drug misuse mortality rate for each sex has gradually become closer to the all drugs poisoning mortality rate, showing the proportion of all drug poisoning deaths that can be explained by drug misuse has increased over time.
Figure 3: Age-standardised mortality rates for deaths related to drug poisoning and drug misuse, by sex, deaths registered in 1993 to 2014
England and Wales
Source: Office for National Statistics
Notes:
- Age-standardised mortality rates per 1 million population, standardised to the 2013 European Standard Population.
- Cause of death was defined using the International Classification of Diseases, Ninth Revision (ICD-9) for the years 1993 to 2000 and Tenth Revision (ICD-10) from 2001 onwards. More details can be found in Background notes 4 and 5.
- Figures are for deaths registered, rather than deaths occurring between 1993-2014.
- Figures for England and Wales include deaths of non-residents.
Download this chart Figure 3: Age-standardised mortality rates for deaths related to drug poisoning and drug misuse, by sex, deaths registered in 1993 to 2014
Image .csv .xls5. Drug-related deaths involving specific substances
Figure 4 gives the age-standardised mortality rates where selected substances were mentioned on the death certificate for 1993 to 2014, and Table 1 gives the number of deaths from a wide range of substances that are commonly abused. Table 2 provides the number of deaths from a range of prescription and over-the-counter medicines that are less commonly abused. These figures need to be interpreted with caution for the following reasons:
These figures are based only on information reported on the coroner’s death certificate, and may not include every substance involved in the death
In around 1 in 10 drug poisoning deaths, only a general description is recorded on the coroner’s death certificate (such as drug overdose or multiple drug toxicity). Deaths where the certificate contains only non-specific information cannot contribute to the counts of deaths involving specific substances
In an additional third of all drug poisoning deaths, the death certificate mentions more than one specific drug. Where more than one drug is mentioned, it is not possible to tell which was primarily responsible
Where more than one drug is mentioned on a death certificate, the death will be counted in more than one category in Tables 1 and 2 (and may appear in both tables). For example, if both heroin and methadone are mentioned, the death will be recorded once under heroin and once under methadone. Therefore the numbers for different substances cannot be added together to give a total number of deaths
Approximately 30% of all drug-related deaths also contain a mention of alcohol or long-term alcohol abuse (for example, cirrhosis) in addition to a drug
Table 1: Number of drug-related deaths where selected substances which are commonly abused were mentioned on the death certificate, deaths registered in 2010 to 2014
| 2010 | 2011 | 2012 | 2013 | 2014 | |
| All drug poisoning deaths | 2,747 | 2,652 | 2,597 | 2,955 | 3,346 |
| Any opiate4 | 1,527 | 1,439 | 1,290 | 1,592 | 1,786 |
| Heroin and Morphine | 791 | 596 | 579 | 765 | 952 |
| Methadone | 355 | 486 | 414 | 429 | 394 |
| Tramadol | 132 | 154 | 175 | 220 | 240 |
| Codeine | 91 | 88 | 73 | 130 | 136 |
| Dihydrocodeine | 90 | 109 | 103 | 102 | 86 |
| Other specified opiate | 66 | 90 | 80 | 93 | 129 |
| Unspecified opiate | 172 | 131 | 92 | 145 | 169 |
| Cocaine | 144 | 112 | 139 | 169 | 247 |
| Any amphetamine | 56 | 62 | 97 | 120 | 151 |
| Amphetamine | 48 | 46 | 49 | 56 | 85 |
| MDMA/Ecstasy | 8 | 13 | 31 | 43 | 50 |
| PMA / PMMA | 0 | 1 | 20 | 29 | 24 |
| Cannabis / Cannabinoids | 11 | 7 | 18 | 13 | 31 |
| New psychoactive substances | 22 | 31 | 55 | 63 | 82 |
| Benzodiazepines | 307 | 293 | 284 | 342 | 372 |
| Diazepam | 186 | 179 | 207 | 228 | 258 |
| Table source: Office for National Statistics | |||||
| Table notes: | |||||
| 1. Cause of death was defined using the International Classification of Diseases, Tenth Revision (ICD-10) (see Background note 4). | |||||
| 2. Figures are for deaths registered, rather than deaths occurring in 2010-2014. | |||||
| 3. Figures for England and Wales include deaths of non-residents. | |||||
| 4. Figures for opiates exclude opiates contained in a paracetamol compound, ie co-codamol, co-dydramol and co-proxamol. | |||||
Download this table Table 1: Number of drug-related deaths where selected substances which are commonly abused were mentioned on the death certificate, deaths registered in 2010 to 2014
.xls (70.7 kB)
Figure 4: Age-standardised mortality rates for selected substances, deaths registered in 1993 to 2014
England and Wales
Source: Office for National Statistics
Notes:
- Age-standardised mortality rates per 1 million population, standardised to the 2013 European Standard Population.
- Cause of death was defined using the International Classification of Diseases, Ninth Revision (ICD-9) for the years 1993 to 2000 and Tenth Revision (ICD-10) from 2001 onwards (see Background note 4). Deaths were included where the underlying cause was drug related and the specified substance was mentioned on the death certificate.
- Figures are for deaths registered, rather than deaths occurring between 1993-2014.
- Figures for England and Wales include deaths of non-residents.
- Heroin/morphine deaths up two thirds between 2012 and 2014.
Download this chart Figure 4: Age-standardised mortality rates for selected substances, deaths registered in 1993 to 2014
Image .csv .xls
Table 2: Number of drug-related deaths where selected prescription and over-the-counter medicines were mentioned on the death certificate, deaths registered in 2010 to 2014
| England and Wales | |||||
| Substance | 2010 | 2011 | 2012 | 2013 | 2014 |
| All drug poisoning deaths | 2,747 | 2,652 | 2,597 | 2,955 | 3,346 |
| Paracetamol4 | 199 | 207 | 182 | 226 | 200 |
| Antidepressants | 381 | 393 | 468 | 466 | 517 |
| Tricyclic antidepressants | 194 | 200 | 233 | 235 | 253 |
| Selective serotonin re-uptake inhibitors | 136 | 127 | 158 | 150 | 159 |
| Other antidepressants | 74 | 84 | 104 | 124 | 155 |
| Antipsychotics | 87 | 104 | 102 | 107 | 126 |
| Zopiclone / Zolpidem | 67 | 71 | 83 | 86 | 100 |
| Barbiturates | 19 | 37 | 32 | 32 | 50 |
| Source: Office for National Statistics | |||||
| Notes: | |||||
| 1. Cause of death was defined using the International Classification of Diseases, Tenth Revision (ICD-10) (see Background note 4). | |||||
| 2. Figures are for deaths registered, rather than deaths occurring in 2010-2014. | |||||
| 3. Figures for England and Wales include deaths of non-residents | |||||
| 4. Dextropropoxyphene is very rarely ingested except in combination with paracetamol, therefore figures include dextropropoxyphene mentioned without paracetamol. | |||||
Download this table Table 2: Number of drug-related deaths where selected prescription and over-the-counter medicines were mentioned on the death certificate, deaths registered in 2010 to 2014
.xls (52.2 kB)6. Opiates
Opiate drugs can be prescribed to treat moderate to severe pain, but repeated use can lead to dependence and tolerance (meaning the user needs to take more of the drug to achieve the same effect). These drugs also have psychoactive effects and many opiates are taken illicitly due to this a high abuse potential.
Over half (53%) of all deaths related to drug poisoning in 2014 involved an opiate drug (excluding opiates which are contained in paracetamol compounds such as co-codamol). This proportion has been relatively stable since 2007.
Back to table of contents7. Heroin and morphine
Deaths involving heroin and/or morphine increased from 579 in 2012 to 952 in 2014 (an increase of almost two-thirds) and they remain the most commonly mentioned opiates in drug related deaths.
Figure 4 shows that before the recent rise, the mortality rate for deaths involving heroin and/or morphine declined between 2008 and 2012, with a particularly sharp drop between 2009 and 2011. The recent reversal means the mortality rate in 2014 was the highest since 2001 and now exceeds the previous peak in 2008 seen before the "heroin drought" (see following paragraph). The number of deaths from heroin/morphine reported here is likely to be an underestimate, as some coroners simply record "opiate overdose" on the death certificate and do not specify which opiate drug was involved. Many of these deaths will actually involve heroin/morphine.
Increases in the number of deaths involving heroin/morphine were seen across all ages between 2013 and 2014, apart from people aged 70 and over, with the biggest rises seen in those aged 50 to 69 (see Reference table 7). However, a different pattern of heroin/morphine-related mortality was seen for males and females. In males, the mortality rate for deaths involving heroin and/or morphine decreased in 2012, then rose sharply in 2013 and increased again in 2014 (by 19%). In contrast, female mortality rates rose by 18% in 2012, remained stable in 2013, and then increased by 46% in 2014. Some of this difference between the sexes can be explained by the fact that a greater proportion of female deaths involving heroin/morphine are suicides (rather than accidental overdoses), which are less likely to be affected by changes in the purity of heroin.
Evidence suggests that in 2010/11 there was a "heroin drought" in the UK, with reduced availability of heroin persisting in some areas in 2011/12 and 2012/13 (Serious Organised Crime Agency (SOCA), 2011, 2012, 2013, 2014). The heroin drought affected the purity of user-level or "street" heroin, which fell from 46% in September 2009 (SOCA, 2011) to 17% in mid-2012 (National Crime Agency, 2015), then increased again in the last 2 years to an average of 29% in 2013 and 36% in 2014. This is consistent with the UN report suggesting that global opium poppy cultivation (the source of heroin) reached its highest level in 2014 since the 1930s (United Nations, 2015). Prices of heroin have also changed over this period – the purity-adjusted price of heroin per gram in the United Kingdom has fallen from £74.32 in 2011 to £49.55 in 2013 (United Kingdom Focal Point on Drugs, 2014). This means people can now take stronger heroin for the same price.
Public Health England (2014) report that the number of people starting treatment for heroin and/or crack addiction (including those returning to treatment) increased slightly between 2012/13 and 2013/14. Frontline drug workers who responded to the Street Drug Trends Survey in 2014 suggested the slight upturn in people coming into services may be related to the higher purity heroin in circulation (Drugscope, 2015).
Evidence suggests that overdoses are associated with higher drug purity (Bazazi et al, 2015) so the increase in user-level purity, and the changes in price, may partly explain the increase in heroin related deaths in 2013 and 2014. However, we would expect this to affect males and females in a similar way, so the different pattern of mortality seen for males and females suggests the increase in purity is not the only factor.
Heroin/morphine is particularly dangerous when taken in combination with other central nervous system depressant drugs such as methadone, tramadol, benzodiazepines and alcohol, as these drugs interact with heroin and can lead to marked respiratory depression resulting in a high risk of overdose. Over time, there has been a gradual increase in the number of deaths mentioning heroin/morphine in combination with other substances in England and Wales. Although this cannot fully explain the recent sharp increases in deaths involving heroin/morphine, it is possible that changes in the specific drugs taken with heroin/morphine in recent years may be having an impact.
Back to table of contents8. Other opiates, including tramadol and methadone
Reference table 6a shows that deaths involving the majority of other opiates, including painkillers such as tramadol, codeine, oxycodone and fentanyl and unspecified opiates have also increased in recent years.
A notable trend to emerge in the past few years is the steady increase in the number of deaths mentioning tramadol (a synthetic opioid analgesic). This rise continued in 2014 where the number of deaths involving tramadol increased by 9% to a new peak of 240 deaths. However, the number of tramadol prescriptions remained stable in 2014 (HSCIC, 2014 and 2015). This suggests that the increase in deaths may be due to people misusing this substance. In June 2014, tramadol was controlled under the Misuse of Drugs Act 1971 as a class C substance (Home Office, 2014a), but we will need to wait for the 2015 death registrations to be reported to us to find out whether this has had an impact on deaths.
In contrast, deaths involving methadone have shown the opposite trend in 2014, when there were 394 deaths, down 8% from 2013. Methadone is an opiate substance used to treat heroin addiction, which is sometimes abused.
Back to table of contents9. Cocaine
There were 247 deaths involving cocaine in 2014. Deaths involving cocaine increased steadily in the 1990s and 2000s, peaking in 2008, before declining slightly between 2008 and 2011. However, mortality rates have increased 3 years in a row, and have now reached an all time high of 4.4 deaths per million population.
The Crime Survey for England and Wales suggests that cocaine is the second most commonly used drug (after cannabis) with 2.4% of adults aged 16 to 59 using powder cocaine in 2013/14. This was slightly higher than in 2012/13 (1.9%), although this remains lower than the peak of 3.0% in 2008/09 (Home Office, 2015a). The National Crime Agency (2015) suggest there has been a gradual increase in user-level cocaine purity over the last 2 years, and there were marked regional variations in the purity of crack cocaine. These 2 factors are likely to be contributing to the increase in deaths involving cocaine.
Back to table of contents10. Amphetamines, including ecstasy
The number of deaths involving amphetamines increased from 120 in 2013 to 151 in 2014. This is a mortality rate of 2.6 deaths per million population, which is the highest mortality rate since records began in 1993. In addition to amphetamine itself, the amphetamines group includes substances such as methylenedioxymethamphetamine (MDMA, also known as ecstasy), methylamphetamine, paramethoxyamphetamine (PMA) and Para-methoxymethamphetamine (PMMA).
The number of deaths involving ecstasy has varied across the years. The highest number of deaths was seen in 2005 when there were 58 deaths, this then declined to a low of 8 deaths in 2010. Since then the number of deaths has gradually increased to 50 deaths in 2014. The Home Office reported a rise in ecstasy use by adults aged 15 to 59 between 2012/13 and 2013/2014, but this has since stabilised (Home Office, 2015a).
Reports have expressed concerns about the availability of "super strength" ecstasy, with one recent formulation having a reported MDMA content around 2 to 2.5 times the standard MDMA dose per pill (Drugscope, 2015). The Street Drug Trends Survey (Drugscope, 2015) reports that ecstasy purity levels have increased significantly and have now reached 1990s levels. In addition, ecstasy is sometimes taken in combination with the more potent PMA. This may partially explain the increased number of deaths involving ecstasy.
The number of death certificates mentioning PMA or PMMA dropped slightly in 2014 from 29 in 2013 to 24 in 2014. It is too soon to say if this is the end of the increasing trend seen since 2011, and the figure is still far higher than the single death seen in 2011. It has been suggested that people may be ingesting PMA or PMMA in the belief that they are taking ecstasy tablets (Frank, 2013). However, there is not enough information recorded on coroner’s death certificates to confirm if this was the case for the deaths registered in 2014.
Back to table of contents11. New psychoactive substances (including "legal highs")
Over the past few years a number of new drugs have been informally known as "legal highs". There is no official definition of new psychoactive substances (NPS), and all drugs included in our definition for the purposes of this bulletin are listed in Background note 10. This grouping may be revised in future years, as and when further NPS are indentified, and we welcome comments on the drugs included in this category.
Some of the more common NPS include synthetic cannabinoid receptor agonists (for example, "spice"), gamma-hydroxybutyrate (GHB) and its precursor gamma-butyrolactone (GBL), piperazines, cathinones such as mephedrone, benzofurans, and more recently, prescription-type drugs, for example, benzodiazepine analogues. Most of these substances are now controlled under the Misuse of Drugs Act (1971).
The number of deaths involving NPS are low compared with the number of deaths involving heroin/morphine, other opiates, or cocaine. However, over the past few years there has been an rise in NPS deaths, with 82 deaths registered in 2014 (up from 63 deaths in 2013). Analysis of the trends based on the year the death occurred, reveal a different pattern than that seen for registration year. Analysis of year of occurrence suggests that there were sharp increases in NPS deaths between 2010 and 2011 and again between 2011 and 2012, but then the number of deaths fell in 2013. Although figures for deaths occurring in 2014 are very incomplete (and thus are not shown in Figure 5), initial indications suggest that the upward trend in NPS deaths has now stabilised.
Figure 5: Number of deaths involving new psychoactive substances by registration year and occurrence year, 1993 to 2013
England and Wales
Source: Office for National Statistics
Notes:
- Cause of death was defined using the International Classification of Diseases, Ninth Revision (ICD-9) for the years 1993 to 2000 and Tenth Revision (ICD-10) from 2001 onwards (see Background note 4). Deaths were included where the underlying cause was drug related and one or more new psychoactive substances were mentioned on the death certificate.
- Figure 5 only includes deaths that were registered by 31 December 2014. Due to the length of time it takes to complete a coroner’s inquest, it can take months or even years for a drug-related death to be registered, so figures for deaths occurring in 2013 will be an underestimate. See the section on 'Impact of registration delays on drug-related deaths' for more details.
- Figures for England and Wales include deaths of non-residents.
Download this chart Figure 5: Number of deaths involving new psychoactive substances by registration year and occurrence year, 1993 to 2013
Image .csv .xlsThe majority of new psychoactive substances are now controlled under the Misuse of Drugs Act (1971). In 2014, there were 18 deaths involving NPS drugs which were still legal in July 2015.
The most commonly mentioned NPS are cathinones, the most well-known of which is mephedrone. The rise in deaths involving cathinones which we have seen in recent years appears to have levelled off in 2014, with a small increase from 26 to 27 deaths between 2013 and 2014. Analysis of year of occurrence suggests that deaths involving cathinones actually fell in 2013 and have since stabilised. This is consistent with evidence from the Crime Survey for England and Wales, which suggests that the proportion of 16 to 59-year-olds using mephedrone has not changed significantly in the last 3 years. (Home Office, 2015a).
The second most common NPS is gamma-hydroxybutyrate (GHB) and its precursor gamma-butyrolactone (GBL), which was involved in 20 deaths in 2014, which is in line with figures from the last 7 years. GBL was controlled under the misuse of drugs act in 2009, so some people would no longer consider it to be a new psychoactive substance.
An emerging trend is the use of benzodiazepine analogues, such as etizolam, flubromazepam and pyrazolam, which were involved in 9 deaths in 2014 (though around half occurred in 2013).
Another emerging trend is the use of nitrous oxide as a legal high (this substance is commonly used as pain relief during labour and is also known as laughing gas). The Crime Survey for England and Wales reported that 7.6% of people aged 16 to 24 used nitrous oxide in the last year, though this number had not increased significantly compared with the previous year (Home Office, 2015a). Our drug deaths figures suggest that there is no evidence of an increase in deaths involving nitrous oxide, as there were only 3 deaths registered in both 2013 and 2014 and between 0 and 5 deaths each year prior to that.
Back to table of contents12. Benzodiazepines
There were 372 drug-related deaths involving benzodiazepines in 2014. The mortality rate was 6.6 deaths per million population, an 8% increase from 2013 and the highest mortality rate since records began in 1993.
Diazepam was the most common type of benzodiazepine mentioned on deaths certificates in 2014, involved in 258 deaths, the highest number on record. Although diazepam can be prescribed it is also widely abused. The Street Trends Drug Survey suggests that the content of these illegal benzodiazepines varies and there is a trend for taking new benzodiazepine analogues such as etizolam (Drugscope, 2015).
The role of diazepam and other benzodiazepines in drug-related deaths is unclear, as more than 9 out of 10 deaths involving benzodiazepines also mentioned another, often more potent, drug such as heroin or methadone.
Back to table of contents13. Zopiclone and zolpidem
The number of deaths involving zopiclone or zolpidem has steadily increased since 1993 to 100 deaths in 2014, an increase of 16% since 2013. These drugs are prescribed to treat insomnia in the short-term, and prescriptions have increased slightly (2% between 2013 and 2014 – HSCIC, 2015), but this does not explain the growing number of deaths involving these substances. These drugs have the potential to be misused and in June 2014, zopiclone was controlled under the Misuse of Drugs Act 1971 as a class C substance (Home Office, 2014a), but it is too soon to say whether this has had any impact on the number of deaths. As with benzodiazepines, 8 out of 10 deaths involving Zopiclone or Zolpidem also involve another drug.
Back to table of contents14. Antidepressants
There were 517 deaths involving antidepressants in 2014, the highest number since 1999. The majority of this increase is in people aged between 40 and 69.
Deaths involving tricyclic antidepressants (TCAs) showed an increase in 2014, with 253 deaths registered in 2014. The majority of the TCA deaths involved amitriptyline where there was a 13% rise to 195 deaths, continuing the upward trend since 2010. Although TCAs are still involved in more deaths than other types of antidepressants, the number of deaths from TCA poisoning is now much lower than its peak of 497 deaths in 1998.
Deaths involving Selective Serotonin Re-uptake Inhibitors (SSRIs) have been steadily increasing over recent years, reaching a peak of 159 deaths in 2014, 1 death higher than the previous peak in 2012. The majority of SSRI deaths involve the drug citalopram. The number of these deaths had been increasing gradually over time, but in 2013 there was a decrease of 19% to 82 deaths. This increased again slightly in 2014 to 86 deaths. Studies show that SSRIs are less toxic in overdose than TCAs (Hawton et al, 2010), but SSRIs are prescribed more frequently. In the last 5 years prescriptions for SSRIs have increased more rapidly than prescriptions for TCAs (Health and Social Care Information Centre – HSCIC, 2010 and 2014), which may explain the gradual long-term rise in deaths involving SSRIs.
Deaths involving other types of antidepressants have continued the upward trend, increasing by 26% and reaching a peak in 2014 at 155 deaths. Reference table 6a shows that the majority of these deaths involved venlafaxine or mirtazapine. The number of deaths involving mirtazapine increased to 90 deaths in 2014 from 73 in 2013, the highest number on record. Deaths involving venlafaxine also increased to the highest number on record (59 deaths in 2014). The National Institute for Health and Clinical Excellence guidelines (NICE, 2009) suggest that these drugs should not be used as a first-line treatment for depression, and should only be prescribed to people who have not responded to SSRIs. Venlafaxine in particular is associated with a greater risk of death from overdose. Prescriptions for venlafaxine and mirtazapine have increased in recent years, but still only accounted for only 16% of all antidepressant prescriptions in 2014 and yet they were responsible for 29% of deaths where antidepressants were mentioned (HSCIC, 2014 and 2015).
Back to table of contents15. Paracetamol and other analgesics
There were 200 deaths involving paracetamol and its compounds in 2014. Deaths involving paracetamol not from a compound decreased by 20% in 2014 to 127, following a small increase in 2013. Overall, deaths involving paracetamol not from a compound have been fairly stable in the last few years. However, deaths involving co-codamol (paracetamol and codeine) increased by 21% in 2014 to a new high of 63 deaths.
Back to table of contents16. Barbiturates
In 2014 the number of deaths involving barbiturates increased by 56%, from 32 up to 50 deaths – an all time high. Although there has been some fluctuation, the data appears to suggest that since 2007 there has been an increasing trend, peaking in 2014.
Back to table of contents17. Antipsychotics
There were 126 deaths related to antipsychotics in 2014 (an 18% increase). This continues the gradually increasing trend that has been seen since around 2000. The number of deaths involving antipsychotics reached an all time high in 2014 and is now more than twice the level recorded in 1994. In 2014, the antipsychotic quetiapine was involved in half these cases (52 deaths). The number of prescriptions for antipsychotic drugs increased in 2014, but not as much as the number of deaths (HSCIC, 2014 and 2015). The reason for this difference is unclear.
Back to table of contents18. Age-specific mortality rates for deaths related to drug misuse
Figure 6: Age-specific mortality rates for deaths related to drug misuse, deaths registered in 1993 to 2014
England and Wales
Source: Office for National Statistics
Notes:
- Age-specific mortality rates per 1 million population.
- Cause of death was defined using the International Classification of Diseases, Ninth Revision (ICD-9) for the years 1993 to 2000 and Tenth Revision (ICD-10) from 2001 onwards. More details can be found in Background notes 4 and 5.
- Figures are for deaths registered, rather than deaths occurring between 1993-2014.
- Figures for England and Wales include deaths of non-residents.
Download this chart Figure 6: Age-specific mortality rates for deaths related to drug misuse, deaths registered in 1993 to 2014
Image .csv .xlsMortality rates from drug misuse rose across almost all age groups in 2014 for the second year in a row. The only age group to buck this trend were 20 to 29 year-olds where the rate remained the same. However the size of the increase varied between age groups, with people aged between 30 and 69 showing the largest rises; and the youngest and oldest age groups remaining relatively stable in 2014.
A large rise in the mortality rate was seen in the 40 to 49 year old age group, increasing from 70.5 to 88.4 deaths per million population between 2013 and 2014 (a 25% increase). Mortality rates in this age group have followed an upward trend and the latest increase means that for the first time the highest mortality rate from drug misuse is now in people aged 40 to 49. Mortality rates in those aged 30 to 39 also increased in 2014 to 87.9 deaths per million. The mortality rate in people aged 30 to 49 was significantly higher than any other age group and this difference is particularly marked in males (see downloadable reference tables). Reference table 7 contains the number of deaths involving selected substances by age group. This table shows that the increase in deaths in people aged 30 to 49 is largely due to deaths involving heroin/morphine, other specified opiates and cocaine. Deaths involving amphetamine also contributed to the increase in 30 to 39 year olds.
The mortality rate for 50 to 69 year olds also increased significantly in 2014 from 26.6 to 33.3 deaths per million population. This continues the upward trend seen in previous years and the mortality rate is now the highest it has ever been for this age group. Reference table 7 shows that the overall increase in this age group is driven by increases in deaths involving opiate drugs. In 2014, the mortality rate from drug misuse for 20 to 29 year olds remained stable at 40.5 deaths per million population. Looking at the long-term trends, this age group had the highest mortality rate from 1994 until 2002. Since its peak in 2001, the mortality rate decreased until 2013, when it increased from 30.5 to 40.5 deaths per million population, but this increasing trend appears to have levelled off in 2014.
For the under 20s, the mortality rate increased slightly to 2.4 deaths per million population in 2014, this follows a similar small rise in 2013. Despite the increase, the mortality rate in young people is still at a historically low level and is much lower than the mortality rate seen in older age groups.
There was a small increase in mortality for people aged 70 and over from 11.9 to 12.2 deaths per million population in 2014. However, the rate remains relatively low compared with other age groups.
This age pattern of drug misuse deaths is broadly in line with treatment figures from Public Health England (2014), which show that people receiving treatment for drug misuse are getting older. Moreover, this ageing drug using population experience wider health problems, making them harder to treat, thus impacting on mortality.
Back to table of contents19. Geographical variations in deaths related to drug misuse
In England as a whole, the mortality rate from drug misuse has increased for 2 consecutive years, marking a reversal of the declining trend which was seen between 2008 and 2012. In 2014 the rate increased by 17% from 33.9 to 39.7 deaths per million population, reaching an all time high. In contrast, since 2010, the mortality rate in Wales has been gradually decreasing, and the mortality rate declined by 16% between 2013 and 2014, when the figure stood at 39.0 deaths per million population. These differing trends mean that England now has a higher mortality rate for deaths related to drug misuse than Wales for the first time since 2004.
Nevertheless, there was considerable regional variation within England in deaths relating to drug misuse. Most regions of England saw an increase in the mortality rate from drug misuse between 2013 and 2014, though Yorkshire and The Humber and the East Midlands saw small falls. Despite a 10% increase in 2014, London continued to have the lowest mortality rate in England (25.4 deaths per million population in 2014). The regions with the highest mortality rates over the last 9 years were the North East and North West. The North East has seen particularly sharp rises in the mortality rate in the last 2 years (33% in 2014 and 30% in 2013) and the rate of 69.3 deaths per million population is now more than double that of London.
Figure 7: Age-standardised mortality rate for deaths related to drug misuse, by country and region, deaths registered in 2014
England and Wales

Source: Office for National Statistics
Notes:
- Age-standardised mortality rates per 1 million population, standardised to the 2013 European Standard Population.
- Cause of death was defined using the International Classification of Diseases, Tenth Revision (ICD-10). More details can be found in Background notes 4 and 5.
- Figures are for deaths registered, rather than deaths occurring in 2014.
- Deaths of persons usually resident in each country and region, based on boundaries as of May 2015.
Download this image Figure 7: Age-standardised mortality rate for deaths related to drug misuse, by country and region, deaths registered in 2014
.png (157.8 kB) .xls (57.3 kB)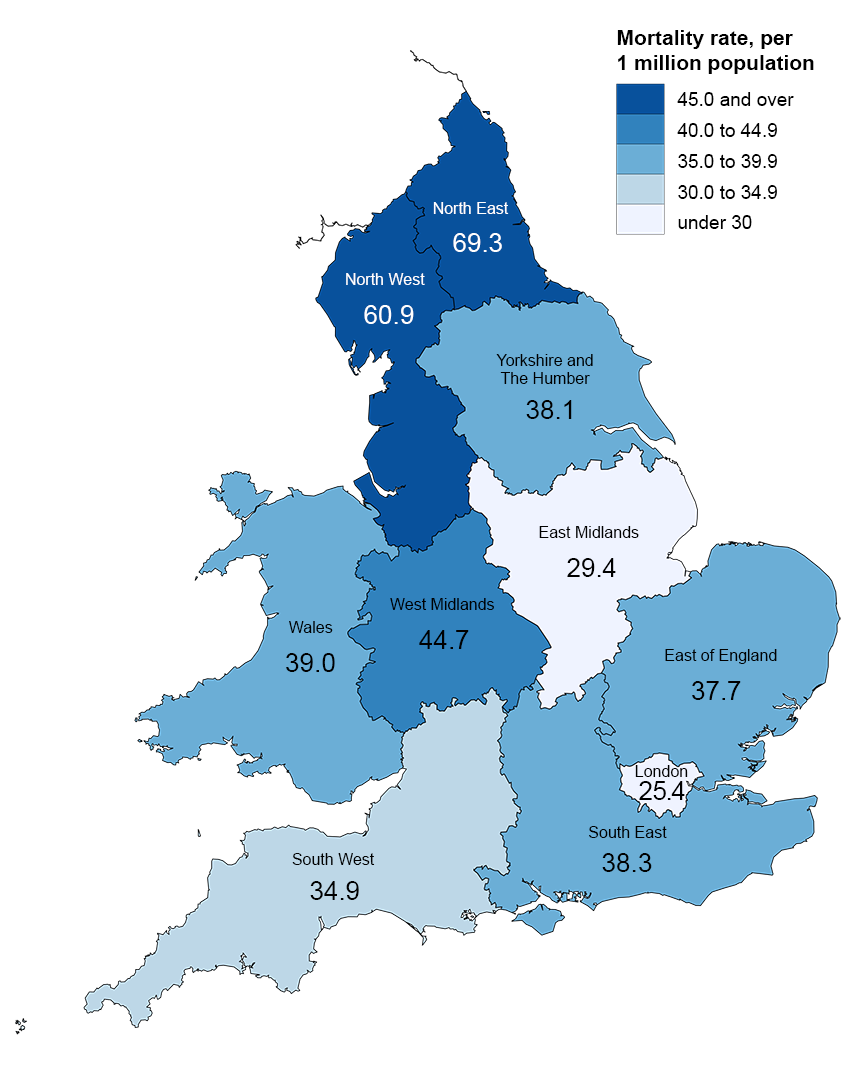
20. Comparisons with other countries
Figures on drug-related deaths in Scotland are available from National Records of Scotland. These show that there were 613 deaths related to drug misuse registered in Scotland in 2014, 16% higher than in 2013. Additional data on Scottish drug-related deaths is available from the Information Services Division of NHS Scotland.
Figures for Northern Ireland are available from the Northern Ireland Statistics and Research Agency. The latest figures show that there were 115 drug-related deaths registered in Northern Ireland in 2013, up 5% compared with 2012.
Statistics for Europe are available from the European Monitoring Centre for Drugs and Drug Addiction (EMCDDA). The latest figures show that the UK had the seventh highest drug-related mortality rate in Europe (EMCDDA, 2015).
Figures for other countries may not be comparable with those presented here for England and Wales, due to differences in data collection methods and in the death registration system.
Back to table of contents21. Number of deaths related to drug misuse by underlying cause
In January 2014, we introduced a new version of ICD-10 (software version 2013) which replaced the version introduced in 2011 (version 2010). The impact of this change is detailed in the "Changes to the coding of underlying cause of death" section. It is not anticipated that this change will have a big impact on the assignment of underlying cause of death for the drug-related deaths reported in this bulletin.
In both males and females, the largest proportion of deaths were from accidental poisonings (79% of all drug misuse deaths in males and 69% in females). Both the proportion and the actual number of accidental poisoning deaths has increased between 2013 and 2014 from 1,087 to 1,291 deaths in males and from 332 deaths to 429 deaths in females.
Deaths from mental and behavioural disorders due to drug use are essentially deaths from drug dependence or abuse. These deaths often involve an acute overdose of drugs, but because the death record did not mention a specific terms such as "overdose", the underlying cause is assigned to mental and behavioural disorders rather than an accidental poisoning. However, these 2 causes often involve very similar scenarios. The number of deaths where the underlying cause was a mental and behavioural disorder remained relatively stable for both males and females in 2014 (83 deaths and 24 deaths respectively). However, given the overall number of drug-related deaths increased in 2014, we would have expected deaths from mental and behavioural disorders to increase proportionally. As this didn’t happen, the percentage of drug misuse deaths from mental and behavioural disorders dipped slightly to 5% in males and 4% in females.
The proportion of drug-misuse deaths which are suicides (defined as intentional self-poisoning or poisoning of undetermined intent) is higher in females than in males – 27% compared with 15% in 2014. The number of female suicides related to drug misuse increased from 155 deaths in 2013 to 168 deaths in 2014. In contrast, the number of male suicides related to drug misuse decreased from 271 deaths in 2013 to 246 deaths in 2014.
The number of deaths from assault by drugs are extremely low (less than 10 per year), and have been combined with mental and behavioural disorders for completeness.
Fig 8: Male drug misuse deaths by underlying cause, deaths registered in 2014
England and Wales
Source: Office for National Statistics
Notes:
- Cause of death was defined using the International Classification of Diseases, Tenth Revision (ICD-10). More details can be found in Background notes 4 and 5.
- There are very few deaths from assault by drugs, so for presentation purposes, these have been combined with mental and behavioural disorders due to drug use.
- Figures are for deaths registered, rather than deaths occurring in 2014.
- Figures for England and Wales include deaths of non-residents.
Download this chart Fig 8: Male drug misuse deaths by underlying cause, deaths registered in 2014
Image .csv .xls
Fig 9: Female drug misuse deaths by underlying cause, deaths registered in 2014
England and Wales
Source: Office for National Statistics
Notes:
- Cause of death was defined using the International Classification of Diseases, Tenth Revision (ICD-10). More details can be found in Background notes 4 and 5.
- There are very few deaths from assault by drugs, so for presentation purposes, these have been combined with mental and behavioural disorders due to drug use.
- Figures are for deaths registered, rather than deaths occurring in 2014.
- Figures for England and Wales include deaths of non-residents.
Download this chart Fig 9: Female drug misuse deaths by underlying cause, deaths registered in 2014
Image .csv .xls22. Impact of registration delays on drug-related deaths
In England and Wales, almost all drug-related deaths are certified by a coroner following an inquest. The death cannot be registered until the inquest is completed, which can take many months or even years, and we are not notified that a death has occurred until it is registered. If someone is to be charged in relation to the death, the coroner must adjourn the inquest, and they may carry out an accelerated registration. However, the full details are not recorded until the inquest is completed, and these accelerated registration deaths are not included in the drug-related deaths figures.
In common with most other mortality statistics, figures for drug-related deaths are presented for deaths registered in a particular calendar year, which enables figures to be published in a timely manner. The alternative would be to publish statistics based on the year in which the death occurred. However, if we were to do this the publication would be delayed by at least 6 months to allow enough time for the majority of the deaths that occurred in a given year to be registered. If it was produced any earlier the data would be incomplete and inaccurate.
Due to the length of time it takes to hold an inquest, this bulletin actually presents information on deaths that may have occurred months or even years ago. Out of the 3,346 drug-related deaths registered in 2014, half (1,682) occurred in years prior to 2014. This proportion has not changed substantially in recent years, but it makes it more difficult to evaluate how changes such as the heroin drought or the banning of certain new psychoactive substances have affected drug-related deaths. It also makes it more difficult to compare trends in drug-related deaths between local areas, as registration delays vary considerably across England and Wales.
Figure 10: Average registration delay for deaths related to drug poisoning and drug misuse, deaths registered in 1993 to 2014
England and Wales
Source: Office for National Statistics
Notes:
- The registration delay is calculated as the difference between the date each death occurred and the date it was registered, measured in days. The average delay is represented using the median.
- Cause of death was defined using the International Classification of Diseases, Tenth Revision (ICD-10). More details can be found in Background notes 4 and 5.
- Figures are for deaths registered, rather than deaths occurring between 1993-2014.
- Figures for England and Wales include deaths of non-residents.
Download this chart Figure 10: Average registration delay for deaths related to drug poisoning and drug misuse, deaths registered in 1993 to 2014
Image .csv .xlsFigure 10 shows that the average registration delay has gradually increased over time. In 1993 the average delay was 70 days for all drug-related deaths and this had more than doubled to 176 days in 2013. However, in 2014 the average registration delay decreased for the first time to 161 days, suggesting the upward trend has stabilised. Over the same period the number of deaths from all causes that were referred to coroners increased from 22% in 1993 to a peak of nearly 40% in 2010, but has since levelled off. This increase may have contributed to the lengthening registration delays over the same period. Overall, the broad trends in drug-related deaths are similar whether the analysis is based on registration year or occurrence year (see Figure 11).
Figure 11: Number of deaths from drug misuse, by registration year and occurrence year, 1993 to 2013
England and Wales
Source: Office for National Statistics
Notes:
- Cause of death was defined using the International Classification of Diseases, Ninth Revision (ICD-9) for the years 1993 to 2000 and Tenth Revision (ICD-10) from 2001 onwards (see Background notes 4 and 5).
- Figure 11 only includes deaths that were registered by 31 December 2014. Due to the length of time it takes to complete a coroner’s inquest, it can take months or even years for a drug-related death to be registered, so figures for deaths occurring in 2013 will be an underestimate.
- Figures for England and Wales include deaths of non-residents.
Download this chart Figure 11: Number of deaths from drug misuse, by registration year and occurrence year, 1993 to 2013
Image .csv .xls23. New method for calculating confidence intervals around mortality rates
The deaths data in this release are not subject to sampling variation, as they were not drawn from a sample. Nevertheless, they may be affected by random variation, particularly where the number of deaths is small. To help assess the variability in the rates, they have been presented alongside 95% confidence intervals.
This bulletin uses a new method for calculating the confidence intervals around the death rates, and figures have been revised back to 1993. Previously, the confidence intervals were calculated using a normal approximation method, on the assumption that the underlying deaths data on which the rates are based on are normally distributed. However, in some instances, for example in young people, the number of drug-related deaths is relatively small (fewer than 100), and may be assumed to follow a Poisson probability distribution. In such cases, it is more appropriate to use the confidence limit factors from a Poisson probability distribution table to calculate the confidence intervals, instead of a normal approximation method. The method used to calculate confidence intervals for death rates based on fewer than 100 deaths was proposed by Dobson et al, (1991), and was described in APHO (2008) The previous normal approximation method is still used to calculate 95% confidence intervals where there are 100 or more deaths in a year.
A benefit of the new method is that because the Poisson probability distribution is asymmetric and has a lower bound of 0, the lower confidence interval will never fall below 0 (unlike the normal approximation).
These changes do not affect the death rate – only the confidence interval around the rate. The impact is generally small and affects groups where there are less than 100 deaths, for example, Wales and English regions; females; younger and older age groups and specific substances.
Back to table of contents24. Changes to the coding of underlying cause of death
We code cause of death using the World Health Organization's (WHO) International Classification of Diseases, Tenth Revision (ICD-10). Where possible, deaths are automatically coded using specialist software, with the remaining deaths being manually coded. ICD-10 was introduced in England and Wales in January 2001. Since then various amendments to the ICD-10 have been authorised by WHO and we have updated cause coding software to incorporate these changes. Between 2001 and 2010, we used software version 2001.2; between 2011 and 2013 version 2010 was used and on 1 January 2014, we changed the software to a package called IRIS (version 2013). IRIS software version 2013 incorporates all official updates to ICD-10 approved by WHO, which were timetabled for implementation before 2014.
To understand the impact of these changes on mortality statistics, we carried out bridge coding studies in which a sample of deaths that had previously been coded using the old software were then independently recoded using the new version of ICD-10 (Office for National Statistics, 2011 and 2014a).
The move to v2010 in 2011 had a big impact on the assignment of underlying cause of death for drug-related deaths, causing a large reduction in deaths with an underlying cause of a mental and behavioural disorder and a corresponding increase in deaths with an accidental underlying cause. It did not, however, affect the total number of drug-related deaths. More information about the impact of this coding change on drug-related deaths statistics can be found in the 2012 statistical bulletin (Office for National Statistics, 2012).
The move to IRIS (version 2013) software in 2014 was expected to cause a small decrease in the number of drug-related deaths, due to a change in the coding of deaths involving helium. Almost all of these deaths are suicides and until 2014 they would have been assigned an underlying cause of X64 or Y14 (poisoning by other and unspecified drugs, medicaments and biological substances). From 2014, deaths involving helium are assigned an underlying cause of X67 or Y17 (poisoning by other gases and vapours), and are no longer included in the range of codes used to select drug-related deaths (see Background note 4). Consequently, the total number of drug-related deaths are approximately 2% lower in 2014 than they would have been had the coding change not been implemented.
In addition, analysis of the bridge coded data suggested a small increase in deaths assigned an accidental poisoning underlying cause and a corresponding decrease in deaths assigned to mental and behavioural disorder due to drug use. The selection of 1 of these 2 causes is dependent on the precise wording on the death certificate and due to the small number of drug-related deaths in the bridge coded data (around 200) it is possible these changes are simply random noise in the data.
This means figures for 2011 onwards by underlying cause will not be directly comparable with figures for 2001 to 2010.
Back to table of contents25. Policy context
The current Government drug strategy, "Reducing demand, restricting supply, building recovery: supporting people to live a drug-free life" (Home Office, 2010), highlights the prevention of drug-related deaths as one of the key outcomes that recovery-oriented services should be focused on. The Government has also placed an increased emphasis on drug prevention alongside drug treatment across all substances and drug using cohorts. In April 2013, responsibility for public health – including drug and alcohol prevention and treatment – transferred from the NHS to local authorities.
Patterns of drug use change over time. For instance, in recent years people have been taking new psychoactive substances (NPS), sometimes referred to as "legal highs". In response to this, last year the Government commissioned an expert panel to look at ways to tackle NPS. Following the recommendations of the review, in May 2015, the Government introduced the Psychoactive Substances Bill in the House of Lords. Under the Bill it will be an offence to supply any substance intended for human consumption that is capable of producing a psychoactive effect (Home Office, 2015b).
In February 2013, the Welsh Government published the Substance Misuse Delivery Plan 2013–2015 (Welsh Government, 2013), which included the specific target of "reducing the number of substance misuse related deaths and non-fatal overdoses and alcohol poisonings in Wales". To support this, guidance for undertaking fatal and non-fatal drug poisoning reviews has been developed and the Welsh Government are now working with partners to implement the guidance.
Back to table of contents26. Uses made of this data
The figures contained in this bulletin are used by a range of public bodies, such as Public Health England (PHE), the Department of Health (DH), the Home Office and the Welsh Government to evaluate the effectiveness of various drug strategies. For example, the 2014 expert panel review of new psychoactive substances and the Home Offices own review of the evidence made use of our drug-related deaths data (Expert Panel, 2014 and Home Office, 2014b).
In April 2013, the key functions of the National Treatment Agency for Substance Misuse were transferred into PHE, and they have linked our data on drug-related deaths with data from the English National Drug Treatment Monitoring System (NDTMS). This study suggested that the English public treatment system for opioid use disorder prevented an average of 880 deaths each year from opioid-related poisoning (White et al, 2015).
The Welsh Government (2011) and Public Health Wales have linked our drug-related deaths data to information on the distribution and coverage of the National Take-Home Naloxone (THN) programme. This will be used to evaluate whether the THN program is having an impact on the number of drug-related deaths in Wales and also to identify areas requiring further focus.
The European Monitoring Centre for Drugs and Drug Addiction (EMCDDA) combines data for England and Wales from our drug poisoning database with data from Scotland and Northern Ireland to publish UK figures. This allows comparisons to be made with other European countries. The 2015 European drug report shows that the drug-related mortality rate in the UK was the seventh highest in Europe (EMCDDA, 2015). However, caution should be applied when making international comparisons, because of differences in definitions and the quality of reporting.
Our drug poisoning data are also used by academic researchers. For example, analysis of this data by the Centre for Suicide Research at the University of Oxford revealed that there was a major reduction in deaths involving co-proxamol following its withdrawal in 2005, with no evidence of an increase in deaths involving other analgesics, apart from oxycodone (Hawton et al, 2012). Updated data on deaths involving co-proxamol and other analgesics are shown in Reference table 6a.
Back to table of contents