Table of contents
- Introduction
- Main points
- Collaboration
- Why do some occupations have a high risk of suicide?
- Things you need to know about this release
- Suicide by occupation among males
- Suicide by occupation among females
- Additional data included in the accompanying data tables
- Discussion of the main findings
- The data used in this bulletin
- Statistical measures of suicide by occupation
- Acknowledgements
- References
1. Introduction
Suicide is the leading cause of death in England in adults below the age of 50, and past research shows that some occupations are at particularly high risk. This report describes recent analysis of deaths from suicide in different occupational groups among those aged 20 to 64 years. Such analysis can inform targeted suicide prevention measures and provide a broader understanding of influences on suicide.
The analyses are based on deaths registered in England between 2011 and 2015. Suicide was defined using the National Statistics definition which includes both intentional self-harm and injury or poisoning of undetermined intent, based on the coroner’s findings.
Back to table of contents2. Main points
- There were 18,998 suicides in men and women aged between 20 and 64 years between 2011 and 2015, which constitutes a rate of around 12 deaths for every 100,000 people per year; for around 7 in 10 (13,232) of these suicides, an occupation was provided at the time of death registration.
- Males working in the lowest-skilled occupations had a 44% higher risk of suicide than the male national average; the risk among males in skilled trades was 35% higher.
- The risk of suicide among low-skilled male labourers, particularly those working in construction roles, was 3 times higher than the male national average.
- For males working in skilled trades, the highest risk was among building finishing trades; particularly, plasterers and painters and decorators had more than double the risk of suicide than the male national average.
- The risk of suicide was elevated for those in culture, media and sport occupations for males (20% higher than the male average) and females (69% higher); risk was highest among those working in artistic, literary and media occupations.
- For females, the risk of suicide among health professionals was 24% higher than the female national average; this is largely explained by high suicide risk among female nurses.
- Male and female carers had a risk of suicide that was almost twice the national average.
- Females within the teaching and education profession had a lower risk of suicide but specifically for primary and nursery schoolteachers there was evidence of an elevated risk.
- Individuals working in roles as managers, directors and senior officials – the highest paid occupation group – had the lowest risk of suicide. Among corporate managers and directors the risk of suicide was more than 70% lower for both sexes.
3. Collaboration
This publication was produced in partnership with David Gunnell, Professor of Epidemiology, University of Bristol.
Back to table of contents

4. Why do some occupations have a high risk of suicide?
The risk of suicide in different occupations has been extensively studied in the UK and internationally. Attempting to explain suicide by occupation is complex as it is likely that a number of factors act together to increase risk. There are 3 broad reasons why an occupation may carry a high risk of suicide.
(1) Job-related features such as low pay and low job security increase risk
In a recent review of the literature, Milner et al (2013) studied the results from 34 international research projects on suicide by occupation. The results showed that the highest rates of suicide tended to be among workers with the lowest level of skill (for example, cleaners, low-skilled labourers), whereas the lowest rates of suicide were seen amongst those working in highly skilled occupations (for example, managers, chief executives, senior officials). Low-skilled workers tend to receive lower pay and have less job security and control over their work patterns than higher-skilled workers. In keeping with this, in a study of occupational suicide in Denmark, Agerbo et al (2007) found that after controlling for differences in income and employment levels in different occupations, the occupational disparity in suicide risk diminished considerably. Therefore it may not be the actual occupation that puts individuals at risk, but features of the job such as low pay, job security and the wider socio-economic characteristics of individuals employed in a particular sector.
(2) People at high risk of suicide may selectively go into particular kinds of occupations
For deaths registered in England and Wales between 1982 and 1996, Kelly and Bunting (1998) found elevated risk of suicide among publicans. One explanation could be that those who are at risk of alcoholism, a risk factor for suicide (see Hufford, 2001 and Sher, 2005), are attracted to occupations where alcohol is freely available. In other words, predefined characteristics may attract people to certain lines of work which increases their suicide risk (also see Goldney, 2016).
(3) Having access to, or knowledge of, a method of suicide increases risk
Office for National Statistics (ONS) data on occupational mortality in England and Wales between 1991 and 2000 indicated that doctors, dentists, nurses, vets and agricultural workers such as farmers were at increased risk of suicide. Similar patterns of risk have been found in other analyses of England and Wales data as well as those of other high-income countries (see Agerbo et al, 2007; Kelly and Bunting, 1998; Kõlves and De Leo, 2013; McIntosh et al, 2016 and Meltzer et al, 2008). Common explanations for the high risk of suicide in occupations like these include having easy access to lethal drugs (for example, health professionals; see Hawton et al, 2000; Milner et al, 2016 and Skegg, 2010) and firearms (for example, farmers: see Malmberg et al, 1999 and Skegg, 2010). High risk of suicide among health professionals could also be explained by these occupations possessing relevant knowledge on methods of suicide (for example, different kinds of drugs, lethal doses and their effects).
Back to table of contents5. Things you need to know about this release
This report is based on deaths from suicide registered in England between 2011 and 2015 among those aged 20 to 64 years. During this period 18,998 deaths were recorded as suicide. Of these records 13,232 had information on the deceased’s occupation; of the remaining 5,766 records, the majority (4,323) contained no information on the deceased’s occupation due to this not being provided at the time of death registration. Of the suicides included in the analysis, around 4 in 5 were among men (10,688). In view of the marked sex difference in the risk of suicide as well as differences in the occupations favoured by men and women, this report examines findings for men and women separately.
Data on occupation is coded using the Standard Occupation Classification (SOC 2010). In all, there are 9 major groups of occupations (for example, skilled trades occupations); 25 sub-major groups (for example, skilled construction and building trades); 90 minor groups (for example, building finishing trades); and more than 350 individual occupations (for example, painters and decorators). Full lists of occupations used in the analysis are reported in the accompanying data tables, and descriptions of these can be found in ONS Standard Occupational Classification (SOC) Hierarchy. The report is structured so that it describes larger categories of occupations before moving on to describe risk in specific occupations.
The figures in the commentary are based on the Standardised Mortality Ratio (referred to as SMR). This commonly used measure of mortality establishes whether the number of suicides in a particular occupation group is high or low relative to patterns of suicide in the broader population of England (that is, all usual residents in England aged 20 to 64 years). This takes into account the age distribution of people employed in a particular occupation. Specifically, from age-specific rates of suicide in England we can calculate how many suicides would be expected in a given occupation should the overall pattern of suicide in England hold – for simplicity we refer to expected suicides as the “national average”. We then compare the actual number of suicides for a particular occupation to the national average.
If the risk of suicide in a particular occupation is the same as the national average, the value of the SMR will be 100. If the risk of suicide in an occupation is higher than the national average, the SMR will be greater than 100 and if it is lower than the national average the SMR will be less than 100.
In addition, the value of the SMR should be interpreted with respect to its lower and upper 95% confidence limits. These provide the range of values within which we are 95% confident the true value of the SMR lies. In other words, the confidence limits capture the statistical uncertainty in our estimates due to the often small number of deaths – the smaller the number of deaths, the wider the range of the lower and upper confidence limits. Only when the 95% confidence limits exclude 100 do we have statistical evidence that a particular occupation is at increased or decreased risk of suicide.
In the commentary we only refer to occupations where there are 50 suicides and above as their SMRs can be estimated more precisely. Please see ‘Statistical measures of suicide by occupation’ for further guidance on how SMRs are calculated (section 10).
The analyses reported here provide an important snapshot on occupations with a high risk of suicide in England, 2011 to 2015. The results should, however, be interpreted bearing in mind several important limitations (see ‘Limitations of the work’ in section 8).
Information for the media
Research consistently demonstrates strong links between certain types of media coverage and increases in suicide rates. The risk of media reporting influencing imitational suicidal behaviour significantly increases if details of suicides methods are reported, if the story is placed prominently and if the coverage is sensationalised and/or extensive. Please bear in mind Samaritans’ Media Guidelines for the reporting of suicide.
Please bear in mind the relationship between suicide risk and access to means - highlighting suicide methods for some occupations is particularly harmful. Please take particular care to avoid including details of suicide methods, including with the use of case studies to illustrate stories. For further advice on reporting on the topic of suicide, you can contact Samaritans’ Media Advisory Service on: 0208 394 8377 or email l.fraser@samaritans.org
Please encourage help-seeking behaviour by including sources of support, such as Samaritans: Whatever you’re going through, you can call Samaritans free any time on 116 123 (this number will not appear on your phone bill), email jo@samaritans.org, or visit www.samaritans.org to find details of your nearest branch.
Where to go for help
If you are struggling to cope, please call Samaritans on 116 123 (UK and ROI; this number will not appear on your phone bill), email jo@samaritans.org, or visit the Samaritans website to find details of the nearest branch. Samaritans is available round the clock, every single day of the year, providing a safe place for anyone struggling to cope, whoever they are, however they feel, whatever life has done to them.
Resources are also available online. “U can Cope” includes a film and resources that are designed for people in distress and those trying to support them, to instil hope, promote appropriate self-help and inform people regarding useful strategies and how they can access help and support. “Staying safe if you’re not sure life’s worth living” includes practical, compassionate advice and many useful links for people in distress.
Back to table of contents6. Suicide by occupation among males
Elementary occupations and skilled trades have a high incidence of suicide compared with the national average in England
During the period 2011 to 2015, of the 13,232 suicides recorded in England with information on the deceased’s occupation, the majority (10,688; 81%) were among men. Focusing on the 9 major occupation groups (Figure 1), elementary occupations (that is, low-skilled workers) had the highest risk of suicide which was 44% higher than the national average. Suicides in this group accounted for 17% (1,784 out of 10,688) of all male suicides with an occupation recorded.
Males working in skilled trade occupations had the second-highest risk among the major occupational groups. Suicides in this group accounted for 29% (3,059 out of 10,688) of all male suicides.
There were 2 other major occupational groups where the level of suicides was higher than the national average: those working as process, plant and machine operatives (8% higher) and those working in caring, leisure and service occupations (9% higher). However, the latter group was not statistically different to the national average.
The remaining 5 major occupational groups all had a lower risk of suicide than the national average, with the lowest occurring among managers, directors and senior officials. In this group the risk of suicide was around 50% less than the national average.
Figure 1: Male suicides in each major occupational group, deaths registered in England, 2011 to 2015

Source: Office for National Statistics
Notes:
- The National Statistics definition of suicide is provided in Section 9, 'The data used in this bulletin.'
- Figures are for those aged 20 to 64 years.
- Figures exclude deaths of non-residents and are based on postcode boundaries as of May 2016.
- Occupations defined using the Standard Occupation Classification (version 2010).
- The standardised mortality ratio (SMR) is a common measure of mortality. The dashed line shows the level of suicide among all usual residents in England (SMR=100). When the value of the SMR is above 100, the risk of suicide is higher than that in the broader population of England. When the value is below 100, the risk of suicide is lower than that in the broader population.
- Error bars show the lower and upper confidence limits. When the range of the upper and lower confidence limits exclude 100, the risk of suicide for a given occupation is statistically different to that observed in the broader population of England.
- Figures are for deaths registered in each calendar year. Due to the length of time it takes to hold an inquest, the deaths presented here may have occurred months, or even years, before they were registered.
Download this image Figure 1: Male suicides in each major occupational group, deaths registered in England, 2011 to 2015
.png (16.8 kB) .xls (31.2 kB)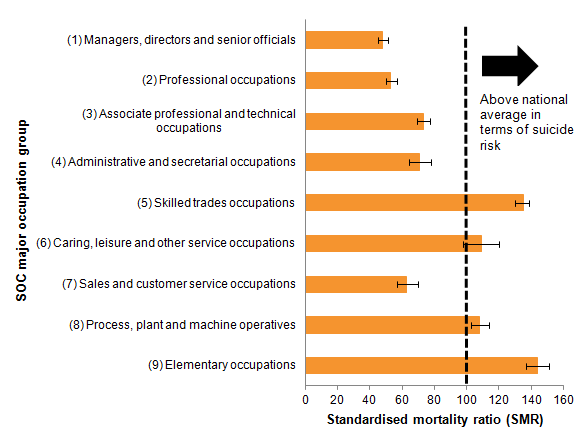
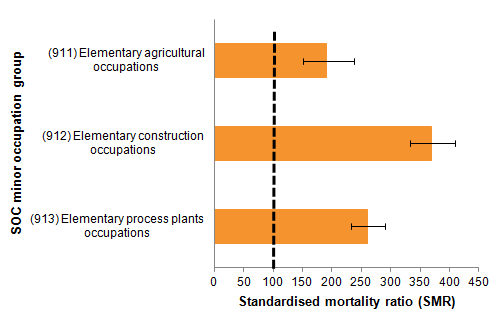
Elementary occupations can be subdivided into elementary trades and related occupations, and elementary administration and service occupations. Risk of suicide varied widely between these 2 groups – for elementary trades the risk was almost 3 times above the national average but for elementary administration and service occupations the risk was no different to the national average.
Among elementary trades there were 3 job groups with a high risk of suicide. The highest risk was among low-skilled workers in construction (see Figure 2), with a risk that was 3.7 times above the national average. Risk was also higher among those working in agriculture in roles such as harvesting crops and rearing animals (almost twice the national average) and those working in process plant occupations such as assisting the work of machine operatives (2.6 times higher).
Figure 2: Male suicides among low-skilled elementary occupations, deaths registered in England, 2011 to 2015
Source: Office for National Statistics
Notes:
- The National Statistics definition of suicide is provided in Section 9, 'The data used in this bulletin.'
- Figures are for those aged 20 to 64 years.
- Figures exclude deaths of non-residents and are based on postcode boundaries as of May 2016.
- Occupations defined using the Standard Occupation Classification (version 2010).
- The standardised mortality ratio (SMR) is a common measure of mortality. The dashed line shows the level of suicide among all usual residents in England (SMR=100). When the value of the SMR is above 100, the risk of suicide is higher than that in the broader population of England. When the value is below 100, the risk of suicide is lower than that in the broader population.
- Error bars show the lower and upper confidence limits. When the range of the upper and lower confidence limits exclude 100, the risk of suicide for a given occupation is statistically different to that observed in the broader population of England.
- Figures are for deaths registered in each calendar year. Due to the length of time it takes to hold an inquest, the deaths presented here may have occurred months, or even years, before they were registered.
Download this image Figure 2: Male suicides among low-skilled elementary occupations, deaths registered in England, 2011 to 2015
.png (8.7 kB) .xls (30.7 kB)
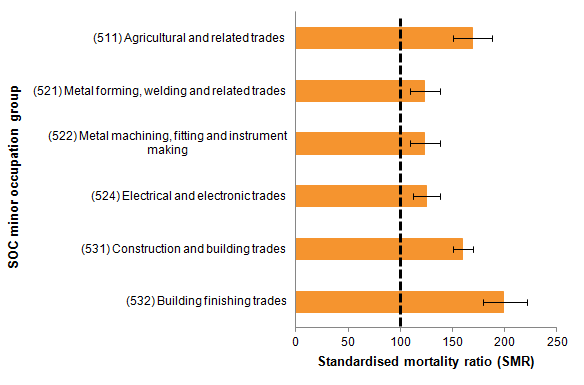
Looking in more detail at those working in skilled trade occupations, the largest elevated risk of suicide was among skilled agricultural and construction roles, similar to the findings of their lower-skilled counterparts among the elementary occupations.
Skilled trades can be subdivided into 13 minor groups. Of these, 6 have an increased risk of suicide (see Figure 3). The largest elevated risk was among building finishing trades (twice the national average). This is largely due to the high risk of suicide among plasterers, painters and decorators.
The next highest elevated risk was among agricultural and related trades (1.7 times higher). Interestingly, this group was found to have the highest proportion of deaths due to the use of a firearm (12.6% of all suicides in this group; in England this figure is 1.7%); suggesting that access to a means of suicide is an important risk factor in this group. In the past, agricultural and related trades have received much attention because farmers have been found to have an elevated risk of suicide (see Kelly and Bunting, 1998 and Meltzer et al, 2008). In the most recent data, however, the risk of suicide in farmers was not statistically different from the national average. Instead, suicide was around twice the national average among gardeners.
Similarly, a high incidence of suicide was also found among those working in construction and building trades, where the risk of suicide was 1.6 times higher than the national average. The occupation with the highest risk of suicide in this group was roofers, tilers and slaters, where the risk of suicide was 2.7 times higher than the national average. Research from Australia indicates that the elevated risk of suicide among males working in construction industries includes high levels of alcohol consumption, relationship problems and multiple stressful life events in the months before death (see Heller et al, 2007 and AISRAP, 2006).
Figure 3: Male suicides among skilled trade occupations, deaths registered in England, 2011 to 2015
Source: Office for National Statistics
Notes:
- The National Statistics definition of suicide is provided in Section 9, 'The data used in this bulletin.'
- Figures are for those aged 20 to 64 years.
- Figures exclude deaths of non-residents and are based on postcode boundaries as of May 2016.
- Occupations defined using the Standard Occupation Classification (version 2010).
- The standardised mortality ratio (SMR) is a common measure of mortality. The dashed line shows the level of suicide among all usual residents in England (SMR=100). When the value of the SMR is above 100, the risk of suicide is higher than that in the broader population of England. When the value is below 100, the risk of suicide is lower than that in the broader population.
- Error bars show the lower and upper confidence limits. When the range of the upper and lower confidence limits exclude 100, the risk of suicide for a given occupation is statistically different to that observed in the broader population of England.
- Figures are for deaths registered in each calendar year. Due to the length of time it takes to hold an inquest, the deaths presented here may have occurred months, or even years, before they were registered.
Download this image Figure 3: Male suicides among skilled trade occupations, deaths registered in England, 2011 to 2015
.png (12.2 kB) .xls (31.2 kB)
Looking across the other occupational groups (see Figure 4), people working in culture, media and sport occupations were at a 20% increased risk of suicide. Within this group suicide was more common for musicians, actors and entertainers. Males working in caring and personal services occupations had an 18% increased risk of suicide; this was particularly the case among care workers and home carers.
Figure 4: Male suicides among other occupations, deaths registered in England, 2011 to 2015.

Source: Office for National Statistics
Notes:
- The National Statistics definition of suicide is provided in Section 9, 'The data used in this bulletin.'
- Figures are for those aged 20 to 64 years.
- Figures exclude deaths of non-residents and are based on postcode boundaries as of May 2016.
- Occupations defined using the Standard Occupation Classification (version 2010).
- The standardised mortality ratio (SMR) is a common measure of mortality. The dashed line shows the level of suicide among all usual residents in England (SMR=100). When the value of the SMR is above 100, the risk of suicide is higher than that in the broader population of England. When the value is below 100, the risk of suicide is lower than that in the broader population.
- Error bars show the lower and upper confidence limits. When the range of the upper and lower confidence limits exclude 100, the risk of suicide for a given occupation is statistically different to that observed in the broader population of England.
- Figures are for deaths registered in each calendar year. Due to the length of time it takes to hold an inquest, the deaths presented here may have occurred months, or even years, before they were registered.
Download this image Figure 4: Male suicides among other occupations, deaths registered in England, 2011 to 2015.
.png (7.5 kB) .xls (22.5 kB)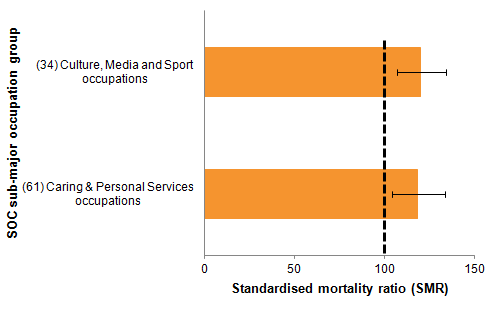
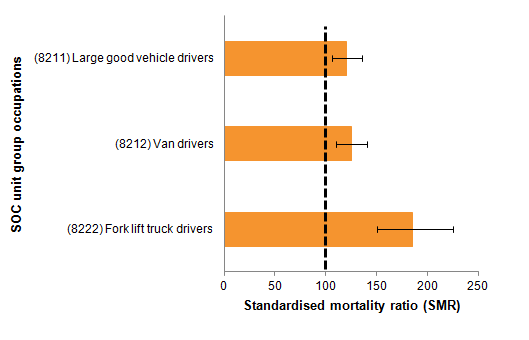
Finally, looking at the most detailed occupational level shows an elevated risk among some of the occupations within the transport and mobile machine drivers category (see Figure 5). While the overall risk of suicide in this group was only 8% above the national average, within this category there were a number of specific high-risk occupations, particularly drivers of fork lift trucks (85% higher than the national average), vans (25% higher) and large goods vehicles (20% higher). Contrastingly, the risk of suicide among bus and coach drivers was 32% lower than the national average.
Figure 5: Suicides among transport and mobile machine drivers, males, deaths registered in England, 2011 to 2015
Source: Office for National Statistics
Notes:
- The National Statistics definition of suicide is provided in Section 9, 'The data used in this bulletin.'
- Figures are for those aged 20 to 64 years.
- Figures exclude deaths of non-residents and are based on postcode boundaries as of May 2016.
- Occupations defined using the Standard Occupation Classification (version 2010).
- The standardised mortality ratio (SMR) is a common measure of mortality. The dashed line shows the level of suicide among all usual residents in England (SMR=100). When the value of the SMR is above 100, the risk of suicide is higher than that in the broader population of England. When the value is below 100, the risk of suicide is lower than that in the broader population.
- Error bars show the lower and upper confidence limits. When the range of the upper and lower confidence limits exclude 100, the risk of suicide for a given occupation is statistically different to that observed in the broader population of England.
- Figures are for deaths registered in each calendar year. Due to the length of time it takes to hold an inquest, the deaths presented here may have occurred months, or even years, before they were registered.
Download this image Figure 5: Suicides among transport and mobile machine drivers, males, deaths registered in England, 2011 to 2015
.png (7.9 kB) .xls (22.0 kB)
Several occupation groups had less than half the expected number of suicides
The lowest risk of suicide was found among corporate managers and directors, which was 72% lower than the national average.
Risk of suicide was around half the national average among science, research, engineering and technology professionals, as well as among those working as business media and public service professionals.
Individuals working in sales and customer services roles both had a risk of suicide which was around 40% lower than the national average.
Figure 6: Occupations with low number of expected suicides, males, deaths registered in England, 2011 to 2015

Source: Office for National Statistics
Notes:
- The National Statistics definition of suicide is provided in Section 9, 'The data used in this bulletin.'
- Figures are for those aged 20 to 64 years.
- Figures exclude deaths of non-residents and are based on postcode boundaries as of May 2016.
- Occupations defined using the Standard Occupation Classification (version 2010).
- The standardised mortality ratio (SMR) is a common measure of mortality. The dashed line shows the level of suicide among all usual residents in England (SMR=100). When the value of the SMR is above 100, the risk of suicide is higher than that in the broader population of England. When the value is below 100, the risk of suicide is lower than that in the broader population.
- Error bars show the lower and upper confidence limits. When the range of the upper and lower confidence limits exclude 100, the risk of suicide for a given occupation is statistically different to that observed in the broader population of England.
- Figures are for deaths registered in each calendar year. Due to the length of time it takes to hold an inquest, the deaths presented here may have occurred months, or even years, before they were registered.
Download this image Figure 6: Occupations with low number of expected suicides, males, deaths registered in England, 2011 to 2015
.png (9.7 kB) .xls (23.0 kB)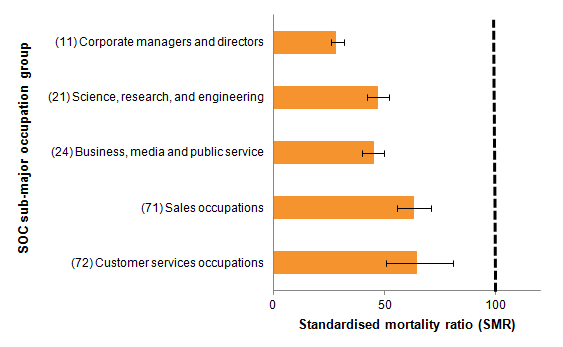
Male health professionals, particularly doctors, had a low risk of suicide
The most recent data show that male health professionals are at relatively low risk of suicide. In the period between 2011 and 2015 they experienced a 16% reduced risk of suicide relative to the national average. Low risk of suicide was particularly seen among medical practitioners (37% lower). These findings are in keeping with past national and international research showing lower incidence of suicide among male health professionals (see Hawton et al, 2001 and Kõlves and De Leo, 2013). Despite the low incidence of suicide, when compared with other groups of occupations male health professionals had the highest proportion of deaths due to poisoning (33% of all suicides in this group; in England this figure is 18.6%). This suggests that when suicides do occur among male health professionals, means of access to, and knowledge of, methods of suicide is an important risk factor.
Back to table of contents7. Suicide by occupation among females
Suicides are less common for females than males and there are also differences in the types of occupation where suicide is more common
Looking at the 9 major occupational groups none showed a risk of suicide that was statistically higher than the England average. Despite this, several occupations had statistically lower risk including managers, directors and senior officials; professional workers; associate professional and technical occupations; those working in administration; and those working in sales and customer service (see Figure 7).
Figure 7: Female suicides in each major occupational group, deaths registered in England, 2011 to 2015

Source: Office for National Statistics
Notes:
- The National Statistics definition of suicide is provided in Section 9, 'The data used in this bulletin.'
- Figures are for those aged 20 to 64 years.
- Figures exclude deaths of non-residents and are based on postcode boundaries as of May 2016.
- Occupations defined using the Standard Occupation Classification (version 2010).
- The standardised mortality ratio (SMR) is a common measure of mortality. The dashed line shows the level of suicide among all usual residents in England (SMR=100). When the value of the SMR is above 100, the risk of suicide is higher than that in the broader population of England. When the value is below 100, the risk of suicide is lower than that in the broader population.
- Error bars show the lower and upper confidence limits. When the range of the upper and lower confidence limits exclude 100, the risk of suicide for a given occupation is statistically different to that observed in the broader population of England.
- Figures are for deaths registered in each calendar year. Due to the length of time it takes to hold an inquest, the deaths presented here may have occurred months, or even years, before they were registered.
Download this image Figure 7: Female suicides in each major occupational group, deaths registered in England, 2011 to 2015
.png (15.5 kB) .xls (23.0 kB)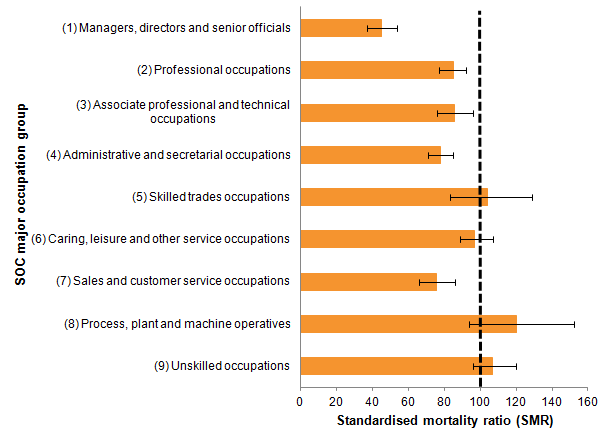
For females it is only when looking at a more granular level of occupation that some occupations stand out. Similar to males, the highest elevated risk was seen among those working in elementary trades occupations. In this group the risk of suicide was almost twice the national average. However, in this group the number of suicides (48) was low when compared with groups of occupations where women are more likely to work.
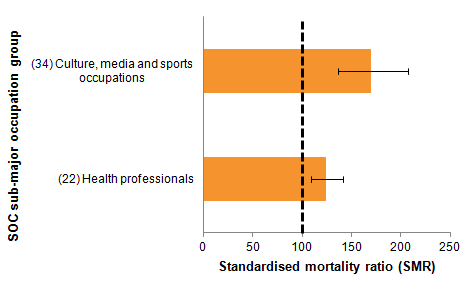
Focusing on occupations where there were at least 50 suicides, the risk of suicide was statistically higher than the national average in 2 of the 25 sub-major groups of occupations (see Figure 8). As was found for males, the risk of suicide was elevated among those working in culture, media and sport occupations (69% higher than the national average). In this group, this finding is largely explained by a high incidence of suicide among those working in artistic, literary and media occupations.
The other occupational group with an elevated risk of suicide was health professionals. Over the period 2011 to 2015 the risk of suicide among health professionals was 24% higher than the national average. This finding is largely explained by the higher risk of suicide among nurses, which was 23% above the national average. These findings fit past research which shows elevated risk of suicide among female health professionals (Hawton et al, 2001; Hawton et al, 2011 and Kõlves and De Leo, 2013). Poisoning was the most frequent method of suicide among female health professionals, accounting for 41.2% of all suicides. However, as a method of suicide, poisoning tends to be more common among females, accounting for 36.7% of all suicides among women in England during the same period.
Figure 8: Occupations with higher number of expected suicides, females, deaths registered in England, 2011 to 2015
Source: Office for National Statistics
Notes:
- The National Statistics definition of suicide is provided in Section 9, 'The data used in this bulletin.'
- Figures are for those aged 20 to 64 years.
- Figures exclude deaths of non-residents and are based on postcode boundaries as of May 2016.
- Occupations defined using the Standard Occupation Classification (version 2010).
- The standardised mortality ratio (SMR) is a common measure of mortality. The dashed line shows the level of suicide among all usual residents in England (SMR=100). When the value of the SMR is above 100, the risk of suicide is higher than that in the broader population of England. When the value is below 100, the risk of suicide is lower than that in the broader population.
- Error bars show the lower and upper confidence limits. When the range of the upper and lower confidence limits exclude 100, the risk of suicide for a given occupation is statistically different to that observed in the broader population of England.
- Figures are for deaths registered in each calendar year. Due to the length of time it takes to hold an inquest, the deaths presented here may have occurred months, or even years, before they were registered.
Download this image Figure 8: Occupations with higher number of expected suicides, females, deaths registered in England, 2011 to 2015
.png (6.9 kB) .xls (30.2 kB)
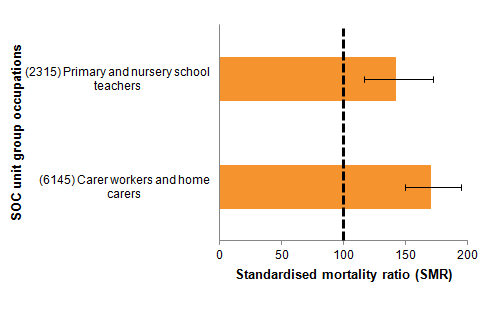
While the overall risk of suicide for those in the teaching and education profession was 31% lower than the national average, this masked some differences when looking at the most detailed level of occupation. During the period 2011 to 2015 there were 139 suicides among teaching and educational professionals and almost three-quarters (73%) of these, or 102 suicides, were for those recorded as primary and nursery schoolteachers. When focusing on primary and nursery schoolteachers, the risk of suicide was 42% higher than the national average (see Figure 9).
When looking at other specific occupations where there were at least 50 suicides, the risk of suicide among carers and home carers was 70% higher than the national average.
Figure 9: Detailed occupations with higher number of expected suicides, females, deaths registered in England, 2011 to 2015
Source: Office for National Statistics
Notes:
- The National Statistics definition of suicide is provided in Section 9, 'The data used in this bulletin.'
- Figures are for those aged 20 to 64 years.
- Figures exclude deaths of non-residents and are based on postcode boundaries as of May 2016.
- Occupations defined using the Standard Occupation Classification (version 2010).
- The standardised mortality ratio (SMR) is a common measure of mortality. The dashed line shows the level of suicide among all usual residents in England (SMR=100). When the value of the SMR is above 100, the risk of suicide is higher than that in the broader population of England. When the value is below 100, the risk of suicide is lower than that in the broader population.
- Error bars show the lower and upper confidence limits. When the range of the upper and lower confidence limits exclude 100, the risk of suicide for a given occupation is statistically different to that observed in the broader population of England.
- Figures are for deaths registered in each calendar year. Due to the length of time it takes to hold an inquest, the deaths presented here may have occurred months, or even years, before they were registered.
Download this image Figure 9: Detailed occupations with higher number of expected suicides, females, deaths registered in England, 2011 to 2015
.png (7.3 kB) .xls (22.5 kB)
8. Additional data included in the accompanying data tables
The findings described in this commentary are those which differ significantly from the national average and are based on substantial numbers of deaths. The accompanying data tables contain figures on suicide for major group occupations, sub-major group occupations, minor group occupations and unit group occupations. Separate tables have been provided for the standardised mortality ratio, age-standardised rate and the proportional mortality ratio. We also provide age-specific breakdowns, and data on methods of suicide for sub-major occupations groups.
Back to table of contents9. Discussion of the main findings
The work described in this report details deaths from suicide in different occupation groups. The analyses were based on deaths recorded as suicide from death registrations in England between 2011 and 2015 among males and females aged 20 to 64 years.
Among males, an elevated risk of suicide was found among low-skilled workers, skilled manual workers, those working in arts-related occupations and as carers. The lowest risk of suicide was found among corporate managers and directors, professionals including health professionals, and those working in customer service and sales.
Among females, an elevated risk of suicide was found among low-skilled workers, nurses, nursery and primary schoolteachers in addition to those working in arts-related occupations and as carers. The lowest risk of suicide was found among managers, directors and senior officials; professional workers; associate professional and technical occupations; those working in administration; and those working in sales and customer service.
How the work relates to that conducted previously: similarities and new findings
Previous studies have investigated suicide by occupation for England and Wales. Separate suicide prevention strategies now exist for England and for Wales and so this analysis focused specifically on suicide by occupation in England. For England, a recent report outlined how the government intends to expand its work in the domain of suicide prevention.
One of the last major studies which addressed suicide by occupation in England and Wales was based on suicides registered between 2001 and 2005 among males and females aged 20 to 64 years (Meltzer et al, 2008; also see Roberts et al, 2013). There are several similarities between the present findings and those reported in earlier studies. However, here it must also be noted that differences between studies could be a product of the methods used (see “Other methods to measure suicide by occupation” in section 10 for further information).
For males, as with our data, Meltzer et al (2008) found the highest risk of suicide among skilled trades (for example, construction) in addition to lower-skilled jobs. Previous research has explained findings in sectors like these as being related to low pay, low job security and lower socio-economic status more generally (for example, Agerbo et al, 2007). Other research has found that suicides in the construction industry may be preceded by high levels of alcohol consumption, relationship problems and multiple stressful life events in the months before death (see Heller et al, 2007 and AISRAP, 2006). People in these occupations may be at increased risk of suicide prior to starting the job. Second, as with our data, Meltzer et al (2008) found a lower risk of suicide among male health professionals including doctors. Research based on suicides registered in the 1980s and 1990s generally found an elevated risk of suicide among male health professionals (for example, Kelly and Bunting, 1998 and ONS, 2009). The lower incidence of suicide among male health professionals in the most recent data could represent an improvement in this sector, or it could be a result of our use of standardised mortality ratios rather than proportional mortality ratios (see Other methods to measure suicide by occupation in section 10).
Finally, as with our data, Meltzer et al (2008) found a higher incidence of suicide among female health professionals. In our data, this finding was largely explained by elevated suicide among female nurses, something which also fits past research (for example, Kelly and Bunting, 1998). Elevated suicide among female nurses could be linked to a high incidence of psychiatric illness (Hawton et al, 2002) in addition to nurses having access to, and knowledge of, methods of suicide such as lethal drugs.
There are, however, some differences between previous findings and the most recent data – findings which represent potential new trends in suicide by occupation. For instance, Meltzer et al (2008) found an elevated risk of suicide among male farmers. In the most recent data, farmers were not at increased risk of suicide – a finding which may represent an improvement in this sector. Despite this, the most recent data show that those working in agricultural related trades are more likely to die using a firearm relative to any other occupation group. As such, the ability to access a method of suicide is likely to be an important contributor to the risk of suicide among farmers.
In the most recent data, those working in arts-related occupations including artists, musicians and entertainers were found to be at high risk of suicide. With the exception of finding a higher incidence of suicide among artists (Meltzer et al, 2008), few studies have identified an increased risk in this sector more widely (for example, artists, musicians and entertainers or presenters). Past research has found an association between creativity and psychiatric illness (for example, bipolar disorder; Simeonova et al, 2005) – a potential explanation of this finding. In our data, an elevated risk of suicide was also found among nursery and primary schoolteachers (females only) in addition to carers (both males and females). To our knowledge, these findings have not been identified in past work; as such, future research should seek to understand these findings to inform appropriate prevention measures.
Limitations of the work
The data reported in this bulletin are taken from 2 separate sources – death certification and the 2011 Census. As such, the findings could be impacted by a small degree of bias due to the misalignment of data between the 2 sources (that is, numerator-denominator error). The recorded occupation likely reflects the deceased's main lifetime occupation or their occupation at the time of death. It is also possible that, when they died, the deceased was retired, unemployed, or in a different job altogether. Despite these limitations, given the large degree of consistency between the findings reported here and those found in past research, we believe that the impact of data issues like these is likely to be small.
While the work reported here shows that individuals in certain occupations are more or less likely than others to die by suicide, the analysis does not provide any evidence on causation. For instance, while it is possible that certain jobs make suicide more or less likely, it could also be the case that people’s characteristics attract them to certain lines of work. Similarly, while it is possible to speculate why certain occupations have a high or low risk of suicide, the analysis reported here does not uncover whether particular occupations are exposed to specific risk factors that make suicide more or less likely (for example, job-related stresses, job-related conditions, socio-economic determinants).
Given that the analysis reported here uses the same 2011 Census population for each year of deaths, the analysis will be affected if there has been a rapid increase or decrease in the number of workers in a specific occupation.
In this work, we investigated risk in a large number of occupational groups and individual occupations, and so it is possible that risks highlighted in some occupations, particularly those where risk estimates were based on relatively few deaths, may be chance findings. In this commentary, we reduced the likelihood of this occurring by only describing findings based on at least 50 deaths.
In common with most other mortality statistics, suicide figures are presented for deaths registered in a particular calendar year, which enables figures to be published in a timely manner. The alternative would be to publish statistics based on the year in which the death occurred − however, this would delay publication, cause repeated revisions to historical data and be inconsistent with other published mortality figures. Publishing suicide figures based on year of registration means that some deaths appear in the statistics a year or more after the date on which the death occurred. However, as suicide trends tend to change relatively slowly over time, this is unlikely to have a great impact on the usability of UK suicide statistics. Further information on suicide registration delays in England are published in our annual release.
Despite the limitations, the work reported here gives an important snapshot of current trends in suicide by occupation in England, providing a strong foundation for targeted suicide prevention strategies and further analysis on specific risk factors.
Back to table of contents10. The data used in this bulletin
Deaths data
The figures described in this bulletin include deaths registered in England between 2011 and 2015. Deaths were only included in the analyses if the country of usual residence was also England.
Suicide was defined using the National Statistics definition of suicide which includes deaths given an underlying cause of intentional self-harm or injury or poisoning of undetermined intent (ICD-10 codes: X60 to X84, Y10 to Y34). This definition is described fully in our annual statistical bulletin describing suicide trends in the United Kingdom.
Occupation is reported at the time of death registration by the informant. We then code this information using the Standard Occupation Classification (SOC 2010). This classification system has 4 levels of granularity, ranging from higher-level groupings (for example, those working in skilled construction and building trades) to specific occupations (for example, bricklayers and masons).
The analyses were restricted to those aged 20 to 64 years. This approach improves the likely comparability between the occupation recorded at census (see Population data) and that at the time of death registration (Meltzer et al, 2008).
Population data
Population counts for occupations were obtained from the information collected at the 2011 Census. The census asks all those aged 16 to 74 years to specify their occupation; we then code this information using the SOC (volume 2010).
Due to the Standardised Mortality Ratios (SMRs) being calculated with mortality data for the 5-year period, 2011 to 2015, census population counts of the numbers of people employed in a particular occupation were multiplied by 5 to give an equivalent population at risk. Mortality rates for all usual residents in England were based on the mid-year population estimates for 2011, which were also multiplied by 5. This approach is comparable to that used in past occupational mortality work (Romeri et al, 2007).
Years of coverage
We base the analysis on suicides registered in England between 2011 to 2015 as this represents the approach used in past work (for example, Meltzer et al, 2008). This approach reduces the likelihood that sudden changes in occupational populations impact the analysis.
Back to table of contents11. Statistical measures of suicide by occupation
The method used in this work
The occupation-specific risks of suicide described in this bulletin are summarised using the Standardised Mortality Ratio (SMR). This shows whether the risk of suicide in a given occupation is lower or higher than expected given the rate of suicide among all usual residents in England. The SMRs were calculated using the method outlined by the Association of Public Health Observatories.
Other methods to measure suicide by occupation
Past studies on suicide by occupation (for example, Meltzer et al, 2008) have often used another measure of mortality, the proportional mortality ratio (PMR). The PMR measures whether the proportion of suicides amongst total deaths (that is, deaths from heart disease, cancer and so on) within a particular occupation is higher or lower than the national average. The PMR is a desirable method to use in the absence of population denominators; however, at best it should be considered as a preliminary or corroborative analysis tool (Bhopal, 2002). One problem with the PMR is, if a given occupation has low all-cause mortality, a high score on the PMR may merely reflect low mortality from all causes as opposed to there being any particular risk of suicide. As a clear example, in the findings reported in the accompanying data tables, male doctors are at high risk of suicide when looking at the PMR (PMR = 185). However, this finding conflicts with the SMR, which indicates that the risk of suicide among male doctors is low. The higher PMR in this instance is most likely due to low all-cause mortality among male doctors as opposed to there being a high risk of suicide. The conflict between findings when using the PMR and SMR has been similarly noted by other research studies (for example, Meltzer et al, 2008).
For reasons of simplicity, this bulletin describes results with reference to the SMR only. In the accompanying data tables we detail results from 2 additional methods: age-standardised rates and proportional mortality ratios. These other methods have been included for illustration purposes.
Back to table of contents12. Acknowledgements
The work described in this bulletin was commissioned by Public Health England. We would like to thank Professor David Gunnell for his substantial contribution to the writing of this publication in addition to Professor Louis Appebly and Professor Keith Hawton for their invaluable comments on this work.
Back to table of contents13. References
Agerbo E, Gunnell D, Bonde J, Mortensen P, and Nordentoft M (2007). Suicide and occupation: the impact of socio-economic, demographic and psychiatric differences. Psychological Medicine, 37, 1131 to 1140.
Australian Institute for Suicide Research and Prevention (2006). Suicide in Queensland’s Commercial Building and Construction Industry: An Investigation of Factors Associated with Suicide and Recommendations for the Prevention of Suicide. Griffith University, Mt Gravatt Campus: Nathan, Australia.
Bhopal R (2002). Concepts of Epidemiology. Oxford: Oxford University Press. Campaign Against Living Miserably (CALM) (2016). Masculinity Audit 2016: Understanding Modern Masculinity.
Department of Health (2012). Suicide prevention strategy for England.
Department of Health (2017). Suicide prevention: third annual report.
Goldney R D (2016). Suicide by health care professionals. The Medical Journal of Australia, 205, 257 to 258.
Hawton K, Agerbo E, Simkin S, Platt B, Mellanby R (2011). Risk of suicide in medical and related occupation groups: A national study based on Danish case population-based registers. Journal of Affective Disorders, 134, 320 to 326.
Hawton K, Clements A, Sakarovitch C, Simkin S, and Deeks J (2001). Suicide in doctors: a study of risk according to gender, seniority and speciality in medical practitioners in England and Wales, 1979-1995. Journal of Epidemiology & Community Health, 55, 296 to 300.
Hawton K, Clements A, Simkin S, and Malmberg A (2000). Doctors who kill themselves: a study of the methods used for suicide. QJM, 93, 351 to 357.
Hawton K, Simkin S, Rue J, Haw C, Barbour F, Clements A (2002). Suicide in female nurses in England and Wales. Psychological Medicine, 32, 239 to 250.
Heller T S, Hawgood J, and De Leo D (2007). Correlates of suicide in building industry workers. Archives of Suicide Research, 11, 105 to 117.
Hufford M (2001). Alcohol and suicidal behavior. Clinical Psychology Review, 21, 797 to 811. Kelly S, and Bunting J (1998). Trends in suicide in England and Wales, 1982-96. Population Trends, 92, 29 to 41.
Kõlves K and De Leo D (2013). Suicide in medical doctors and nurses: An analysis of the Queensland Suicide Register. The Journal of Nervous and Mental Disease, 201, 987 to 990.
Malmberg A, Simkin S and Hawton K (1999). Suicide in farmers. British Journal of Psychiatry, 175, 103 to 105.
McIntosh W, Spies E, Stone D, Lokey C, Trudeau A and Bartholow B (2016). Suicide rates by occupational group – 17 States, 2012. MMWR Morbidity and Mortality Weekly Report, 65, 643 to 645.
Meltzer H, Griffiths C, Brock A, Rooney C and Jenkis R (2008). Patterns of suicide by occupation in England and Wales: 2001-2005. The British Journal of Psychiatry, 193, 73 to 76.
Milner A, Maheen H, Bismark M and Spittal M (2016). Suicide by health professionals: a retrospective mortality study in Australia, 2001-2012. The Medical Journal of Australia, 205, 260 to 265.
Milner A, Niven H, LaMontagne, A (2015). Occupational class differences in suicide: evidence of changes over time and during the financial crisis in Australia. BMC Psychiatry, 15, 233
Milner A, Spittal M, Pirkis J and LaMontagne A (2013). Suicide by occupation: systematic review and meta-analysis. The British Journal of Psychiatry, 203, 409 to 416.
Office for National Statistics (2009). Occupational mortality in England and Wales, 1991-2000.
Office for National Statistics (2015). What are the top causes of death by age and gender?
Office for National Statistics (2016). Suicides in the UK: 2015 registrations.
Preti A, Biasi F and Miotto P (2001). Musical creativity and suicide. Psychological reports, 89, 719 to 727. Roberts S, Jaremin B and Lloyd K (2013). High risk occupations for suicide. Psychological Medicine, 43, 1231 to 1240.
Romeri E, Baker A and Griffiths C (2007). Alcohol-related deaths by occupation, England and Wales, 2001-05. Health Statistics Quarterly, 35, 6 to 12.
Simeonova D, Chang K, Strong C and Ketter T (2005). Creativity in familial bipolar disorder. Journal of Psychiatric Research, 39, 623 to 631.
Sher, L (2006). Alcohol consumption and suicide. QJM, 99, 57 to 61.
Skegg K, Firth H, Gray A and Cox B (2010). Suicide by occupation: does access to means increase risk? Australian and New Zealand Journal of Psychiatry, 44, 429 to 434.
Stack, S (1996). Gender and suicide risk among artists: A multivariate analysis. Suicide & Life-Threatening Behavior, 26, 374 to 379.
Welsh Government (2015). Talk to me 2: Suicide and self harm prevention strategy for Wales 2015-2020.
Back to table of contents