Table of contents
- Main points
- Introduction
- Things you need to know about this release
- Most deaths due to VSA are male
- VSA deaths have decreased in people aged under 20 years
- Scotland and North East England have an increased risk of VSA death
- Types of volatile substances
- Specific volatile substances
- Most VSA deaths do not involve drugs or alcohol
- Less than a third of VSA deaths are suicides
- Deaths involving helium increase
- Helium-related death most common in people aged 50 to 69 years
- Scotland has an increased risk of helium death
- Links to other information on volatile substance abuse
- Feedback
- Quality and methodology
- Further information
1. Main points
In 2016, there were 64 deaths related to volatile substances registered in Great Britain; over 80% of these volatile substance abuse (VSA) deaths were males.
There were 834 deaths involving volatile substances registered between 2001 and 2016.
The mortality rate has remained similar throughout the time period, with 1 VSA-related death per million population in 2016.
Residents of Scotland and North East England had an increased risk of death related to VSA, when compared with Great Britain overall.
There were 69 deaths involving helium in 2016 and 509 helium deaths in total between 2001 and 2016.
Helium-related deaths have increased over time, with a mortality rate of 1 death per million population in 2016.
2. Introduction
Volatile substance abuse (VSA) is defined by the European Monitoring Centre for Drugs and Drug Addiction (EMCDDA) as “the deliberate inhalation of volatile compounds to produce psychoactive effects”. Terms such as “glue sniffing” and “solvent abuse” have been used previously to define VSA, but are now regarded as inadequate descriptions of the range of substances abused. Volatile substances include, but are not limited to: fuel gases, aerosol propellants, some types of industrial glues, nitrous oxide, alkyl nitrites (known as “poppers”) and some anaesthetics.
This report describes trends in deaths involving volatile substances registered between 2001 and 2016 in Great Britain. Although helium, an inert gas, is not a volatile substance, the latter sections of this report describe trends in helium-related deaths.
Back to table of contents3. Things you need to know about this release
Figures are presented for deaths related to volatile substances (not including helium) and helium separately in Great Britain from 2001 onwards. The definition of a volatile substance abuse (VSA) death is based on the International Classification of Diseases (ICD) code assigned as the underlying cause of death. A list of the ICD codes included in the definition can be found in Quality and methodology (Section 17). These figures include accidents and suicides involving volatile substances, as well as deaths from abuse of and dependence on volatile substances.
It is important to be aware that 27% of all VSA deaths involve more than one substance (volatile or otherwise) and/or alcohol. On the death certificate it is not possible to tell which substance was primarily responsible for the death. Some VSA deaths are also counted as drug-related deaths (for example, one for which the cause of death was certified as “adverse effects of methadone, butane, propane, etizolam and phenazepam”).
The figures presented show deaths registered each year, rather than deaths occurring each year. Almost all drug-related deaths in England and Wales are certified by a coroner. Due to the length of time it takes a coroner to complete an inquest, many of the deaths registered in England and Wales in 2016 will have actually occurred prior to 2016. See the mortality metadata (PDF, 2.4MB) for more information on registration delays.
Nevertheless, at a Great Britain level, general trends in VSA deaths are broadly equivalent, regardless of whether the data are analysed by year of occurrence or year of registration. Figures based on registration year for smaller geographical areas (for example, Wales, Scotland and English regions) can be influenced by variations in registration delays and should be treated with caution.
Back to table of contents4. Most deaths due to VSA are male
There were 54 deaths related to volatile substance abuse (VSA) registered in Great Britain in 2001. This equated to a mortality rate of 0.9 deaths per million population. The mortality rate in 2016 was similar, at 1 death per million population (64 deaths). Between 2001 and 2016, the overall trend in mortality rate has remained fairly stable. Although Figure 1 shows some fluctuations in the mortality rate over time, none of these year-on-year changes are statistically significant.
Most (78%) of the VSA deaths registered between 2001 and 2016 were males (650 deaths). Figure 1 shows some peaks in the male mortality rate over the time period, such as an all-time high of 1.9 deaths per million population in 2013 (57 deaths). In contrast, the female mortality rate is more stable over time.
Figure 1: Age-standardised mortality rates for deaths related to volatile substance abuse, by sex
Deaths registered in 2001 to 2016, Great Britain
Source: Office for National Statistics and National Records of Scotland
Notes:
- Age-standardised mortality rates per 1 million population, standardised to the 2013 European Standard Population.
- Cause of death was defined using the International Classification of Diseases, Tenth Revision (ICD-10). More details can be found in the Background Notes at the end of this article.
- Figures are for deaths registered, rather than deaths occurring in each calendar year.
- Figures for Great Britain include deaths of non-residents.
- The mortality rate for females is not available for the 2008 registration year. Rates are not calculated where there are fewer than 3 deaths, as rates based on such low numbers are susceptible to inaccurate interpretation.
Download this chart Figure 1: Age-standardised mortality rates for deaths related to volatile substance abuse, by sex
Image .csv .xlsIn 2016, most (83%) of the VSA deaths were male (53 male deaths and 11 female deaths). Figure 2 shows that the proportion of VSA deaths that were male ranged from 70% (in 2003) to 94% (in 2008) across the time period.
Figure 2: Number of deaths related to volatile substance abuse, by sex
Deaths registered in 2001 to 2016, Great Britain
Source: Office for National Statistics and National Records of Scotland
Notes:
- Cause of death was defined using the International Classification of Diseases, Tenth Revision (ICD-10). More details can be found in the Background Notes at the end of this article.
- Figures are for deaths registered, rather than deaths occurring in each calendar year.
- Figures for Great Britain include deaths of non-residents.
Download this chart Figure 2: Number of deaths related to volatile substance abuse, by sex
Image .csv .xls5. VSA deaths have decreased in people aged under 20 years
Between 2001 and 2016, volatile substance abuse (VSA) deaths were most common overall in those aged 20 to 39 years, with 46% of VSA deaths occurring in this age group. Deaths associated with volatile substances in people aged 70 years and over have remained uncommon, accounting for 3% of all VSA deaths.
Over the time period, the age composition of deaths related to VSA has changed. In 2001, more than half (52%) of the VSA deaths were in people aged under 20. Over time the number of deaths in this age group has decreased by 71%. Deaths related to VSA in the 40 to 69 age group have increased over time, from 15% of all VSA deaths in 2001 to 41% in 2016.
Back to table of contents6. Scotland and North East England have an increased risk of VSA death
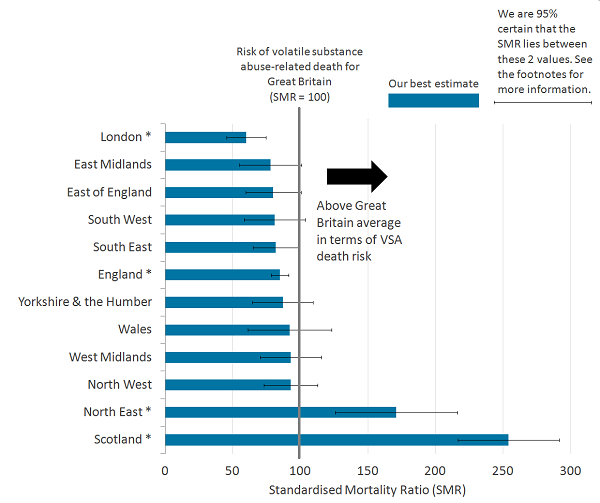
The figures in this section are based on the standardised mortality ratio (SMR). This commonly-used measure of mortality establishes whether the number of volatile substance abuse (VSA) deaths in a particular geographical area (country or region) is high or low relative to patterns of VSA deaths in the broader population of Great Britain. This takes into account the age distribution of people usually resident in each area. Using age-specific rates of VSA-related deaths in Great Britain we can calculate how many VSA deaths would be expected in a given area should the overall pattern of these types of deaths in Great Britain hold. We then compare the actual number of VSA deaths for a particular area with the national (Great Britain) average.
Figure 3 shows that people usually resident in Scotland had the highest risk of VSA-related death between 2001 and 2016. Usual residents of Scotland had a 2.5 times higher risk of dying from VSA than the Great Britain average. North East England had the second-highest risk, at 71% above the national average.
England overall had a significantly lower risk of VSA-related death than the Great Britain average. Usual residents of England had a 15% reduced risk of VSA death. Within England, the only region to have a reduced VSA-death risk was London. Out of all the countries and regions in Great Britain, Londoners had the lowest risk of dying from VSA, with a 40% lower risk than Great Britain overall.
The remaining areas did not have a statistically different risk of VSA-related death than the national average.
Figure 3: Standardised mortality ratios (SMRs) for deaths related to volatile substance abuse, by country and region
Deaths registered in 2001 to 2016, Great Britain
Source: Office for National Statistics and National Records of Scotland
Notes:
- The standardised mortality ratio (SMR) is a common measure of mortality. The dashed line shows the level of VSA-related deaths among all usual residents in Great Britain (SMR=100). When the value of the SMR is above 100, the risk of VSA-related death is higher than that in the broader population of Great Britain. When the value is below 100, the risk of VSA-related death is lower than that in the broader population.
- Error bars show the lower and upper confidence limits. When the range of the upper and lower confidence limits exclude 100, the risk of VSA-related death for a given area is statistically different to that observed in the broader population of Great Britain. Asterisks (*) indicate where an area is statistically different.
- Cause of death was defined using the International Classification of Diseases, Tenth Revision (ICD-10). More details can be found in the Background Notes at the end of this article.
- Figures are for deaths registered, rather than deaths occurring in each calendar year.
- Figures for England, English regions, and Wales exclude deaths of non-residents and are based on postcode boundaries as of November 2017.
Download this image Figure 3: Standardised mortality ratios (SMRs) for deaths related to volatile substance abuse, by country and region
.png (53.4 kB) .xls (32.3 kB)
7. Types of volatile substances
Due to data availability, Sections 7 and 8 refer to usual residents of England and Wales, rather than Great Britain. Broad groups of volatile substances mentioned on death certificates are shown in Table 1. Over half (56%) of all volatile substance abuse (VSA) deaths between 2001 and 2016 involved a fuel. The next most common group of volatile substances was nitrogen-related, with 12% of deaths mentioning nitrogen or nitrous oxide on the death certificate. Of all VSA deaths, 10% involved a volatile substance that was not specified on the certificate.
Table 1: Number of volatile substance abuse-related deaths where selected substances were mentioned on the death certificate, deaths registered in England and Wales, 2001 to 2016
| Substance Category4 | Number of deaths1 | Percentage of all VSA deaths1 | |
|---|---|---|---|
| Fuels | 366 | 56 | |
| Nitrogen-related | 79 | 12 | |
| Aerosols | 45 | 7 | |
| Specified Solvents | 39 | 6 | |
| Anaesthetic | 34 | 5 | |
| Alkyl nitrites | 18 | 3 | |
| Other volatile substance, specified | 10 | 2 | |
| Volatile substance, unspecified5 | 68 | 10 | |
| Source: Office for National Statistics | |||
| Notes: | |||
| 1. Counts total to more than the total number of VSA deaths, and percentages total to more than 100%, because more than one substance group can be involved in a single death. | |||
| 2. Figures are for deaths registered, rather than deaths that occurred, between 2001 and 2016. | |||
| 3. Figures for England & Wales include deaths of non-residents. | |||
| 4. Specific substances included in each category are listed in the Quality and methodology. | |||
| 5. The unspecified substance category includes all mentions of volatile substance abuse and solvent abuse where the specific volatile substance/solvent was not stated. | |||
Download this table Table 1: Number of volatile substance abuse-related deaths where selected substances were mentioned on the death certificate, deaths registered in England and Wales, 2001 to 2016
.xls (33.8 kB)Across years 2001 to 2015 (but not 2016), fuels was the most commonly mentioned category of volatile substance. In 2013, mentions of nitrogen-related substances started to increase, reaching a peak of 23 deaths in 2016 (compared with 19 deaths involving fuels). Mentions of the other substance categories in Table 1 have remained fairly stable over time.
Back to table of contents8. Specific volatile substances
Table 2 shows the number of deaths associated with specific volatile substances. The three most commonly mentioned volatile substances are fuels: butane (191 deaths between 2001 and 2016), propane (68 deaths) and lighter fuel (47 deaths). The most common of these fuels, butane, was mentioned in 29% of all volatile substance abuse (VSA) deaths between 2001 and 2016. After butane, propane and lighter fuel, nitrogen was the next most common specific volatile substance, involved in 7% of all VSA deaths.
In 10% of VSA deaths an unspecified volatile substance (25 deaths) or unspecified solvent (43 deaths) was mentioned on the death certificate, therefore the specific substance involved is unknown.
Table 2: Number of volatile substance abuse-related deaths where specific substances were mentioned on the death certificate, deaths registered in England and Wales, 2001 to 2016
| Substance | Number of deaths where the substance was mentioned | ||||||
|---|---|---|---|---|---|---|---|
| Fuels | |||||||
| Butane | 191 | ||||||
| Propane | 68 | ||||||
| Lighter Fuel | 47 | ||||||
| Lighter gas | 38 | ||||||
| Gas | 22 | ||||||
| LPG | 14 | ||||||
| hydrocarbon | 5 | ||||||
| Petrol fumes | 5 | ||||||
| Fuel gas | 3 | ||||||
| Other specified fuels5 | 4 | ||||||
| Nitrogen Products | |||||||
| Nitrogen6 | 43 | ||||||
| Nitrous Oxide | 36 | ||||||
| Aerosols | |||||||
| Aerosol (otherwise unspecified) | 24 | ||||||
| Deodorant | 15 | ||||||
| Other specified aerosol7 | 6 | ||||||
| Specified Solvents | |||||||
| Toluene | 9 | ||||||
| Acetone | 8 | ||||||
| White Spirit | 8 | ||||||
| Dichloromethane | 6 | ||||||
| Glue (otherwise unspecified) | 3 | ||||||
| Other specified solvents8 | 5 | ||||||
| Anaesthetics | |||||||
| Chloroform | 23 | ||||||
| Isoflurane | 6 | ||||||
| Sevoflurane | 4 | ||||||
| Anaesthetic drug (otherwise unspecified) | 1 | ||||||
| Alkyl Nitrates | |||||||
| Alkyl Nitrites | 15 | ||||||
| Amyl Nitrate | 2 | ||||||
| Isobutyl Nitrate | 2 | ||||||
| Other specified VSA | |||||||
| Trichloroethanol | 7 | ||||||
| Chlorodifluoromethane | 1 | ||||||
| Printer cleaner | 1 | ||||||
| VSA, unspecified | |||||||
| Solvent unspecified | 43 | ||||||
| VSA unspecified | 25 | ||||||
| Source: Office for National Statistics | |||||||
| Notes: | |||||||
| 1. Counts total to more than the total number of VSA deaths, because more than one substance group can be involved in a single death. | |||||||
| 2. Because a single death can involve more than 1 VSA, the total of the categories (e.g. fuels) in Table 2 will not sum to the figures in Table 1. For example, a death containing Butane and Propane would be counted in each substance but would only by counted once in the Table 1 fuel category. | |||||||
| 3. Figures are for deaths registered, rather than deaths that occurred, between 2001 and 2016. | |||||||
| 4. Figures for England & Wales include deaths of non-residents. | |||||||
| 5. Other specified fuels include: diethyl ether, lighter fluid, insecticide, fuel cleaner. | |||||||
| 6. Mentions of 'nitrogen' have been included for completeness, as many of these may be nitrous oxide. | |||||||
| 7. Other specified aerosols include: air freshener, hairspray, bug spray, fabric protection spray. | |||||||
| 8. Other specified solvents include: trichloroethylene, turpentine, isopropyl alcohol. | |||||||
Download this table Table 2: Number of volatile substance abuse-related deaths where specific substances were mentioned on the death certificate, deaths registered in England and Wales, 2001 to 2016
.xls (37.4 kB)9. Most VSA deaths do not involve drugs or alcohol
Almost three-quarters (73%) of volatile substance abuse (VSA) deaths registered in Great Britain involved volatile substances alone, meaning there were no mentions of alcohol or other non-volatile substances on the death certificate.
In 21% of VSA deaths at least one drug (non-volatile substance) was mentioned in addition to the volatile substance. These drugs can include legal and illegal drugs, prescription drugs (either prescribed to the individual or obtained by other means) and over-the-counter medications. Alcohol was involved in 12% of VSA deaths. Please note these proportions of deaths sum to more than 100% because some deaths (such as a VSA death involving another drug and alcohol) are included in both the 21% and the 12%.
Back to table of contents10. Less than a third of VSA deaths are suicides
Between 2001 and 2016, the majority of volatile substance abuse (VSA) deaths registered had an underlying cause of mental and behavioural disorders or accidental poisoning, with these two causes accounting for 35% of VSA deaths each. Intentional self-harm and undetermined intent were the cause in 21% and 9% of deaths, respectively.
The National Statistics definition of suicide includes all deaths from intentional self-harm for persons aged 10 and over, and deaths where the intent was undetermined for those aged 15 and over. Using this definition, 30% of VSA deaths were suicides. Suicide involving volatile substances was less common in women than men, accounting for 18% of VSA deaths in women versus 33% in men.
The number of VSA suicides has increased in males over time from 5 male suicides in 2001 to 23 in 2016. The proportion of male VSA deaths that were suicides rose from 13% in 2001 to 43% in 2016. VSA suicides in females have remained stable, ranging between 0 and 5 deaths per year, between 2001 and 2016. The proportion of VSA deaths that are suicides increases with age, from 13% of VSA deaths in the under-20 age group, to over 70% of VSA deaths in people aged 70 years and over.
Back to table of contents11. Deaths involving helium increase
Although helium, an inert gas, is not a volatile substance, the following sections will discuss deaths involving helium. In Great Britain there were 509 deaths related to helium registered between 2001 and 2016. Over time the number of deaths has increased from 2 deaths in 2001, to a peak of 82 in 2014, before decreasing to 69 in 2016. This equates to a mortality rate of 1 death per million population in 2016.
Figure 4 presents mortality rates from 2007 onwards, due to low numbers of deaths in earlier years. Comparing the rates over this time period, the rate of helium-related death was 11 times greater in 2016 than 2007. Figures 4 and 5 show that most of this increase in mortality rate is due to increasing male helium deaths over time. In 2014, the mortality rate for males peaked at 2.3 deaths per million population (73 deaths), before decreasing to 1.8 deaths per million population (57 deaths) in 2016. In contrast, the female mortality rate first peaked at 0.4 deaths per million population (11 deaths) in 2011 and has remained stable since then. Across the 2001 to 2016 time period, 84% of helium-related deaths were males.
Figure 4: Age-standardised mortality rates for deaths related to helium, by sex
Deaths registered in 2007 to 2016, Great Britain
Source: Office for National Statistics and National Records of Scotland
Notes:
- Age-standardised mortality rates per 1 million population, standardised to the 2013 European Standard Population.
- Cause of death was defined using the International Classification of Diseases, Tenth Revision (ICD-10). More details can be found in the Background Notes at the end of this article.
- Figures are for deaths registered, rather than deaths occurring in each calendar year.
- Figures for Great Britain include deaths of non-residents.
- Rates are not calculated where there are fewer than 3 deaths, as rates based on such low numbers are susceptible to inaccurate interpretation. Therefore data for 2001 to 2008 for females, and 2001 to 2006 for males and persons, is not shown here. Death counts for these years are available to download in excel format.
Download this chart Figure 4: Age-standardised mortality rates for deaths related to helium, by sex
Image .csv .xls
Figure 5: Number of deaths related to helium by sex
Deaths registered in 2001 to 2016, Great Britain
Source: Office for National Statistics and National Records of Scotland
Notes:
- Cause of death was defined using the International Classification of Diseases, Tenth Revision (ICD-10). More details can be found in the Background Notes at the end of this article.
- Figures are for deaths registered, rather than deaths occurring in each calendar year.
- Figures for Great Britain include deaths of non-residents.
Download this chart Figure 5: Number of deaths related to helium by sex
Image .csv .xls13. Scotland has an increased risk of helium death
The figures in this section are based on standardised mortality ratios (SMRs), which are described at the start of Section 6.
Compared with the Great Britain average, residents of Scotland had an increased risk of helium death. Figure 6 shows that people living in Scotland had a 39% increased risk of death by helium than the Great Britain average.
North East England had a significantly reduced risk of helium death, compared with the Great Britain average. People living in the North East had a 54% lower risk of helium death than Great Britain as a whole. The rest of the regions and countries within Great Britain did not significantly differ from the average risk of helium death.
Figure 6: Standardised mortality ratios (SMRs) for deaths related to helium, by country and region
Deaths registered in 2001 to 2016, Great Britain

Source: Office for National Statistics and National Records of Scotland
Notes:
- The standardised mortality ratio (SMR) is a common measure of mortality. The dashed line shows the level of helium-related deaths among all usual residents in Great Britain (SMR=100). When the value of the SMR is above 100, the risk of helium-related death is higher than that in the broader population of Great Britain. When the value is below 100, the risk of helium-related death is lower than that in the broader population.
- Error bars show the lower and upper confidence limits. When the range of the upper and lower confidence limits exclude 100, the risk of helium-related death for a given occupation is statistically different to that observed in the broader population of Great Britain. Asterisks (*) indicate where an area is statistically different.
- Cause of death was defined using the International Classification of Diseases, Tenth Revision (ICD-10). More details can be found in the Background Notes at the end of this article.
- Figures are for deaths registered, rather than deaths occurring in each calendar year.
- Figures for England, English regions, and Wales exclude deaths of non-residents and are based on postcode boundaries as of November 2017.
Download this image Figure 6: Standardised mortality ratios (SMRs) for deaths related to helium, by country and region
.png (46.6 kB) .xls (32.3 kB)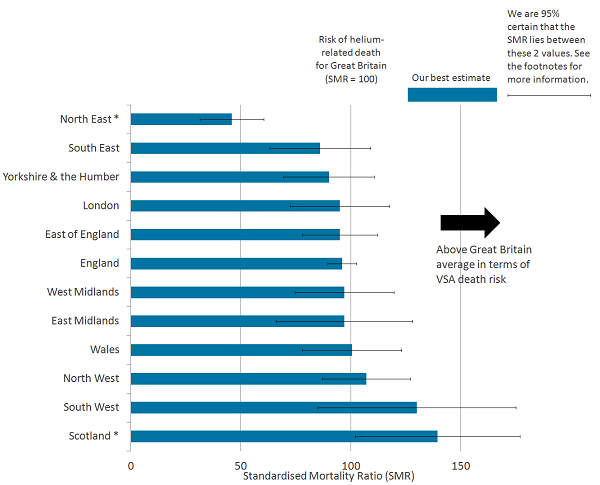
14. Links to other information on volatile substance abuse
The Adult Psychiatric Morbidity Survey (APMS) provides estimates of the prevalence of lifetime experience of volatile substance use, use in the past year and dependence in the past year for England.
The Smoking, Drinking and Drug Use Among Young People in England report contains the results of an annual survey of secondary school pupils. The data include estimates of the proportion of pupils who have used volatile substances ever, in the last year and in the last month. Information on the usual frequency of substance use, pupils’ age at first use, whom pupils used volatile substances with, and where the substances were bought, are also available.
Back to table of contents15. Feedback
We would like to involve customers and stakeholders in the development of these statistics. Any feedback can be sent to mortality@ons.gov.uk.
We are looking to further develop statistics on volatile substances. An example of this is to look at the way the substance categories have been constructed. Any comments on how specific substances should be grouped are welcomed. We will also be looking at methods to capture more information for future publications. For example, if the deceased died of butane poisoning from using an aerosol can of hairspray, then we would like to capture as much of that information as possible without double-counting the deaths.
A small number of deaths (4% of all VSA-related deaths in England and Wales) that involved volatile substances have been included, but the death would not be deemed due to substance abuse. These deaths are most likely due to using a volatile substance without proper ventilation. We need to investigate whether these deaths should or should not be included in these estimates.
Back to table of contents16. Quality and methodology
Mortality database
Volatile substance abuse and helium deaths are identified as such on the basis of information from coroners’ inquests in England and Wales and from doctors, pathologists and procurators fiscal in Scotland. To facilitate research into these deaths, Office for National Statistics (ONS) has developed a database, which is a subset of the national mortality database for England and Wales.
Deaths are included if the underlying cause of death is regarded as volatile substance abuse (VSA)-related (or helium-related), according to the definition (see note on Definition of a VSA or helium death). Once this extract is taken, the data are processed in a statistical package called SAS.
Firstly, up to 10 variables are created showing which volatile substances are mentioned on the death certificate. Similarly, up to 10 variables are created showing any death certificate mentions of drugs. Then a variable is created showing whether alcohol was mentioned. This includes a wide variety of scenarios ranging from evidence of alcohol consumption around the time of death (for example, an empty vodka bottle found at the scene, mention of the deceased having been to the pub or alcohol found after toxicology tests) to long-term alcohol abuse and cirrhosis of the liver. The data are then formatted and output into Excel workbooks.
Every record is then manually checked by examining the text on the death certificate to ensure the SAS program has coded the data correctly. Once the manual checking is finished and corrections made if needed, the dataset is expanded to include variables that show which categories of volatile substances were on the death certificate (see note on Substance categories). Uniform formatting is then applied; this makes it easier to search the database.
Mortality metadata
Further information about the underlying mortality data for England and Wales, including details on how the data is collected and coded, is available in the mortality metadata (PDF, 2.4MB).
Data for deaths registered in Scotland was kindly provided by National Records of Scotland (NRS).
Definition of a VSA or helium death
Deaths are included where the underlying cause of death was one of those in Table 3 and at least one volatile substance (or helium) was mentioned in the (for example) coroner’s text.
Table 3: International Classification of Diseases, Tenth Revision (ICD-10) codes used to define deaths related to volatile substance abuse and helium
| Description | ICD-10 Codes |
|---|---|
| Mental and behavioural disorders due to psychoactive substance use (excluding tobacco) | F11 – F16, F18- F19 |
| Accidental poisoning by and exposure to noxious substances (excluding alcohol) | X40 – X44, X46 – X49 |
| Intentional self-harm (excluding alcohol) | X60 – X64, X66 – X69 |
| Assault | X85 – X90 |
| Event of undetermined intent (excluding alcohol) | Y10 – Y14, Y16 – Y19 |
| Source: Office for National Statistics | |
Download this table Table 3: International Classification of Diseases, Tenth Revision (ICD-10) codes used to define deaths related to volatile substance abuse and helium
.xls (32.3 kB)A small number of deaths have been included, where volatile substances were involved but the death would not be deemed due to substance abuse (for example, death due to using a volatile substance without proper ventilation). For the period 2001 to 2016, there were 24 deaths in England and Wales that would not be considered substance abuse, 4% of the volatile substance deaths registered.
Datasets containing the data used to produce Figures 1 and 4 are available to download. Mortality rates are presented as deaths per million population, directly age-standardised to the European standard population. The upper and lower confidence limits form a confidence interval, which is a measure of the statistical precision of an estimate and shows the range of uncertainty around the estimated figure. Calculations based on small numbers of events are often subject to random fluctuations. As a general rule, if the confidence interval around one figure overlaps with the interval around another, we cannot say with certainty that there is more than a chance difference between the two figures.
Datasets containing the data used to produce Figures 3 and 6 are available to download. Standardised mortality ratios (SMRs) and confidence intervals are presented. When the SMR is greater than 100, the risk of death is higher than that in the broader population of Great Britain. When the value is less than 100, the risk of death is lower than that in the broader population.
Please note, findings based on the SMR cannot be used to infer causality. The lower and upper confidence limits form a confidence interval, which is a measure of the statistical precision of an estimate and shows the range of uncertainty around the estimated figure. Calculations based on small numbers of events are often subject to random fluctuations and consequentially the range of the lower and upper limits are wider. When the range of the upper and lower confidence limits excludes 100, the risk of death for a given geographic area is statistically different to that observed in the broader population of Great Britain.
Substance categories
Substance categories used in Sections 5 and 6 of this article are defined in Table 4.
Table 4: Substances mentioned on the death certificate included in substances categories
| Substance Category | Substances mentioned on the death certificate | |||||||
|---|---|---|---|---|---|---|---|---|
| Fuels | Butane, calor gas, diethyl ether, fuel cleaner, fuel gas, gas, hydrocarbon, insecticide, lighter fluid, lighter fuel, lighter gas, LPG, petrol fumes, propane | |||||||
| Aerosol | Aerosol, air freshener, bug spray, deodorant, fabric protection spray, hairspray | |||||||
| Nitrogen-related | ‾‾‾‾‾‾‾‾ | Nitrogen, nitrous oxide | ||||||
| Anaesthetic | Anaesthetic drug, chloroform, isoflurane, sevoflurane | |||||||
| Alkyl Nitrites | Alkyl nitrite, amyl nitrate, isobutyl nitrate | |||||||
| Specified solvents | ‾‾‾‾‾‾‾‾ | Acetone, dichloromethane, glue, isopropyl alcohol, methylene chloride, toluene, trichloroethylene, turpentine, white spirit | ||||||
| Other volatile substance, specified | Chlorodifluoromethane, printer cleaner | |||||||
| Volatile substance, unspecified | ‾‾‾‾‾‾‾‾ | Volatile substance, solvent | ||||||
| Source: Office for National Statistics | ||||||||
Download this table Table 4: Substances mentioned on the death certificate included in substances categories
.xls (33.8 kB)17. Further information
Special extracts and tabulations of deaths data are available to order for a charge (subject to legal frameworks, disclosure control and agreement of costs, where appropriate). Such requests or enquiries should be made to:
Mortality Analysis Team, Health Analysis and Life Events Division
Office for National Statistics
Government Buildings
Cardiff Road
Newport
South Wales NP10 8XG
Tel: +44 (0)1633 456022
Email: mortality@ons.gov.uk
The ONS charging policy (PDF, 65KB) is available.
Back to table of contents