Table of contents
- Main points
- Statistician’s quote
- Things you need to know
- Completed family size is declining
- By the end of their childbearing years 17% of women born in 1970 remained childless
- Teenage childbearing is in decline
- Increase in number of 1-child families, while 2-child families remain most common
- The age pattern of fertility is changing
- Links to related statistics
- Quality and methodology
1. Main points
The average completed family size for women born in 1970, and reaching age 45 in 2015, was 1.91 children per woman. This compares with their mothers’ generation, represented by women born in 1943, who had on average 2.24 children.
2 children was the most common family size for women born in both 1943 and 1970.
The level of childlessness among women born in 1970 (17%) is higher than for women born in 1943 (12%).
1 in 10 women born in 1970 had 4 or more children, compared with around 1 in 7 women born in 1943.
Women born in 1985 – the most recent cohort to reach age 30 – have had slightly fewer children on average by their 30th birthday than women born in 1970, with 1.02 and 1.10 children respectively.
Back to table of contents2. Statistician’s quote
“Women born in 1970 who completed their childbearing in 2015 had an average 1.91 children per woman, fewer than their mother’s generation (born 1943) who had 2.24 children. Childlessness was higher for the 1970 cohort (17%) than for the 1943 cohort (12%)”.
Pamela Cobb, Population Statistics Division, Office for National Statistics.
Follow Population Statistics Division on Twitter @PaulVickers_ONS
Back to table of contents3. Things you need to know
This release presents statistics on childbearing among women in England and Wales by the year of birth of the mother, rather than year of birth of the child. A group of women with the same year of birth are referred to as a “cohort” throughout.
“Cohort fertility” analyses compare the fertility levels of current generations of women of childbearing age with previous generations. This covers changes in average family size, levels of childlessness, and the proportions of women having one, two or more children.
A woman’s childbearing is assumed to start at age 15 and end at the age of 45 (the day before her 46th birthday). The estimates have been updated with 2015 births, which means that completed family size for women born in 1970 (women reaching age 45 in 2015) is presented for the first time. Women born in 1985, who reached age 30 in 2015, are also used as a comparison group, as age 30 may be considered the mid-point of a woman’s childbearing years.
The ages of women are presented in “exact years”. Therefore figures should be interpreted as the average number of children a woman has had up to that birthday. So childbearing up to exact age 30 includes cumulative fertility through her lifetime up to the day before her 30th birthday. Any childbearing in the 12 months from her 29th birthday onwards will be included in fertility up to exact age 30.
Back to table of contents4. Completed family size is declining
Table 1 shows the average family size and estimated family size distribution for women who have completed their childbearing years in 2015, and of the cohort assumed to be their mothers. The 1943 cohort is assumed to be their mothers' generation because the average age of mothers giving birth in 1970 was 27 years, and so women of that age were assumed to be born in 1943.
The completed family size of the 1970 cohort is much smaller than for the 1943 cohort, and the proportion of women remaining childless is much higher for the 1970 cohort.
Table 1: Average family size and estimated family size distribution for women who have completed their childbearing, by year of birth of women, selected cohorts
| England and Wales, 2015 | |||||||
| Number of live-born children (percentages) 1 | |||||||
|---|---|---|---|---|---|---|---|
| Year of birth of woman2 | Average completed family size | 0 | 1 | 2 | 3 | 4+ | Total3 |
| 1943 | 2.24 | 12 | 12 | 40 | 21 | 15 | 100 |
| 1970 | 1.91 | 17 | 18 | 37 | 17 | 10 | 100 |
| Source: Office for National Statistics | |||||||
| Notes: | |||||||
| 1. Percentage of women with 0, 1, 2, 3 or 4+ children who have completed their families. | |||||||
| 2. The 1970 cohort is the latest group assumed to have completed their childbearing. The 1943 cohort is assumed to be their mothers' generation because the average age of mothers giving birth in 1970 was 27 years, and women of that age were born in 1943. | |||||||
| 3. Figures may not add exactly due to rounding. | |||||||
Download this table Table 1: Average family size and estimated family size distribution for women who have completed their childbearing, by year of birth of women, selected cohorts
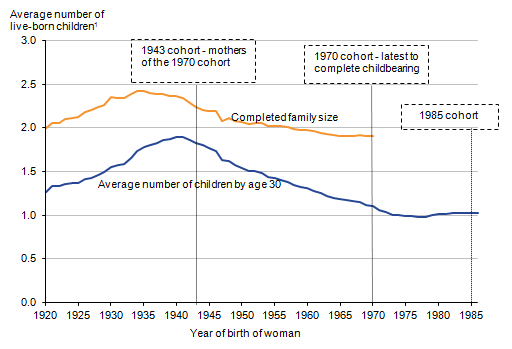
.xls (27.6 kB)Figure 1 shows the average number of live-born children (completed family size) for women who are assumed to have completed their childbearing. This is a cumulative measure derived from summing the fertility rates of female birth cohorts at each age from 15 to 45 and over. The 1970 cohort had on average 1.91 children, unchanged from the 1969 cohort and similar to recent previous cohorts. Average completed family size peaked at 2.42 children for women born in 1935, and has been falling since. Women belonging to the 1958 cohort were the first estimated to have an average completed family size of fewer than 2 children over their childbearing lifetime. This decrease in the average family size is mainly due to rising levels of childlessness.
Figure 1: Average number of live-born children by age 30 and completed family size, by year of birth of woman, 1920 to 1986
England and Wales
Source: Office for National Statistics
Download this image Figure 1: Average number of live-born children by age 30 and completed family size, by year of birth of woman, 1920 to 1986
.png (18.0 kB) .xls (33.8 kB)
The average number of live-born children that women have by their 30th birthday gives an indication of more recent trends in family size, although as women delay childbearing to older ages, the number of live-born children a woman may have by her 30th birthday will become less indicative of trends in family size.
Overall, women born in the 1960s and 1970s had fewer children by age 30 than previous generations. The 1970 cohort had 1.10 children on average by their 30th birthday, compared with 1.83 by the same age for their mother’s generation, the 1943 cohort. This reflects their postponement of childbearing to older ages, for reasons including:
- increased participation in higher education1
- delayed marriage and partnership formation2
- the desire to establish a career, get on the housing ladder and ensure financial stability before starting a family1
There has been a slight upturn in average family size by the 30th birthday, from 0.98 children for the 1978 cohort to 1.02 for the 1982 cohort. Since the 1982 cohort the level has remained unchanged up to the 1985 cohort.
This is mainly because women from all cohorts between 1979 and 1985 have had higher fertility rates in their late twenties than those born in 1978. Possible reasons for this increase include the changes in support for families introduced by previous governments (such as tax credits and maternity or paternity leave)2,3 and the increasing proportion of women aged 25 to 29 who were born outside the UK (with fertility above the UK-born average)4.
Notes for Completed family size is declining:
- Ni, Bhrolchain, M, Beaujouan, E (2012) Fertility postponement is largely due to rising educational enrolment, Population Studies, Volume 66, issue 3, pp. 311-327.
- Jefferies, J (2008), Fertility assumptions for the 2006-based national population projections (297 Kb Pdf), Population Trends, no 131, pp 18-27.
- 2014-based Fertility assumptions for the national population projections.
- Zumpe, J, Dormon, O, and Jefferies, J (2012) Childbearing among UK born and non-UK born women living in the UK. Office for National Statistics. Dormon, O (2014) Childbearing of UK and non-UK born women living in the UK, 2011 Census data. Office for National Statistics.
5. By the end of their childbearing years 17% of women born in 1970 remained childless
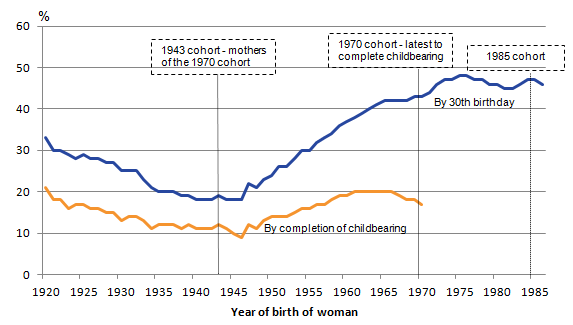
Around 1 in 6 women born in 1970 remained childless by the end of their childbearing years compared with 1 in 8 women born in 1943. The level of childlessness is relatively high for the women born in 1970 compared to their mother’s generation (1943), although comparable levels have been seen before during the 1920s. Although there has been a small drop in childlessness for the more recent cohorts completing their childbearing, overall, levels of childlessness have been higher for the cohorts born between the mid 1950s to 1970 than for earlier generations. This may be due to a decline in the proportion of women married, changes in the perceived costs and benefits of childrearing versus work and leisure activities, greater social acceptability of a childfree lifestyle and the postponement of decisions about whether to have children until it may be biologically too late (see section note 1).
Figure 2: Percentage of women remaining childless by their 30th birthday and completion of childbearing, by year of birth of woman, 1920 to 1986
England and Wales
Source: Office for National Statistics
Download this image Figure 2: Percentage of women remaining childless by their 30th birthday and completion of childbearing, by year of birth of woman, 1920 to 1986
.png (17.0 kB) .xls (51.2 kB)
On their 30th birthday, 47% of the 1985 cohort were childless, a higher proportion than for the 1970 cohort at the same age (43%). This highlights the trend that women have been increasingly delaying having children to older ages.
The level of childlessness by age 30 for the 1985 cohort is unchanged from the level seen in 2014 for the 1984 cohort.
Prior to 2014 the level of childlessness at age 30 had been falling for successive cohorts born from 1975 to 1982. The level of childlessness then started to increase but has levelled off over the last 2 years suggesting the recent increases may not continue. The level of childlessness by age 30, seen for the 1985 cohort, remains similar to the pre-1975 level.
Notes for By the end of their childbearing years 17% of women born in 1970 remained childless:
- For reasons for increasing childlessness, see for example:
- O'Leary L, Natamba E, Jefferies J and Wilson, B (2010) Fertility and partnership status in the last two decades, Population Trends 140, page 5-35
- Simpson, R (2009) Delayed childbearing and childlessness in Britain, in Stillwell, J, Kneale, D and Coast, E (eds.) Fertility, Living Arrangements, Care and Mobility: Understanding Population Trends and Processes Volume 1, Springer, Dordrecht, pp. 23-40.
- Kneale, D, Joshi H (2008) Postponement and childlessness: Evidence from two British cohorts volume 19, article 58, (2008)
- Basten, S (2009). Voluntary childlessness and being Childfree. The Future of Human Reproduction: Working Paper #5.
- Berrington, A.M. (2004). Perpetual postponers? Women's, men's and couple's fertility intentions and subsequent fertility behaviour. Population Trends 117: 9-19.
6. Teenage childbearing is in decline
The proportion of women who have had a child by age 20 has been gradually decreasing for recent cohorts. From a peak of around 1 in 5 for women born in 1952, it has declined to 1 in 14 women for those born in 1995, the most recent cohort to reach age 20. This shows that the proportion of women becoming teenage mothers is falling, though the level of teenage motherhood remains the same as that of the cohorts born in the early 1920s when around 7% of women had a child by age 20. This fall in the proportion of teenagers becoming mothers has accompanied recent falls in the annual number of teenage conceptions.
Conception statistics include all pregnancies of women usually resident in England and Wales which lead to either a live birth, stillbirth or an abortion under the 1967 Act. The most recent figures on under-18 conception rates for England and Wales show that in 2014 the rate was 22.9 conceptions per thousand women aged 15 to 17, which is the lowest level since records began in 1969 (a decrease of almost 50% since then). Teenage conception and birth rates are used widely as outcome indicators in the sexual health context.
Figure 3: Percentage of women who have had a child by their 20th1 birthday, by year of birth of woman, 1920 to 1996
England and Wales
Source: Office for National Statistics
Notes:
- The ages of women are presented in 'exact years'. Therefore figures should be interpreted as the proportion of women who have had at least one live birth by that age.
Download this chart Figure 3: Percentage of women who have had a child by their 20th^1^ birthday, by year of birth of woman, 1920 to 1996
Image .csv .xls7. Increase in number of 1-child families, while 2-child families remain most common
While the 2-child family remains the most common family type in England and Wales, with 37% of women born in 1970 having 2 children, the prevalence is below the peak of 44% for the 1950 cohort.
Figure 4: Estimated family size distribution for women born between 1920 and 1970 who are assumed to have completed their childbearing, 1920 to 1970
England and Wales
Source: Office for National Statistics
Download this chart Figure 4: Estimated family size distribution for women born between 1920 and 1970 who are assumed to have completed their childbearing, 1920 to 1970
Image .csv .xlsThe 1-child family was the second most common family size for the 1970 cohort at 18%. This is comparable to cohorts born in the 1920s and 1930s.
Families with no children or families with 3 children were the next most common for women born in 1970 at 17% each. Only 1 in 10 women born in 1970 had four or more children, compared with nearly 1 in 5 in the 1940 cohort.
Back to table of contents8. The age pattern of fertility is changing
The fertility rates of selected cohorts at particular age milestones highlight how the age distribution of women giving birth has changed over time.
Figure 5: Age-specific fertility rates at selected ages, by year of birth of woman, 1920 to 1995
England and Wales

Source: Office for National Statistics
Download this image Figure 5: Age-specific fertility rates at selected ages, by year of birth of woman, 1920 to 1995
.png (27.6 kB) .xls (32.3 kB)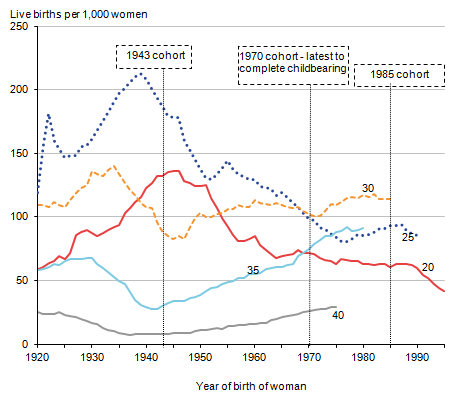
The 1970 cohort experienced their highest fertility rate at the age of 30, closely followed by age 25. The 1970 cohort are the first cohort for which fertility is higher at age 30 than at age 25, this pattern has continued for later cohorts. Lower fertility rates were recorded at ages 35 and 20, while the number of live births per 1,000 women at the age of 40 was lower still.
In comparison with the 1943 cohort, the 1970 cohort had much lower fertility at ages 20 and 25. At older ages, the 1970 generation had higher fertility rates, as shown at ages 35 and 40. However, this recuperation at older ages was not sufficient to catch up with the larger completed family size of the 1943 cohort who had 2.24 children per woman on average compared with 1.91 children per women on average for the 1970 cohort.
Age-specific fertility rates for the 1985 cohort are currently only available up to the age of 30. For this cohort, fertility rates at age 30 were a little higher than for the 1970 cohort, but were similar to those for other early 1980s cohorts. In contrast, fertility rates at age 20 and age 25 for the 1985 cohort were lower than those seen for the 1970 cohort.
Fertility at age 25 hit a low for women born in 1977 before rising slightly among cohorts born between 1978 and 1987. At age 25, women born in 1985 had 6 live births per 1,000 women less than women born in 1970, but 8 live births per 1,000 women more than women born in 1980. This highlights the changing levels of fertility at age 25 seen for current cohorts of childbearing age.
If recent trends in childbearing at older ages continue, the 1985 cohort would be expected to have an older average age at childbearing than the 1970 cohort.
Back to table of contents10. Quality and methodology
This release was previously called “Cohort Fertility” and was renamed as “Childbearing for women born in different years” in 2013
The Births Quality and Methodology Information document contains important information on:
- strengths and limitations of the data
- the quality of the output: including the accuracy of the data, how it compares with related data
- uses and users
- how the output was created
During May 2012 changes were made to the Population Statistics Act 1938, which means that information on the number of previous children and whether previously married is now collected from all mothers at birth registration and not just from married women. This change highlighted an issue with the number of previous children being reported at birth registration which we noted at the time. In January 2016 an improvement was made to the registration system to rectify this issue, although this change will have no impact on the figures reported in this bulletin (latest data is 2015). We are currently monitoring the impact that the further improvement to the question has had on the number of previous children being reported. We will update the analysis in the paper as soon as we are able to do so.
The methods used to create cohort fertility require use of data collected at birth registration from women on the number of previous children they have had. At present the birth registration system does not collect information on the number of previous children a man has had. Without this information it is not possible to produce estimates of the proportion of men who have not fathered a child.
It is also important to note that a man's reproductive span is not as well defined as a woman's, in terms of the upper age at which a man can father a child and so this means we would need a longer time series to calculate cohort measures. Male period fertility rates can be found in another of our releases – Births by parent’s characteristics.
The revisions policy for population statistics is available on our website.
Further information on the data sources and methods for producing this output can be found in the metadata tab of the data tables.
National Records of Scotland provides more detailed birth statistics for Scotland, including cumulative fertility by cohort.
The Northern Ireland Statistics and Research Agency provides more detailed birth statistics for Northern Ireland, including cumulative fertility by cohort.
Special extracts and tabulations of births data for England and Wales are available to order for a charge (subject to legal frameworks, disclosure control, resources and agreements of costs, where appropriate). Such enquiries should be made to:
Vital Statistics Outputs Branch (VSOB)
Tel: +44 (0)1329 444 110
E-mail: vsob@ons.gov.ukEnquiries on Childbearing for women born in different years, England and Wales, should be made to:
Demographic Analysis Unit (DAU)
Tel: +44 (0)1329 444 661
E-mail: pop.info@ons.gov.uk