Table of contents
- Main points
- Introduction
- Background
- Who uses estimates of the very old?
- Methodological information
- The 'Oldest Old' population in the UK
- 90 and over population in the UK by age group and sex
- The 90 and over population by single year of age in the UK
- UK country comparisons
- International comparisons
- Quality and methodological review
- Background notes
- Methodology
1. Main points
There were over half a million people aged 90 and over living in the United Kingdom (UK) in 2013
In 2013, there were 840 people aged 90 and over per 100,000 in England and Wales; higher than in Scotland (707) and Northern Ireland (620)
The number of centenarians (people aged 100 and over) in the UK was estimated to be 13,780 in 2013; of these 710 were estimated to be aged 105 or older
In 2013 there were 586 women aged 100 and over for every 100 men of that age in the UK; this has fallen from 823 women in 2003
2. Introduction
The Office for National Statistics (ONS) has released today Estimates of the Very Old (including Centenarians) 2002-2013 in England and Wales and the United Kingdom (UK). These are annual mid-year estimates by sex and single year of age for people aged 90 to 104 and for the 105 and over age group. Figures for 2013 are published for the first time today. Figures for 2002-2012 update the figures previously published in September 2013 for England and Wales and in March 2014 for the UK.
Corresponding estimates for Scotland and for Northern Ireland for 2002-2013 are also published today by National Records of Scotland (NRS) and Northern Ireland Statistics and Research Agency (NISRA) respectively.
ONS publishes annual Mid-Year Estimates (MYE) of the population for England and Wales and the UK by single year of age up to age 89 and for the 90 and over age group. To provide users with a consistent set of age estimates by single year of age up to age 105 and over, the ‘Estimates of the Very Old (including Centenarians)’ series is constrained to the 90 and over totals in the MYE.
The numbers of the ‘oldest old’ is of policy interest because of implications for pensions, health and social care.
Back to table of contents3. Background
Interest in population estimates at the oldest ages by single year of age has increased as life expectancy has risen and the number of those aged 90 and over has grown.
Until 2006 the Government Actuary’s Department calculated population estimates for single years of age beyond 90 for each of the UK countries. Although these estimates were made available for research purposes1, they were not officially published. Since 2006 these estimates have been produced by the Office for National Statistics (ONS).
In 2007, in recognition of increased user demand for population estimates at the oldest ages by single year of age, ONS began to publish estimates of the 90 and over age group by single year of age for people aged 90 to 104 and for the 105 and over age group for England and Wales as experimental statistics. Since 2010 ONS has also published these estimates for the UK.
In 2011 the estimates were assessed by the UK Statistics Authority and have since been published as National Statistics.
Notes for background
- Estimates of the 90 and over population by single year of age have been produced since 1981 for internal purposes on a consistent basis.
4. Who uses estimates of the very old?
Within ONS, Estimates of the Very Old are primarily used in the production of National Life Tables and National Population Projections. Other uses include answering parliamentary questions, responding to media interest and responding to customer enquiries.
Outside ONS the estimates are used by:
the Department for Work and Pensions and the Department of Health in formulating or assessing policy on pensions and health care
demographers, health and medical professionals and other researchers interested in longevity
life insurance companies and the actuarial profession for the calculation of mortality rates at the oldest ages
5. Methodological information
Estimates of the Very Old for England and Wales (and for Scotland and Northern Ireland) are produced using the Kannisto-Thatcher (KT) method.
The KT method produces estimates of population at older ages using 'age at death' data. These data are used to build up distribution profiles of the numbers of older people in England and Wales. For example, if someone dies in 2012 aged 105, this means that they were alive and aged 104 in 2011 and 103 in 2010 etc. By collating ‘age at death’ data for a series of years, it becomes possible to make an estimate of the number of people of a given age alive in any particular year and so create age distribution profiles, assuming that migration at these oldest ages is minimal.
To make estimates for the latest year, it is not possible to use deaths data, as we are interested in the population who are currently or very recently alive. So for each cohort the KT method uses an average of the last five years of ‘age at death’ information to produce an estimate of the number of survivors for the current year.
Each year as more recent deaths data become available to inform the age distribution profiles, estimates for the back years are recalculated and become more accurate. For this reason Estimates of the Very Old (including Centenarians) are always published as ‘provisional’.
The estimates for the current year and the recalculated back years are constrained to sum to the 90 and over totals in the Mid-Year Estimates (MYE) for males and females separately for the current year and the previous years.
Estimates of the very old (including centenarians) for the UK are produced by aggregating the 90 and over single year estimates by sex for England and Wales, Scotland and Northern Ireland.
Back to table of contents6. The 'Oldest Old' population in the UK
In 2013 there were estimated to be over half a million (527,240) people aged 90 and over living in the UK, 0.8% of the total population.
The numbers reaching very old ages continue to increase. Over the last 30 years, the number of those aged 90 and over has almost tripled.
Although the 90 and over group account for only a very small proportion of the UK population (0.8% in 2013) the size of this age group relative to the rest of the population has also increased over time. In 1983, there were 322 people aged 90 and over per 100,000 population; by 1993 this had increased to 487; by 2003 it had reached 662 and the latest figures for 2013 show there were 822 people aged 90 and over per 100,000 population in the UK (Figure 1).
Figure 1: People aged 90 and over per 100,000 population in the UK, 1983 to 2013
Source: Office for National Statistics, National Records of Scotland, Northern Ireland Statistics and Research Agency
Download this chart Figure 1: People aged 90 and over per 100,000 population in the UK, 1983 to 2013
Image .csv .xlsThe chance of surviving to older ages has increased for both males and females over recent decades, contributing to the rising number of those aged 90 and over in the population. Improvements in mortality rates at older ages are due to a combination of factors such as improved medical treatments, housing and living standards, nutrition and changes in the population’s smoking habits.
Back to table of contents7. 90 and over population in the UK by age group and sex
Four out of five people aged 90 and over in the UK in 2013 are aged below 95 (Figure 2).
Figure 2: Population aged 90 and over, by age, UK, 2013
Source: Office for National Statistics, National Records of Scotland, Northern Ireland Statistics and Research Agency
Download this chart Figure 2: Population aged 90 and over, by age, UK, 2013
Image .csv .xlsThe age profile of the 90 and over population however is becoming older. Over the period 1983 to 2013, the proportion of the 90 and over population aged 90-94 decreased from 83% to 80% while the proportion aged 95-99 increased from 16% to 17% and the proportion aged 100 and over (centenarians) increased from 2% to 3% (Figure 3).
Figure 3: Population aged 90 and over by age, UK, 1983 and 2013
Source: Office for National Statistics, National Records of Scotland, Northern Ireland Statistics and Research Agency
Download this chart Figure 3: Population aged 90 and over by age, UK, 1983 and 2013
Image .csv .xlsAlthough centenarians account for only 3% of the population aged 90 and over and only 0.02% of the overall UK population, their numbers are growing.
In 2013 there were estimated to be 13,780 centenarians (people aged 100 or over) living in the UK. Of these, 710 were estimated to be aged 105 or older.
Over the last 30 years the number of centenarians has more than quadrupled from the 1983 estimate of 3,040. In the last decade their numbers have gone up by 5,730, a 71% increase (Figure 4).
Figure 4: Centenarians by sex, UK, 1983 to 2013
Source: Office for National Statistics, National Records of Scotland, Northern Ireland Statistics and Research Agency
Notes:
- Numbers are rounded to nearest 10.
- Totals may not sum due to rounding.
Download this chart Figure 4: Centenarians by sex, UK, 1983 to 2013
Image .csv .xlsIn 2013, of the half a million people aged 90 and over in the UK, 72% were female; for those aged 95 and over the percentage who are female increases to 79% and for centenarians, 85% are female. Women outnumber men at older ages because they have higher life expectancy. (According to the latest UK life expectancy figures for 2011-2013, life expectancy at birth is 82.7 years for females compared to 78.9 years for males).
Figure 5: Female to male ratios at age 90 and over, UK, 1983 to 2013
Source: Office for National Statistics, National Records of Scotland, Northern Ireland Statistics and Research Agency
Download this chart Figure 5: Female to male ratios at age 90 and over, UK, 1983 to 2013
Image .csv .xlsFigure 5 shows the number of women aged 90 and over for every 100 men of those ages. Over recent decades there have been relatively greater improvements in male mortality at older ages. (Over the period 1980-1982 and 2011-2013, UK life expectancy at age 65 and over improved by 41% for males compared to 23% for females and at age 85 and over improved by 34% for males compared to 26% for females). We would therefore expect a fall in the sex ratio of women to men at the oldest ages.
However, although male mortality has been improving faster than female mortality over the whole of the period 1983 to 2013 shown, the fall in the ratio of women to men at ages 90 and over is only apparent from 1990; prior to this time the ratio is rising.
The rises in the number of women aged 90 and over relative to men in the 1980s reflect two major past events, the First World War and the Spanish ‘flu’ pandemic that followed.
Men aged 90 and over in 1983 would have been born in 1893 or earlier and therefore aged 21 or older at the outbreak of the First World War in 1914. In fact all those men aged 90 and over in the period 1980 to 1986 would have been aged 18 or over in 1914 and therefore eligible to fight. Those aged 90 and over in the period 1987 to 1990 would have been too young to join up when war broke out; however they would progressively have turned 18 between 1915 and 1918 when the war ended. (Also it is known that many boys younger than 18 volunteered and their age was not checked. It is thought that as many as 250,000 ‘Boy Soldiers’1 were recruited and fought in the First World War). Therefore many of these men would have been killed in the war.
The global influenza pandemic that occurred after the War in 1918-19, unlike other strains of ‘flu’, tended to attack young adults as well as younger and older age groups. Young men were disproportionately susceptible compared to young women because many had already been weakened by the war. Together these two major events contribute to the rises in women relative to men at age 90 and over in the 1980s (despite greater improvement in male mortality compared to female mortality at older ages over the whole period) as fewer men were alive to survive to the oldest ages.
In the last decade, the ratio of women to men at older ages has continued to fall. In the UK in 2003 there were 327 women aged 90 and over for every 100 men of that age; by 2013 this had fallen to 256. The fall in the ratio was greater for those aged 100 and over, falling from 823 female centenarians for every 100 male centenarians in 2003 to 586 in 2013 (Figure 6). These falls are due to continued greater improvements in male mortality at older ages relative to female mortality.
Figure 6: Female to male ratios at age 90 and over and 100 and over, UK, 2003 to 2013
Source: Office for National Statistics, National Records of Scotland, Northern Ireland Statistics and Research Agency
Download this chart Figure 6: Female to male ratios at age 90 and over and 100 and over, UK, 2003 to 2013
Image .csv .xlsNotes for 90 and over population in the UK by age group and sex
- 'Boy Soldiers', History Learning Site. Accessed online September 2014: http://www.historylearningsite.co.uk/boy_soldiers.htm
8. The 90 and over population by single year of age in the UK
The number of people aged 90 and over by single year of age in the population in the UK in 2002-2013 is largely determined by past and current mortality rates but also reflects the number of births 90 years ago and earlier. Past migration patterns and major events like war will also affect numbers.
Figure 7 shows the proportions of selected ages that make up the total 90 and over population over the period 2002-2013. As would be expected, proportions decrease with age, in other words in every year there are higher proportions of 90 year olds than 91 year olds than 92 years olds and so on.
Distinct birth cohort patterns are also apparent. (A birth cohort is all people born in the same year). These are echos of birth patterns in the years leading up to, during and just after the First World War.
Looking at Figure 7, there is a steady decline in the proportion of 90 year olds over the period, 2004 to 2008. These people would have been born during the First World War years, 1914 to 19181. This reflects the steady decline in births in during the war years.
The lowest number of births recorded during the First World War was in 19182. Those born at this time appear in the 2008 estimate of 90 year olds. Figure 7 shows the proportion of 90 year olds is lowest in 2008, reflecting this cohort’s low birth numbers. Following this cohort over time we can see that the lowest proportion of 91 year olds is in 2009, the lowest proportion of 92 year olds is in 2010, the lowest proportion of 93 year olds is in 2011, the lowest proportion of 94 year olds in 2012 and the lowest proportion of 95 year olds in 2013.
The low point in births in 1918 was followed by a large increase in births post war. Figures are not available for the UK for that period but in 1918 in England and Wales there were 662,661 births and 692,438 births in 1919. This compares with 957,782 in 1920 and 848,814 in 1921 – a large difference.
Figure 7: People aged 90 to 99 as a percentage of all people aged 90 and over, UK, 2002 to 2013

Source: Office for National Statistics, National Records of Scotland, Northern Ireland Statistics and Research Agency
Notes:
- Ages 100 to 105 are not shown on the chart because the percentages are so small.
- The years of birth are approximate. For instance a person aged 90 in 2010 could have been born in 1919 or 1920; for simplicity however such persons are regarded as belonging to the 1920 birth cohort.
- Population estimates are for mid-year, total births are for calendar years.
Download this image Figure 7: People aged 90 to 99 as a percentage of all people aged 90 and over, UK, 2002 to 2013
.png (31.0 kB) .xls (28.2 kB)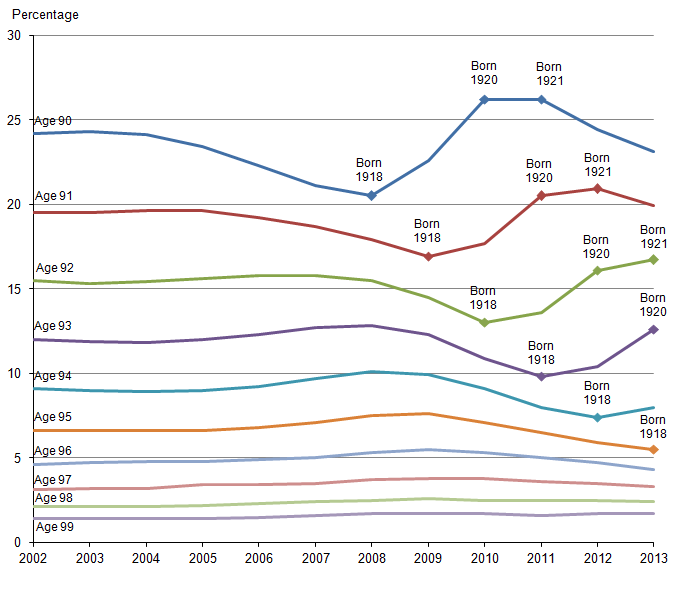
Figure 7 shows the largest proportions of 90 year olds in 2010 and 2011, those born in the high birth years of 1920 and 1921. Again following these cohorts over time we can see the highest proportions of 91 year olds are in 2011 and 2012 and the highest proportions of 92 year olds are in 2012 and 2013.
The pattern of changes in the proportions of single year ages over the period 2002-2013 for men and women aged 90 and over separately follow the same pattern over time as for all people, however the proportions of women in the oldest ages are higher than for men, reflecting their higher life expectancy.
Notes for the 90 and over population by single year of age in the UK
- The years of birth are approximate. For instance a person aged 90 in 2010 could have been born in 1919 or 1920; for simplicity however such persons are regarded as belonging to the 1920 birth cohort.
- Population estimates are mid year; total births are for calendar years.
9. UK country comparisons
In 2013, in England and Wales1 as a whole, there were 840 people aged 90 and over per 100,000 population, the highest proportion across the UK countries. In Scotland there were 707 people aged 90 and over per 100,000 population and in Northern Ireland there were 620 (Figure 8). These differences reflect higher life expectancy at older ages in England and Wales compared with Scotland and Northern Ireland.
Figure 8: People aged 90 and over per 100,000 population, UK countries, 2013
Source: Office for National Statistics, National Records of Scotland, Northern Ireland Statistics and Research Agency
Download this chart Figure 8: People aged 90 and over per 100,000 population, UK countries, 2013
Image .csv .xlsOver the last 30 years, the numbers of those aged 90 and over per 100,000 population have increased in all UK countries. The largest increase occurred in England and Wales, with an increase of 511 people per 100,000 over the period, compared with increases of 431 in Scotland and 351 in Northern Ireland.
Although the overall age distribution of the 90 and over population was very similar for the UK countries in 2013, the age profile was slightly older in England and Wales, where 20% of the 90 and over population were aged 95 or over, compared with 19% in Northern Ireland and 18% in Scotland.
Although centenarians account for a very small proportion of the age 90 and over population, over the last 30 years their numbers have more than quadrupled in England and Wales as a whole, and more than tripled in Scotland and Northern Ireland (Table 1).
Table 1: Number of centenarians living in UK countries, 1983 and 2013
| England and Wales | Scotland | Northern Ireland | ||||
| 1983 | 2,766 | 213 | 62 | |||
| 2013 | 12,718 | 830 | 233 | |||
| Sources: Office for National Statistics, National Records of Scotland, Northern Ireland Statistics and Research Agency | ||||||
Download this table Table 1: Number of centenarians living in UK countries, 1983 and 2013
.xls (31.7 kB)Comparing across UK countries the number of centenarians per 100,000 population in 2013 was highest in England and Wales (22) followed by Scotland (16) and Northern Ireland (13).
The ratio of women to men at age 90 and over is higher in Scotland and Northern Ireland than in the rest of the UK, reflecting higher male mortality rates in these countries. In 2013 in England and Wales there were 255 women aged 90 and over for every 100 men of that age; in Scotland and Northern Ireland the equivalent figures were 266 and 274 respectively.
Notes for UK country comparisons
- Estimates of the Very Old are not published for England or Wales separately because the method used does not account for the number of migrants moving between England and Wales in the 90 and over age group.
10. International comparisons
The number of older people in a country’s population is largely a result of past and current mortality rates together with past fertility patterns. Recent fertility patterns will influence the relative proportions of younger and older people in the population.
Median age (the age at which half the population is younger and half is older) is an indicator of the age profile of a country. Developing countries have much younger profiles, as indicated by their median ages, than developed countries.
Even in the most aged countries, the population aged 90 and over represents a very small proportion of the overall population. In 2013, Japan had the highest median age of all countries in the world at 45.8 years; however only 1.3% of the population was aged 90 and over in 2013.
Given these very small proportions, comparing the number of those aged 90 and over per 100,000 in the population more readily enables international comparison (Figure 9).
Figure 9: International comparison for the number of people aged 90 and over per 100,000 population, 2013
Source: Statistics Bureau of Japan, Statistics Sweden, National Institute of Statistics and Economic Studies - France, The National Institute of Statistics Italy, Statistics Norway, National Statistics Institute of Spain, Federal Statistics Office Germany, Statistics Finland, Statistics Denmark, Statistics Canada, US Census Bureau, Australian Bureau of Statistics, Statistics New Zealand, Statistics Iceland, Statistical Office of the Republic of Slovenia, Central Statistics Office Ireland, Czech Statistical Office, National Statistics Institute of Bulgaria, Office for National Statistics and the United Nations
Notes:
- Countries have been selected on the availability of data.
- The data for the majority of countries are for 2013. For those countries marked with a * the latest available data are for 2010.
Download this chart Figure 9: International comparison for the number of people aged 90 and over per 100,000 population, 2013
Image .csv .xlsIn 2013, in the United Kingdom, there were 822 persons aged 90 and over per 100,000 of the population.
Japan had by far the highest number of persons aged 90 and over per 100,000 population in 2013 at 1,266. After Japan, European countries, with the exception of former communist countries, had the highest numbers of persons aged 90 and over per 100,000 population compared to other regions of the world. Among European countries, in 2013, Sweden and France had relatively high numbers of persons aged 90 and over per 100,000 population, 1,004 and 995 persons respectively. Iceland and the Republic of Ireland had relatively low numbers; 546 per 100,000 in Iceland and 457 per 100,000 in the Republic of Ireland. Former communist countries in Europe tend to have lower numbers of people aged 90 and over per 100,000 than other European countries, for example in Croatia and Poland the figures were 305 and 299 respectively in 2010. Among these countries Russia had the lowest proportion at 212 persons aged 90 and over per 100,000. These figures reflect lower life expectancy at older ages in Eastern European countries compared to the rest of Europe.
Canada, the United States of America, Australia and New Zealand have lower numbers of persons aged 90 and over per 100,000 population than many countries in Europe, (708,707,655 and 561 respectively). Australia has one of the world’s highest life expectancies at older ages and New Zealand, Canada and the United States also have relatively high life expectancies at older ages. However, all three countries have younger age profiles (lower median ages) than many European countries meaning older people make up a smaller proportion of the population than in European countries with older profiles. This is because these countries have relatively higher fertility rates and higher historic migration rates.
Countries with more recently emerging economies such as China and India have relatively low numbers of persons aged 90 and over per 100,000 population, 146 and 77 respectively. They have younger age profiles and also have lower life expectancies than nations that have been developed for a longer period of time.
Africa is the least aged region of the world owing both to higher fertility and much lower life expectancy than other world regions. The average number of persons aged 90 and over for the continent as a whole was 26 per 100,000 in 2010.
According to the UN there were around 441,000 centenarians in the world in 20131. Even in the most aged countries the population aged 100 and over represents a very small proportion of the overall population. In 2013, people aged 100 and over accounted for only 0.02% of the total UK population, or 21 per 100,000 population. However, in comparison to many other countries, the UK has a relatively high number of centenarians.
The prevalence of centenarians internationally largely mirrors that of the 90 and over population shown in Figure 9. In 2013, Japan had the highest number of centenarians per 100,000 population in the world at 43 while, within Europe, France had the highest number at 32. Eastern European countries have lower rates of centenarians than countries in Western Europe and numbers of centenarians in the more recently developed nations of India and China are very small at 3 per 100,000 population in both countries.
Notes for international comparisons
- United Nations, Department of Economic and Social Affairs, Population Division (2013), World Population Ageing 2013, pp. 32 Accessed September 2014 at: www.un.org/en/development/desa/population/publications/ageing/WorldPopulationAgeingReport2013.shtml
11. Quality and methodological review
ONS has an ongoing project reviewing the methods used to produce estimates for the population aged 90 and over and their accuracy. This review includes testing the assumptions inherent in the (KT) Kannisto-Thatcher method and comparing the estimates of the very old and Census estimates with administrative data sources. Results will be published on the ONS website by December 2015.
Estimates of the Very Old are calculated from deaths data. The methodology produces a lower estimate of the total population aged 90 and over in 2013 for England and Wales, for Scotland and for Northern Ireland than the official mid year estimates (MYE) 90 and over population total. However in order to provide users with a consistent set of single year estimates beyond age 89, once produced the Estimates of the Very Old for ages 90 and over are constrained to sum to the 90 and over totals in the MYE for males and females separately (see Methodology section).
The MYE are produced by rolling forward the census population estimates allowing for ageing, births, deaths and migration. Any error in the 90 and over census estimate is thereby carried forward to the inter-censal mid-year population estimates and will be reflected in the Estimates of the Very Old.
There is some degree of uncertainty around all population estimates. In addition to non-response, other possible sources of error in the census estimate for people aged 90 and over include inaccuracies in reporting of dates of birth (for example proxy reporting by carers). Such inaccuracies have been documented in previous censuses1,2.
The methodology used to produce the Estimates of the Very Old (including Centenarians) includes assumptions (namely the accuracy and completeness of the deaths data; the stability of mortality improvement; and no migration at older ages). Recording of date of birth at death registration may be more accurate than reporting of date of birth in the census, however as date of birth on death certificates is not validated there are also likely to be some inaccuracies in this data source.
Estimates of the Very Old for the UK are aggregates of the single year estimates of the 90 and over population produced for England and Wales, Scotland and Northern Ireland (see Methodology section). It would be possible to produce these estimates for the UK by applying the KT methodology to an aggregation of population and deaths data for England and Wales, Scotland and Northern Ireland. The review will include an assessment of this alternative method.
Initial results from the review indicate that the 2012 MYE 90+ totals that the KT estimates are constrained to are in line with comparable data for this age group available from administrative sources held by the Department of Work and Pensions (DWP) and Department of Health (DH).
Notes for quality and methodological review
- Thatcher, R. (Summer 1999). ‘The demography of centenarians in England and Wales’, Population Trends, No. 96 pp 5-12.
- Census 2001 Quality report for England and Wales; 2011 Census Quality Survey report.
- Quality and Methodology Information for Estimates of the Very Old. (335.5 Kb Pdf)