Table of contents
- Main points
- Statistician’s quote
- Things you need to know
- Over half a million people were aged 90 and over in UK in 2015
- Most people aged 90 and over in the UK in 2015 were aged below 95
- 90 and over population by single year of age reflects historical birth cohort patterns
- There were 14,570 centenarians in 2015
- 7 in 10 people aged 90 and over are female but ratio of females to males is falling
- England and Wales have higher proportions of 90 and over population than Scotland and Northern Ireland
- Scotland had greatest fall in ratio of females to males aged 90 and over in last decade
- Northern Ireland had the lowest proportion of centenarians in the population within the UK countries in 2015
- What’s changed in this release?
- Links to ONS related statistics
- Quality and methodology
1. Main points
There were over half a million people aged 90 and over living in the United Kingdom (UK) in 2015.
For every 100 men aged 90 and over in 2015 there were 240 women.
The number of centenarians (people aged 100 and over) living in the UK has risen by 65% over the last decade to 14,570 in 2015.
Of the 14,570 centenarians living in the UK, 850 were estimated to be aged 105 or more, double the number in 2005.
Back to table of contents2. Statistician’s quote
“The number of centenarians in the UK continues to increase year on year reaching just over 14,500 in 2015. Although the majority of the very old are women the number of men reaching the oldest ages is increasing as male mortality improves.”
Pamela Cobb, Demographic Analysis Unit, Office for National Statistics.
Back to table of contents3. Things you need to know
These are annual mid-year estimates by sex and single year of age for people aged 90 to 104 and for the 105 and over age group. Figures for 2002 to 2014 update the figures previously published in September 2015 for England and Wales and for the UK. Corresponding estimates for Scotland and for Northern Ireland for 2002 to 2015 are also published today by National Records of Scotland (NRS) and the Northern Ireland Statistics and Research Agency (NISRA) respectively.
To provide users with a consistent set of estimates by single year of age up to age 105 and over, the Estimates of the very old (including centenarians) series is constrained to the 90 and over totals in the Mid-year population estimates.
Separate Kannisto-Thatcher (KT) estimates for England and Wales have been produced for the first time (previously, these were published for England and Wales combined).
Back to table of contents4. Over half a million people were aged 90 and over in UK in 2015
In 2015, there were estimated to be over half a million people (556,270) aged 90 and over living in the UK, up from 194,670 people in 1985 (Figure 1). Although the 90 and over group account for only 0.9% of the total UK population in 2015, the size of this age group relative to the rest of the population has increased over time. In 1985, there were 344 people aged 90 and over per 100,000 population, compared to 854 people aged 90 and over per 100,000 population in 2015.
Figure 1: People aged 90 and over per 100,000 population, UK, 1985 to 2015
Source: Office for National Statistics, National Records of Scotland, Northern Ireland Statistics and Research Agency
Download this chart Figure 1: People aged 90 and over per 100,000 population, UK, 1985 to 2015
Image .csv .xlsThe dip in the 90 and over population in 2008 reflects low birth numbers 90 years previously, at the end of World War 1, followed by higher numbers of births in the early 1920s (see Figure 3 for more details).
The main driver of population ageing in recent decades has been improving mortality at all ages, but particularly at older ages. Improvements in survival to older ages are due to a combination of factors such as improved medical treatments, housing and living standards, nutrition and changes in the population’s smoking habits1,2. In the last 10 years, a big change has been the fall in the percentage of deaths from heart disease.
Notes:
- Murphy M, Di Cesare M, (2012) Use of an age-period-cohort model to reveal the impact of cigarette smoking in trends in twentieth century adult cohort mortality in England and Wales, Population Studies, Vol 66, Issue 3.
- K. Dunnell, Ageing and Mortality in the UK: National Statistician’s Annual Article on the population, Population Trends, Winter 2008
5. Most people aged 90 and over in the UK in 2015 were aged below 95
Approximately 4 out of 5 people age 90 and over in the UK in 2015 were aged below 95, however, the age structure of the 90 and over population is gradually becoming older.
Over the period 1985 to 2015, the proportion of the 90 and over population aged 90 to 94 decreased from 82% to 79% while the proportion aged 95 to 99 increased from 16% to 18% and the proportion aged 100 and over (centenarians) increased from 2% to 3% (Figure 2).
Figure 2: UK population aged 90 and over by age group, UK, 1985 and 2015
Source: Office for National Statistics, National Records of Scotland, Northern Ireland Statistics and Research Agency
Download this chart Figure 2: UK population aged 90 and over by age group, UK, 1985 and 2015
Image .csv .xls6. 90 and over population by single year of age reflects historical birth cohort patterns
Figure 3 shows how the current 90 and over population by single year of age reflects historical birth cohort patterns (a birth cohort is all people born in the same year). Notably lower numbers of births during the First World War (1914 to 1918) are reflected in smaller numbers of these cohorts reaching age 90 and over. By contrast, a relatively high number of people from the 1920 and 1921 births cohorts have reached age 90 and over, reflecting the larger size of these cohorts due to an increase in births post war. For a more detailed explanation see “The impact of the First World War on the 90 and over population of the UK“.
Figure 3: People aged 90 to 99 as a percentage of all people aged 90 and over, UK, 2002 to 2015

Source: Office for National Statistics, National Records of Scotland, Northern Ireland Statistics and Research Agency
Notes:
- The years of birth are approximate. For instance a person aged 90 in 2010 could have been born in 1919 or 1920; for simplicity however such persons are regarded as belonging to the 1920 birth cohort.
- Population estimates are mid-year; total births are for calendar years.
Download this image Figure 3: People aged 90 to 99 as a percentage of all people aged 90 and over, UK, 2002 to 2015
.png (24.0 kB) .xls (29.7 kB)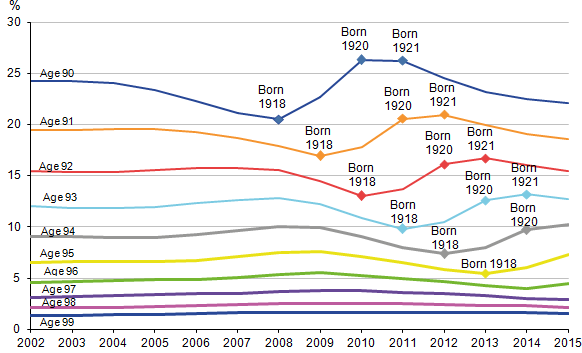
7. There were 14,570 centenarians in 2015
In 2015, there were estimated to be 14,570 centenarians (people aged 100 or over) living in the UK. This represents just 2.6% of the population aged 90 and over and only 0.02% of the overall UK population. However, their numbers have quadrupled from 3,420 in 1985, and in the last decade their numbers have gone up by 5,720, a 65% increase (Figure 4).
Similarly the numbers of centenarians aged 105 and over has increased markedly in recent years, reaching 850 in 2015 compared to just 130 in 1985. These increases reflect increasing life expectancy at higher ages over the period.
Figure 4: Number of centenarians in the UK, 1985 to 2015
Source: Office for National Statistics, National Records of Scotland, Northern Ireland Statistics and Research Agency
Notes:
- Numbers are rounded to nearest 10
Download this chart Figure 4: Number of centenarians in the UK, 1985 to 2015
Image .csv .xls8. 7 in 10 people aged 90 and over are female but ratio of females to males is falling
In 2015, the vast majority of the population aged 90 and over (71%) were female. Women outnumber men at older ages because they have higher life expectancy. According to the latest National Life Tables for 2013 to 2015, life expectancy at birth is 82.8 years for females compared with 79.1 years for males and at age 85 and over is 6.8 years for females compared to 5.8 years males.
Within the 90 and over population in the UK, the ratio of females to males increases with age. In 2015, 78% of those aged 95 and over were female; 85% of centenarians were female and 88% of centenarians aged 105 and over were female.
However, the ratio of men to women at older ages is falling. In the UK in 2005 there were 284 women aged 90 to 94 and 431 women aged 95 to 99 for every 100 men of those ages; by 2015 the ratios had fallen to 220 and 329 respectively. The fall in the ratio was greater for those aged 100 and over, falling from 719 female centenarians for every 100 male centenarians in 2005 to 550 in 2015 (Figure 5).
These falls are due to continued faster improvements in male life expectancy than female life expectancy at older ages1.
Figure 5: Female to male ratios by 90 and over age groups, UK, 2005 to 2015
Source: Office for National Statistics, National Records of Scotland, Northern Ireland Statistics and Research Agency
Download this chart Figure 5: Female to male ratios by 90 and over age groups, UK, 2005 to 2015
Image .csv .xlsNotes:
Back to table of contents9. England and Wales have higher proportions of 90 and over population than Scotland and Northern Ireland
In 2015, in Wales, there were 938 people aged 90 and over per 100,000 population compared to 867 in England, 741 in Scotland and 672 in Northern Ireland.
Over the last 30 years, the largest increases in those aged 90 and over per 100,000 population occurred in Wales (603) followed by England (515) Scotland (448) and Northern Ireland (388). These differences reflect the overall demographic patterns in each of the UK countries. Northern Ireland has a slightly younger age profile than the other UK countries with older people making up a smaller proportion of the overall population. This is partly because Northern Ireland has historically had higher fertility rates than the rest of the UK. Scotland has lower life expectancy compared to the other UK countries. (For more information on changing life expectancies over time in the UK countries see National Life Tables release).
The age profile of the 90 and over population was slightly older in England and in Wales compared to Scotland and Northern Ireland. In 2015 21.0% of the 90 and over population in both England and in Wales were aged 95 or over, compared with 20.2% in Northern Ireland and 19.7% in Scotland. This reflects higher life expectancy in England at age 90 for both males and females than in the other UK countries.
Back to table of contents10. Scotland had greatest fall in ratio of females to males aged 90 and over in last decade
The ratio of women to men at age 90 and over is lower in England than in the other UK constituent countries, reflecting lower male mortality at the highest ages. In 2015 in England there were 238 women aged 90 and over for every 100 men of that age; in Scotland, Wales and Northern Ireland the equivalent figures were 248, 251 and 259 respectively (Figure 6).
Over the last 10 years the decrease in the number of women per 100 men at ages 90 and over has been greatest in Scotland, dropping by 97. The falls in the number of women per 100 men at ages 90 and over were very similar for England, Wales and Northern Ireland over the last decade at 68, 67 and 70 respectively (Figure 6). This reflects a greater reduction in the gap between male and female life expectancy at age 85 in Scotland over the period than in England, Wales and Northern Ireland.
Figure 6: Number of women per 100 men at ages 90 and over, UK countries, 2005 to 2015
Source: Office for National Statistics, National Records of Scotland, Northern Ireland Statistics and Research Agency
Download this chart Figure 6: Number of women per 100 men at ages 90 and over, UK countries, 2005 to 2015
Image .csv .xls11. Northern Ireland had the lowest proportion of centenarians in the population within the UK countries in 2015
There were 12,660 centenarians in England, 730 centenarians in Wales, 900 in centenarians in Scotland and 280 centenarians in Northern Ireland in 2015.
As a proportion of the overall population in 2015 there were 23 centenarians per 100,000 population in England and in Wales compared to 17 in Scotland and 15 in Northern Ireland (Figure 7). In 1985, there were 6 centenarians per 100,000 population in England, Wales and Northern Ireland and 4 per 100,000 population in Scotland.
Although centenarians account for a very small proportion of the total population, over the last 30 years their numbers have quadrupled in England, Wales and Scotland and tripled in Northern Ireland, with the fastest increases occurring in the last decade.
Figure 7: Centenarians per 100,000 population, UK countries,1985 to 2015
Source: Office for National Statistics, National Records of Scotland, Northern Ireland Statistics and Research Agency
Download this chart Figure 7: Centenarians per 100,000 population, UK countries,1985 to 2015
Image .csv .xls12. What’s changed in this release?
Improvements have been made to this bulletin and its contents to provide a more concise summary of the key statistics. As part of is consolidation we’ve relocated the international comparison tables to the QMI document. We welcome any feedback you might have on these changes. Please send this to popinfo@ons.gov.uk
Back to table of contents14. Quality and methodology
In 2011 the estimates were assessed by the UK Statistics Authority and have since been published as National Statistics. The estimates were re-assessed in 2015 and their National Statistics status is subject to confirmation once all the requirements in the assessment report have been met.
Estimates of the Very Old for England and for Wales separately have been produced for the first time to meet identified user requirements. (Previously the estimates were published for England and Wales combined). These separate country estimates have gone through both internal and external quality assurance processes.
Estimates for the UK, England and for Wales are produced by ONS while estimates for Scotland and Northern Ireland are produce by NRS and NISRA. Although the estimates for each country are produced using a comparable methodology, a comparison paper has been published to explain any differences in the methodology used.
The Population estimates of the very old (including Centenarians) Quality and Methodology Information document contains important information on:
- strengths and limitations of the data
- the quality of the output: including the accuracy of the data, how it compares with related data
- uses and users
- how the output was created
ONS is currently reviewing the methodology for producing Estimates of the Very Old.
ONS published population estimates for the 90-94 and 95 and over age groups at Lower Super Output area in December 2013. These estimates are not National Statistics. They were published in order to elicit feedback on whether the estimates meet user requirements. The reliability of these estimates is discussed in an accompanying research paper. Assessment of the estimates, the research paper and the experimental estimates are available.
Revisions Policy- specific to population, migration and life events statistics
Contact details for this Statistical bulletin
Related publications
You might also be interested in:
- Comparison paper: 90 and over single year of age and sex population estimates produced by ONS, NRS and NISRA
- Research on accuracy of high age estimates – update
- Population estimates of the very old (including centenarians) QMI
- Feasibility of producing ‘Estimates of the very old’ for England and for Wales separately