1. Overview of working paper
In exploring the use of administrative data for official statistics, there is a demand for innovative methods to establish the quality of such data. One quality dimension to look at is representativeness. Representativity-indicator (R-indicator) methods have, through previous application to survey data, been shown to be good at estimating the representativeness of survey data. In this working paper, we, at the Office for National Statistics (ONS), are testing how a new approach of R-indicator and distance metrics methods can be applied to measure how representative the administrative data are of the population, with Census 2021 as the comparative dataset.
These methods were developed by Professor Natalie Shlomo and Dr Sook Kim of the University of Manchester, through an Economic and Social Research Council (ESRC) grant supported by the ONS. R-indicators and distance metrics use variables from the census or a weighted survey to explore how the administrative data differ from these other data sources. The data sources other than administrative data are what we call population auxiliary data in this paper. Where there is a difference between the population auxiliary data and administrative data, this would suggest the administrative data are lower in quality in terms of representativeness of the population. From the method application, we should find out whether the administrative data are an appropriate data source for use within our official statistics.
These methods were applied to data for a selected local authority in the Admin-based housing by ethnicity dataset (ABHED), with Census 2021 for England and Wales as the comparative, population auxiliary data. Our application focused on four variables found within both datasets and their variable categories. These variables were sex, age group, accommodation type and ethnicity.
Our results showed that the variables and variable categories we tested our methods on were generally represented well in the ABHED for the local authority. The results also pointed to variables that were less representative in the ABHED. Finally, we suggest in this report ways to further develop these methods for use in the ONS.
These are not official statistics and should not be used for policy or decision-making. They are published as feasibility research into new methods to quantify representativeness in administrative data.
2. Background to R-indicators and distance metrics
We are increasingly exploring the potential use of administrative data and their place alongside the census and surveys to produce official statistics. These administrative data are available to us through a secure data storage platform. Administrative data refer to data collected by organisations as part of their operations. As outlined by David Hand in his paper, Statistical challenges of administrative and transaction data (PDF, 359KB), there can be challenges to using administrative data to produce official statistics because they are rarely collected for this purpose.
To investigate whether administrative data are fit for use in official statistics and how the data should be used, there is a greater demand for quality indicators, such as indicators of representativeness. Representativeness is defined as the extent to which administrative data reflect population groups or individuals' characteristics. Therefore, a representativity indicator indicates if the administrative data are acceptable to use as a reflection of the population. Any lack of representativeness found in an administrative dataset is called representation error and indicates a less than perfect reflection of the population and a potential quality issue.
Representation error can occur when a record is not included in the dataset or when a record is included but their data are not recorded accurately, among other potential causes. Please see Section 4 of our previous research on potential errors in administrative data sources for further detail and our paper on qualitative methods to measure representativeness and inclusivity in administrative data.
As part of a wider research programme on quality indicators for administrative data, the Methodological Research Hub in the Office for National Statistics (ONS) are testing representativity-indicators (R-indicators) and distance metrics to assess the representativeness of administrative data as a reflection of the population. These methods could help us evaluate the quality in terms of representativeness of different administrative datasets for use in the production of statistical outputs, for example, in the early stages of the data selection process.
Existing methods compare frequencies to look at differences in the representativeness of administrative data. These methods do not account for the relative size of the subgroup, such as the population size of variables and variable categories. R-indicators do provide a measure of representativeness relative to variable and variable category size and takes a holistic multivariate approach. This enables a more standardised and detailed understanding of quality in terms of representativeness down to variable and variable category level, both within and across the different administrative data, to reflect whether this is comparable at the same level with the population. Essentially, R-indicators give a detailed level understanding of the representativeness of administrative data without needing to apply any linkage methods. Distance metrics also provides a way of assessing the representativeness of administrative data through a standardised approach, allowing for clearer comparisons within and between administrative datasets, and over time.
We partnered with the University of Manchester on an Economic and Social Research Council (ESRC) grant to advance the use of administrative data in official statistics (grant ES/V005456/1). We applied and tested a new method of calculating R-indicators and distance metrics, using administrative data that are available to the ONS through a secure data storage platform. The results help to shed light on the overall feasibility of these methods within an administrative data context, highlight potential limitations of use and pave the way for their future development as quality indicators for administrative data.
The comparative population auxiliary data, coming from either the census or weighted survey estimates, are expected to accurately include and represent the target population, and are therefore optimal for comparison with administrative data when using these methods. Both R-indicators and distance metrics can either be used separately or work as complementary tools for increased insight into the quality of administrative data in terms of representativeness.
R-indicators are already known within the field of measuring the representativeness of survey data (see the following papers for previous research: Indicators for the Representativeness of Survey Response (PDF, 185KB), Evaluating, Comparing, Monitoring and Improving Representativeness of Survey Response through R-indicators (PDF, 511KB), Selecting adaptive survey design strata with partial R-indicators (PDF, 1.1MB), and Estimation of response propensities and indicators of representative response using population-level information (PDF, 641KB). Professor Natalie Shlomo and Dr Sook Kim have been further developing and repurposing the method for use with administrative data.
Back to table of contents3. Research questions
Questions we aimed to answer in this application of R-indicators and distance metrics to administrative data in the Office for National Statistics (ONS) include:
can we apply these methods to estimate administrative data quality, in terms of representativeness, and can this inform official statistics?
what are the benefits and limitations in applying these methods to administrative data in the ONS?
how should the methods be developed for future use within the ONS?
4. Data and procedure
For the application of R-indicator and distance metric methods, we used coding languages R and Sparklyr in a secure environment using Apache spark.
The original code developed by Professor Natalie Shlomo and Dr Sook Kim was developed and tested in RStudio and is open source on the GitHub site.
Data
We applied R-indicators and distance metrics to four categorical variables that are present on both Census 2021 for England and Wales (population auxiliary dataset) and an administrative-based composite dataset named the Admin-based housing by ethnicity dataset (ABHED). For both methods, there is an assumption of independence between the administrative dataset and the population auxiliary dataset.
Both methods use variable and variable category frequency tables as the foundation for their calculations. This means that record-level linkage between Census 2021 and the ABHED was not needed, which is an advantage because it makes the application of these methods quicker and prevents the introduction of possible linkage error. Therefore, these methods will indicate representativeness on group rather than record level.
The four variables we used in this application were: accommodation type (eight accommodation types), age (eight age brackets), ethnicity (five ethnic groups), and sex (two sex categories). See Table 2 for variable category labels. We used comparable variables and variable categories across the datasets (this is needed for the methods to work). These were comparable in terms of the construct they were measuring and classification breakdown. For example, both datasets had the same number of ethnic groups and the same labels for those ethnic groups.
At this point, we could only apply the methods to a smaller geographic area because it suited the capacity of our software within our secure environment. While in this research, we publish results from one local authority (LA), we did apply these methods to four other LAs and obtained similar results overall in terms of representativeness. However, it is important to note that the results in this paper only apply to the chosen LA and cannot be generalised beyond this.
The ABHED is made up of three separate admin-based composite data sources: our Admin-based ethnicity dataset version 3.0 (ABED), our admin-based household estimates version 3.0 and our Admin-based housing stock version 1.0 (ABHS). See the hyperlinked text for further information on the creation of the composite data sources, including which single administrative datasets contributed to their development. Census 2021 contains information collected in 2021 about all people and households in England and Wales (for further information on the census, please refer to our Census 2021 web page).
At its core, the ABHED was created by extracting and combining data present within multiple administrative datasets. Rule-based methods were applied to determine a final value per person when values for a variable existed across more than one administrative dataset. The ABHED contains only people living in occupied addresses and considered to be usual residents within England and Wales in 2021. An occupied address is a unique property reference number (UPRN) on the address frame, which has been successfully linked to at least one individual in the Statistical Population Dataset version 3.0 (SPD V3.0). People living in communal establishments were removed. A managed communal establishment is a place that provides managed full-time or part-time supervision of residential accommodation, such as hotels. A usual resident is anyone who has stayed or intended to stay in the UK for more than 12 months as of a specified date (30 June 2021 for ABHED and 21 March 2021 for Census 2021), or, with a permanent UK address, was living outside of the UK with the intention of returning in less than 12 months. Please see our Census 2021 dictionary for further details. We included the equivalent population in Census 2021.
The ABHED was developed to test the feasibility of producing more frequent subnational multivariate statistics using administrative data. For further detail on the development of the ABHED, refer to our Developing sub-national multivariate housing by ethnicity statistics from administrative data, England and Wales: 2020 article. Please note that this research uses the version of ABHED updated with 2021 data.
To be able to run R-indicators and distance metrics, both Census 2021 and the ABHED must have an entry for the variables we selected for each record. Records with missing entries in the ABHED for any of the selected variables (age, sex, ethnicity, and accommodation type) were removed (23% of total records for the LA). Any missing entries in Census 2021 were previously resolved. For more details, please refer to our Item editing and imputation process for Census 2021, England and Wales methodology. For future applications, we recommend that missingness in the administrative dataset is resolved.
Distance metrics method
The distance metric method compares probability distributions in the administrative dataset with their equivalent in the population auxiliary dataset for each selected variable. These probability distributions contain the probability of having a certain variable category in the dataset, where the variable in these probability calculations could be singular (sex) or cross-tabulated (sex by age group).
The probability distributions are compared using a variety of standardised distance metrics, including Indicator of Dissimilarity, Hellinger's Distance and Kullback-Leibler Divergence. This comparison outputs a value between 0 and 1 for each variable, where a distance metric of 1 would indicate alignment between the two probability distributions and that the population in the administrative dataset is a reflection of the population auxiliary dataset.
We are trialling all three distance metrics to explore how well they each estimate the representativeness of the administrative dataset. Recommendation on which distance metric performs best should be future research.
See the User manual (PDF, 1.23MB) developed by Professor Natalie Shlomo and Dr Sook Kim for details on the calculations performed for the distance metric method.
R-indicators method
We calculate the probability of inclusion in the administrative data (participation propensity scores) based on the variables and their categories. This calculation takes both administrative and population auxiliary data into a regression model to create a participation propensity score distribution for the administrative data. The idea is to estimate the participation propensity scores according to a linear regression model, which uses estimates from population counts to derive the design matrix that is needed to estimate the regression coefficients. In other words, this model quantifies the expectation of a record (person) being included in the administrative dataset, given a certain variable category. An example would be being included in the administrative dataset and being male.
The R-indicator calculation looks at the overall variation between participation propensity scores for variable categories, and outputs an overall R-indicator value for the administrative dataset. The maximum standard deviation of a participation propensity score is 0.5, so we calculate the R-indicator as 1 minus double the standard deviation.
This R-indicator is a value between 0 and 1 where an R-indicator of 1 would signify that the administrative data are a reflection of the population auxiliary dataset (there is no variation in the participation propensity scores).
Unconditional partial R-indicators look at the amount of variation between participation propensity scores for variables and variable categories and can therefore pinpoint where any variations occur in the distribution. Partial R-indicators are essentially the "between" variance of the participation propensity scores. Therefore, they can take a value between 0 and 0.5, where a value closer to 0.5 would indicate that the variable or variable category had a maximum contribution to the lack of representativeness seen in the administrative dataset. A minus sign is added before a category level partial R-indicator to indicate that the variable category's contribution is a result of under-representation (between 0 and negative 0.5), and positive values indicate over-representation (between 0 and 0.5) compared with the population auxiliary dataset. A partial R-indicator of 0 for either a variable or a variable category would mean that it had zero impact on the overall R-indicator and has the same representation in the administrative dataset as in the population auxiliary dataset.
To our knowledge, there are no recommended thresholds or cut-offs for either method to indicate whether any lack of representation found is significant. See the User manual (PDF, 1.23MB), developed by Professor Natalie Shlomo and Dr Sook Kim, for details on the calculations performed for the R-indicator method. Future work will develop a bootstrap approach to obtain variance estimates to enable statistical testing on the significance of the lack of representativity. At this stage, using these methods, we can compare the lack of representation between variables and between variable categories.
Back to table of contents5. Results from applying the methods
The results in this section refer to the one local authority (LA) we applied these methods to. They cannot be generalised to other geographic areas.
Distance metrics
The distance metrics we used (Indicator of Dissimilarity, Hellinger's Distance (HD), and Kullback-Leibler Divergence) indicate that the probability distributions for all variables in the Admin-based housing by ethnicity dataset (ABHED) were similar to the variable probability distributions for Census 2021 (see Table 1, all with values above 0.9). A distance metric of 1 for a variable would indicate alignment between the two probability distributions. Therefore, the results suggest that the variables in the ABHED overall are closely matched to Census 2021, indicating good quality in terms of representativeness of the population.
Across all three distance metrics, sex had the highest distance metric value (around 0.99), indicating that relative to the other variables, the probability distribution of sex in the ABHED had the closest match to the probability distribution in Census 2021 (see Table 1). Therefore, sex, relative to the other variables, showed the highest representativeness in the ABHED. This could also be a result of sex having only two categories. HD and Kullback-Leibler performed similarly in terms of variable order according to distance metric score compared with Indicator of Dissimilarity. Given that HD closely follows the same variable order for Kullback-Leibler but gives a more conservative distance metric value, we will report on HD going forward.
Of the four variables, ethnicity (where HD is equal to 0.9402) and accommodation type (where HD is equal to 0.9403) had the lowest distance metrics, indicating that there were some differences between the ABHED and Census 2021 probability distributions for those variables, perhaps driven by one or more of the ethnic groups or accommodation types (Table 1). Combinations involving ethnicity or accommodation type resulted in lower distance metric values. Ethnicity by accommodation type variable produced the lowest distance metric value (where HD is equal to 0.9089). These results suggest that out of the four variables, ethnicity, and accommodation type showed the lowest quality in terms of representativeness in the ABHED.
| Std Indicator of Dissimilarity | Std Hellinger’s Distance | Std Kullback-Leibler | |
|---|---|---|---|
| Sex | 0.9856 | 0.9898 | 0.9994 |
| Ethnicity | 0.9585 | 0.9402 | 0.9753 |
| Accommodation type | 0.9316 | 0.9403 | 0.9801 |
| Age group | 0.9580 | 0.9662 | 0.9934 |
| Sex by Ethnicity | 0.9585 | 0.9391 | 0.9745 |
| Sex by Accommodation type | 0.9313 | 0.9393 | 0.9794 |
| Sex by Age group | 0.9569 | 0.9619 | 0.9915 |
| Ethnicity by Accommodation type | 0.9207 | 0.9089 | 0.9487 |
| Ethnicity by Age group | 0.9452 | 0.9286 | 0.9654 |
| Accommodation type by Age group | 0.9236 | 0.9272 | 0.9701 |
Download this table Table 1: Standardised distance metrics
.xls .csvR-indicators
As the overall R-indicator (0.513) is quite low, it suggests that there is lack of representation in the ABHED, compared with Census 2021, for one or more variables.
Table 2 shows the partial R-indicators at variable and variable category level. Figure 1 shows these results plotted by variable and Figure 2 shows them plotted by variable category. Partial R-indicators can tell you which variable and variable categories are contributing most or least to this potential lack of representativeness found in the ABHED, and in which direction (over or under-representation).
Overall, sex had the highest score in terms of representativeness in the ABHED, with a partial R-indicator of 0.0005. This was followed closely by age group, with a partial R-indicator of 0.0059, suggesting that there is very little difference in the representation of sex and age group in the ABHED, compared with Census 2021.
Of the four variables, ethnicity contributed most to the lack of representativeness in the ABHED, with a partial R-indicator of 0.0346. If we look at partial R-indicators at category level, we see that ethnic group five ("Other") is contributing more to this lack of representativeness seen in the ethnicity variable compared with the other ethnic groups, with a partial R-indicator of negative 0.1764. This indicates that this ethnic group is under-represented in the ABHED compared with Census 2021, or there are fewer people in the "Other" ethnic group compared with Census 2021. Previous research into the development of admin-based ethnicity statistics has highlighted the impact of different ethnicity selection rules on the proportion of the population in the "Other" ethnic group in comparison with census data, which could explain this under-representation.
Accommodation type contributed the second most to the lack of representativeness in the ABHED, compared with the other variables, with a partial R-indicator of 0.0172. Again, looking at the partial R-indicators at category level, this is potentially caused by a combination of an over-representation of accommodation type three (terraced) (0.0798) and an under-representation of accommodation type four (in a purpose-built block of flats or tenement) (negative 0.0643) in the ABHED, compared with the other accommodation types. These results are consistent with features already known about from the Admin-based housing stock dataset (ABHS) at national level for England and Wales, when compared with the 2011 Census (the ABHED "accommodation type" variable came from the ABHS). For further detail, please refer to our article on the development of the admin-based housing stock dataset. Here, the R-indicator method confirmed this result and gave an indication of representativeness in relation to the other variables, while also accounting for variable population size. In addition, the R-indicator results are consistent with the lower distance metrics found for the ethnicity and accommodation type variables.
| Variable | Partial R-indicator | |
|---|---|---|
| Sex | 0.0005 | |
| 1. Female | 0.0161 | |
| 2. Male | -0.0167 | |
| Ethnicity | 0.0346 | |
| 1. White | 0.0364 | |
| 2. Mixed | 0.0038 | |
| 3. Asian | -0.0444 | |
| 4. Black | -0.0118 | |
| 5. Other | -0.1764 | |
| Accommodation type | 0.0172 | |
| 1. Detached | 0.0041 | |
| 2. Semi-detached | -0.0487 | |
| 3. Terraced | 0.0798 | |
| 4. In a purpose-built block of flats or tenement | -0.0643 | |
| 5. Part of a converted or shared house, including bedsits | -0.0265 | |
| 6. Part of another converted building, for example, former school, church or warehouse | 0.0217 | |
| 7. In a commercial building, for example, in an office building, hotel or over a shop | 0.0558 | |
| 8. A caravan or other mobile or temporary structure | -0.0012 | |
| Age group | 0.0059 | |
| 1. 0-15 | 0.0470 | |
| 2. 16-24 | 0.0241 | |
| 3. 25-34 | -0.0392 | |
| 4. 35-44 | -0.0344 | |
| 5. 45-54 | -0.0119 | |
| 6. 55-64 | -0.0065 | |
| 7. 65-74 | 0.0002 | |
| 8. 75+ | 0.0155 | |
Download this table Table 2: Partial R-indicators
.xls .csv
Figure 1: Partial R-indicators by variable

Source: Office for National Statistics
Download this image Figure 1: Partial R-indicators by variable
.png (50.0 kB) .xlsx (15.9 kB)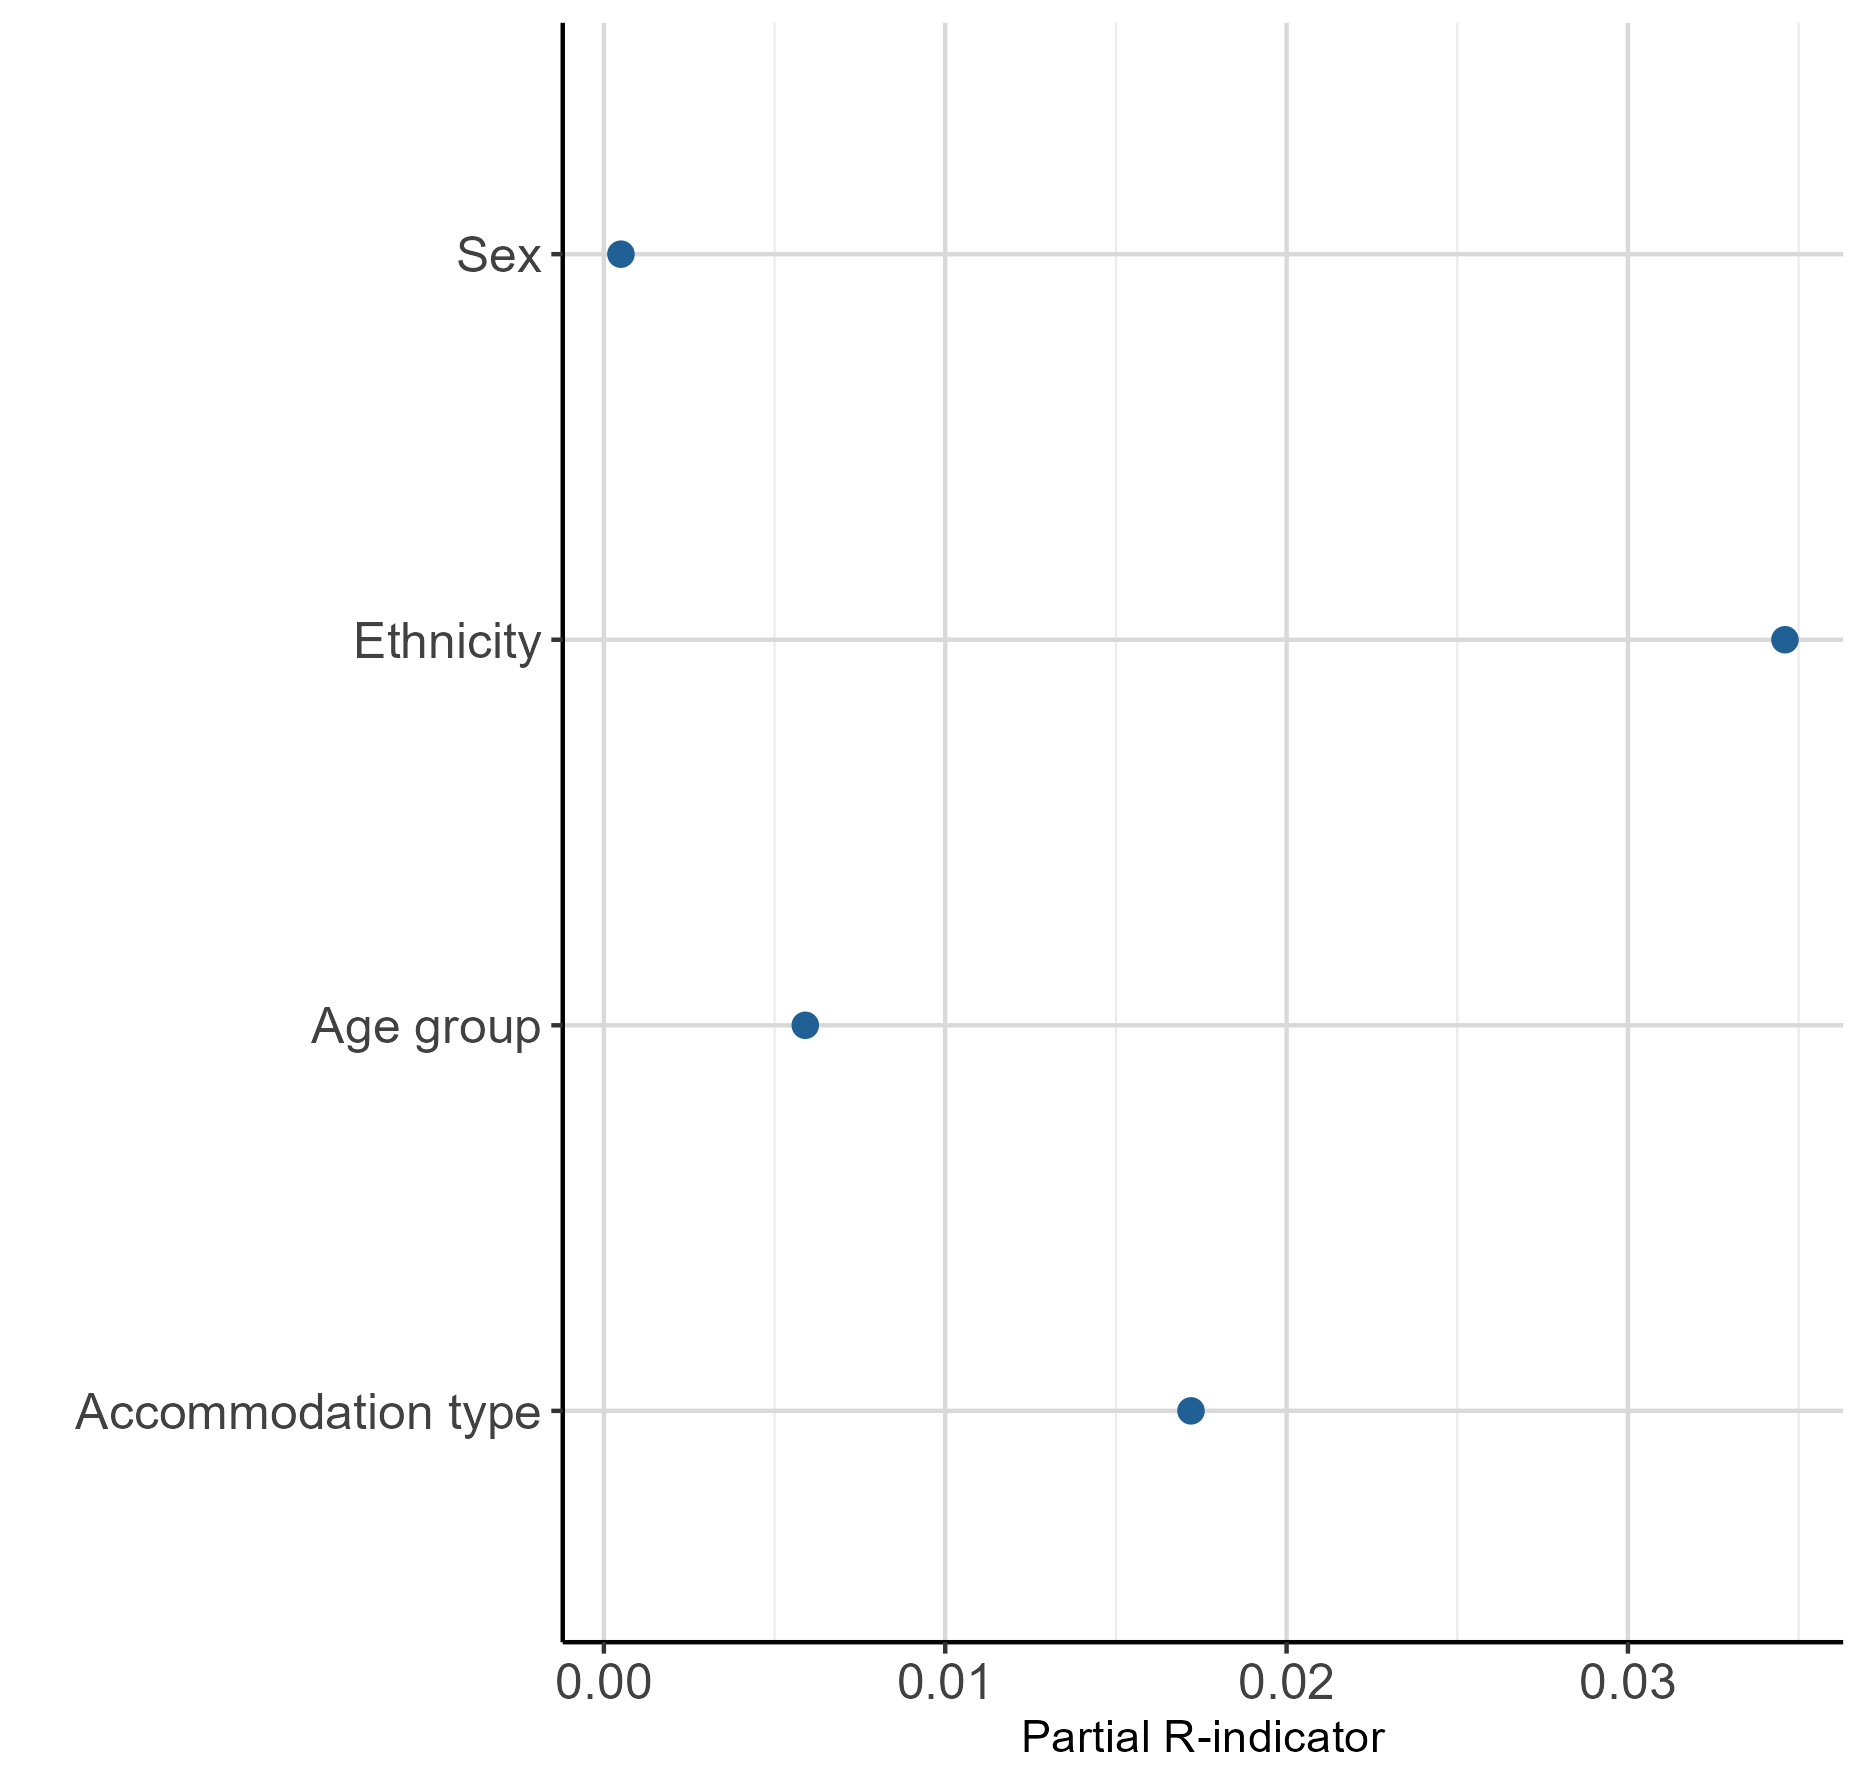
Figure 2. Partial R-indicators by variable category

Notes:
- For category labels, see Table 2.
Download this image Figure 2. Partial R-indicators by variable category
.png (197.9 kB) .xlsx (16.5 kB)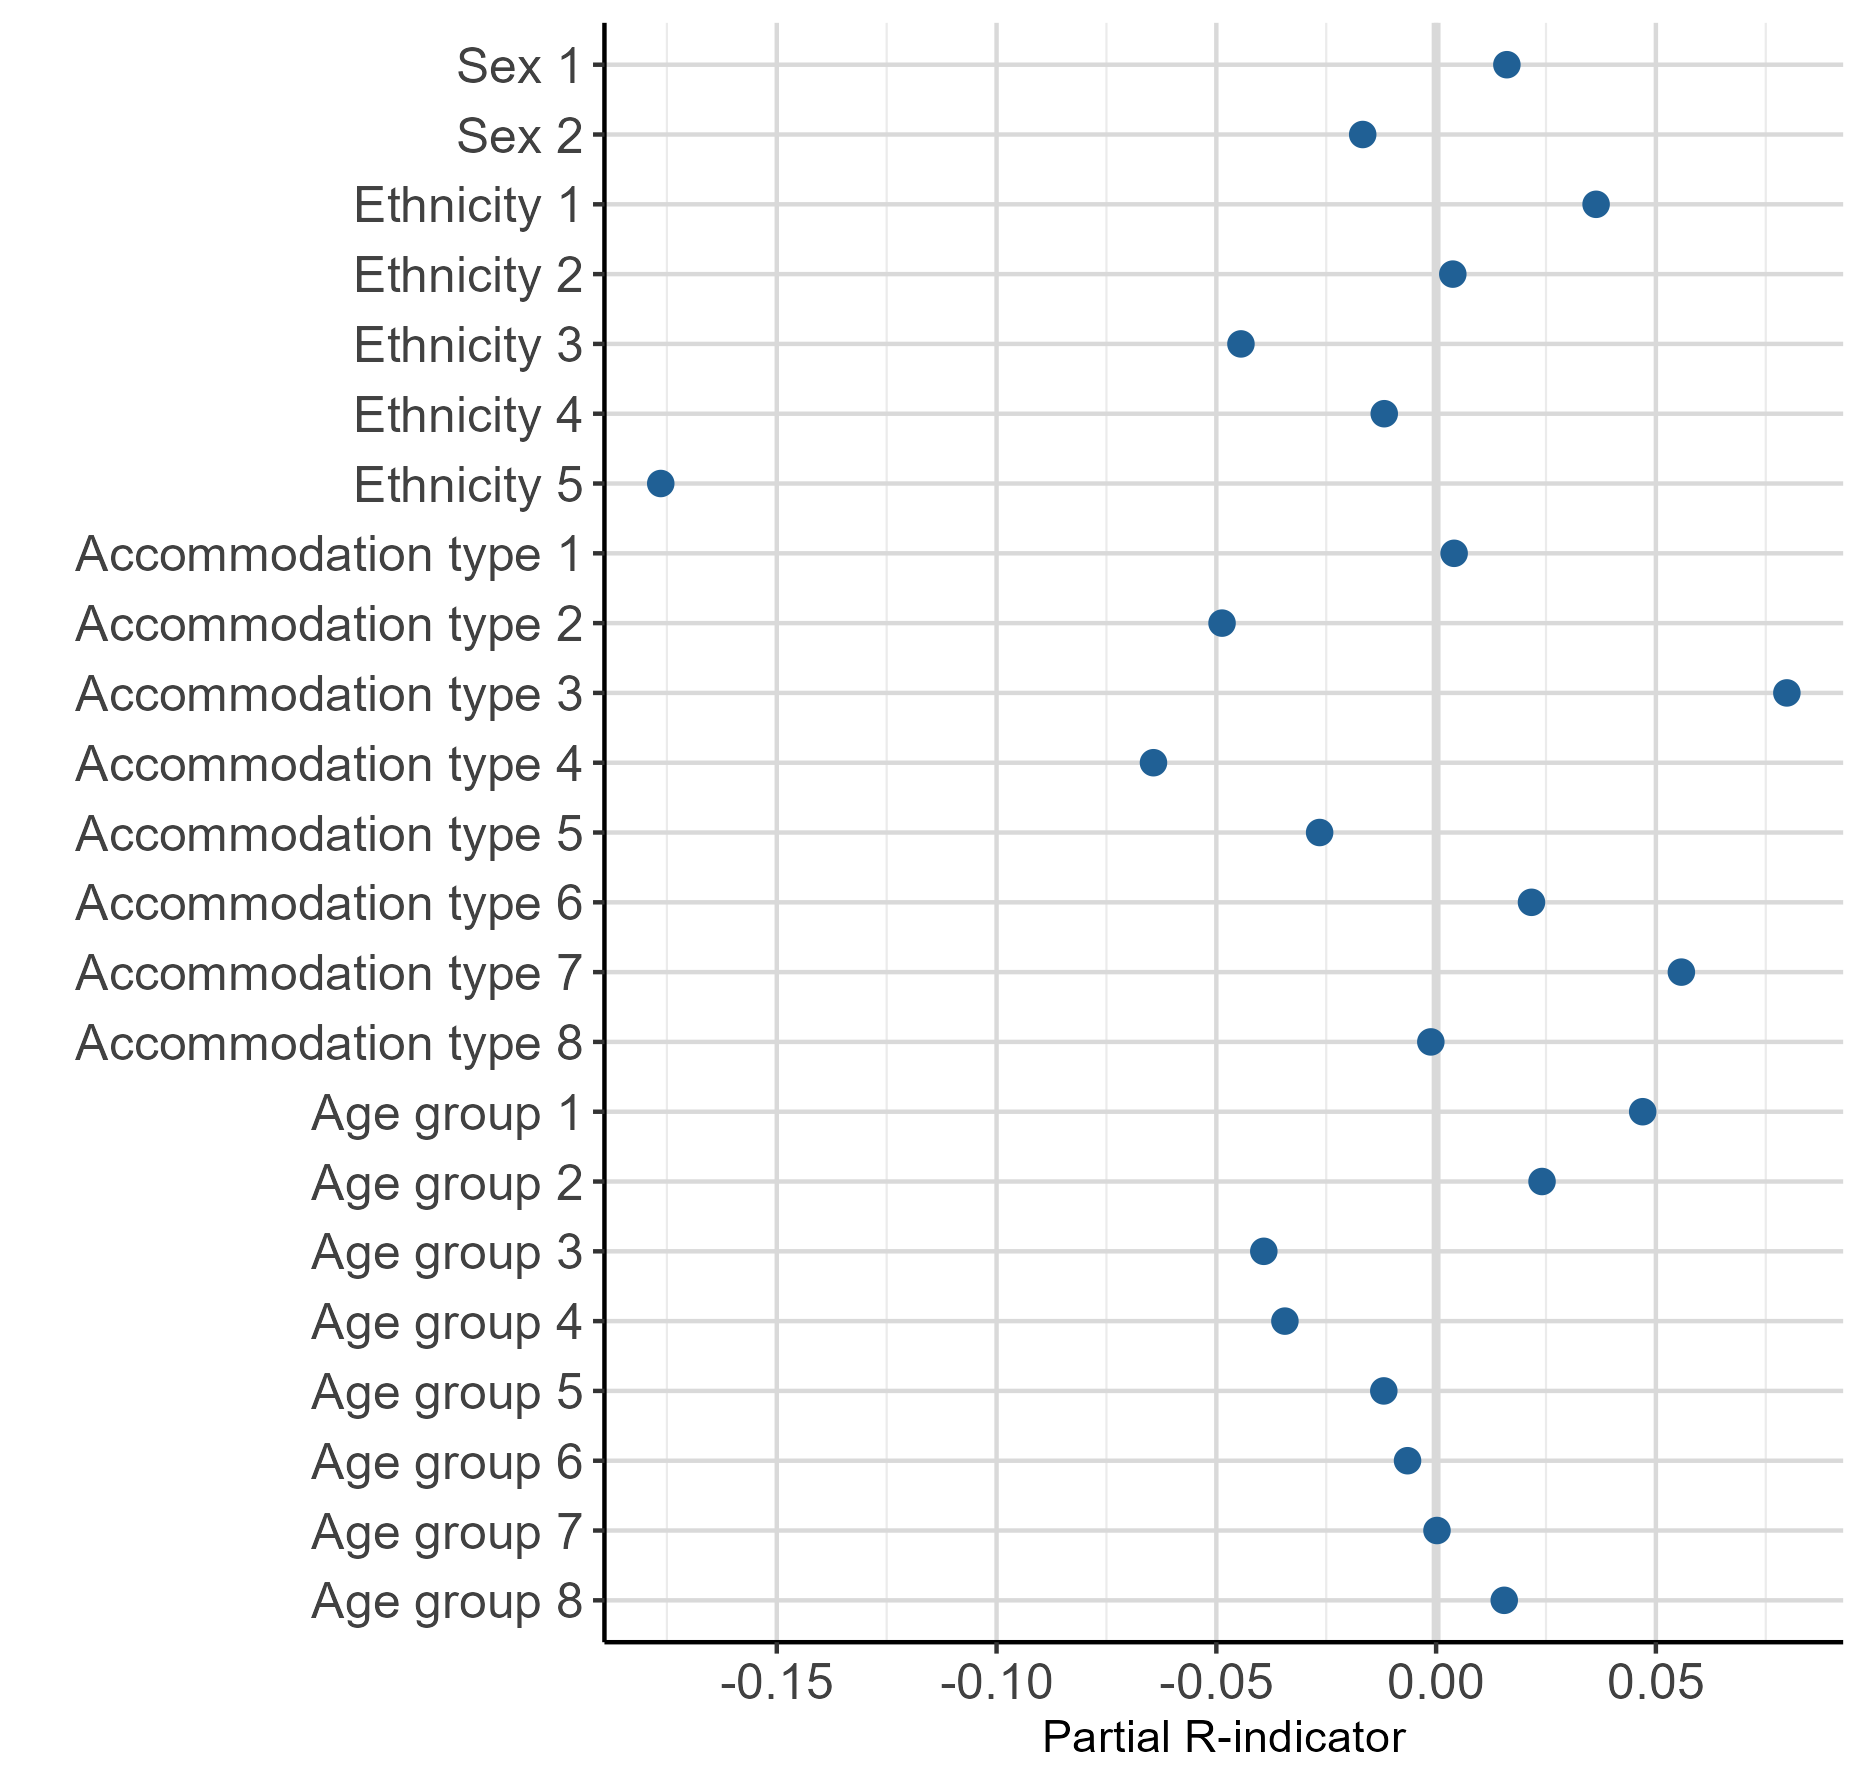
Limitations and considerations
The information provided from our results could be of interest during the early stages of administrative data selection, to help flag potential issues with representativeness that require further exploration. However, while our results from both R-indicators and distance metrics show a difference between the ABHED and Census 2021 in terms of variable representation, they cannot tell you the absolute magnitude of the problem. They can only be interpreted in terms of the relative comparison of representativeness between variables and variable categories in relation to the overall distance metric or R-indicator values.
In our application, only records without any missingness in our selected variables could remain in the ABHED. This resulted in the loss of data that could have been included to measure representativeness. In general, if there are missing data in the selected variables in both the administrative data and the population auxiliary dataset, they should be treated as an additional category of the variable. Future practical application of both methods would require missing values in administrative datasets to be resolved prior to application or the methods adapted to account for missingness in administrative data. We are continuing to research and develop methods for missingness in administrative data.
To run both the R-indicators and distance metrics at optimal performance, they require the administrative dataset and population auxiliary dataset to have at least three common variables, with comparable response categories. The R-indicator method is more effective as the number of variables included increases.
It is important to consider how the administrative dataset is formed and what impact that might have on the results of these methods and how they should be interpreted. For example, any lack of representation found in the ABHED could be owing to differences in the way the data were combined. This could mean that potential differences in the representativity of an administrative dataset may be owing to processes performed on the dataset rather than the raw data itself.
Back to table of contents6. Future developments
The purpose of this research was to assess if R-indicators and distance metrics are appropriate methods for assessing the quality of administrative data in terms of representativeness. Our results showed that when measured against Census 2021, some variables in our Admin-based housing by ethnicity dataset (ABHED) had high quality in terms of representativeness for the single local authority (LA) that we tested. Moreover, the partial R-indicators show the under and over-represented variable and variable categories for the LA tested.
Recommendations
To help decision making, we recommend further research into both R-indicators and distance metrics to develop thresholds that indicate when any lack of representativeness found is critical, and to what degree.
We recommend further research into distance metrics, and which is the best metric to use for measuring the quality of administrative data in terms of representativeness.
We recommend further research into addressing missingness in administrative data, as resolution of missing values is a requirement for the improved application of R-indicators and distance metric methods.
We recommend future application of the methods on larger datasets, such as national-level data. New R code from the University of Manchester has been developed to be able to derive R-indicators from aggregate data directly, which means that we could apply it to national-level data within our current secure environment, as opposed to a single LA; the University of Manchester will be updating the user guide and uploading this along with the new R code to the GitHub platform.
After applying the R-indicator method, the inverse of participation propensity scores can be used as weights to correct for the lack of representativeness found in the administrative data; further exploration into this is needed within the Office for National Statistics (ONS).
We recommend further research into the application of these methods to different administrative data scenarios, such as looking at how well these methods assess changes in the representativeness of an administrative dataset with new data deliveries over time.
Further research is needed to produce confidence intervals around the overall R-indicator and partial R-indicators.
If you have any questions, comments or would like to collaborate with the Methodological Research Hub, please contact methods.research@ons.gov.uk.
Acknowledgements
We would like to thank Professor Natalie Shlomo, Dr Sook Kim and the University of Manchester for developing and providing us with the method and code to apply R-indicators and distance metrics to administrative data at the ONS. We would also like to thank them for their input and support throughout this research. We are also grateful to our colleagues within the ONS for their support and topic knowledge. This research was funded in partnership with the ONS by the Methodological advancements on the use of administrative data in official statistics grant from the Economic and Social Research Council (ESRC), ES/V005456/1, United Kingdom.
Back to table of contents8. Cite this methodology
Office for National Statistics (ONS), released 8 December 2023, ONS website, methodology, Quality indicators for representativeness in administrative data: R-indicators and distance metrics