In this section
1. Background to conjoint study
Official statistics are often quoted by statistical producers and users as uniquely valuable and essential for evidence-based decision-making, for political accountability and for the public good. They are produced following the principles laid out in the Code of Practice for Official Statistics and are assessed by the Office for Statistics Regulation to ensure they are fit for purpose. However, justification for the investment in resources to produce official statistics and their products is now needed more than ever to further show value and evidence a good return on investment. Producers and investors in official statistics are also keen to understand the impact of their outputs to have further insight into the public perception of the value and usefulness of official statistics.
This report explores the potential of using conjoint methodology to elicit "willingness to pay" estimates for official statistics. It builds on a previous Office for National Statistics (ONS) pilot study (Valuing official statistics with conjoint analysis: April 2021) and uses hypothetical questions around the ONS website to indirectly value the features (or attributes) that respondents are influenced by.
Back to table of contents2. Aim of conjoint study
This approach looks at the potential to produce realistic willingness to pay (WTP) estimates for official statistics. It uses an online "stated preference" survey conducted by Ipsos UK on behalf of the Office for National Statistics (ONS). The approach looks to indirectly put a value on some features (also known as attributes) of official data by offering "hypothetical" purchase scenarios to respondents.
These scenarios include options on the level of access and functionality of the ONS website, combined with options of varying monthly price level subscriptions (Table 1). The ONS website is used as it is a tangible non-market product, with clearly defined attributes for valuation.
To test the viability of the method, the survey used a split sample (two groups with similar demographic profiles). This is to enable comparison of the groups, as each group responded to conjoint studies that differed only in the price range offered (Table 1). If the WTP distributions are similar between the groups, regardless of the price range offered, the conjoint method could help offer a way to put a value on official statistics (a non-market good).
Each sample was representative of the UK population according to age range, sex, geography and socio-economic class.
The study also provides insight into how respondent sub-groups use and value the various features of the ONS website.
Back to table of contents3. Main findings
This exploration of the conjoint method to value official statistics (a non-market good) suggests that respondents are influenced by the price range offered to them through trade-off questioning. Respondents to Conjoint B (with the higher maximum subscription price) have a consistently higher median willingness to pay when compared with respondents in Conjoint A. However, these findings are dependent on the study design, the sample composition and the methods used to calculate utilities and willingness to pay – all of which need to be investigated further.
People would rather have access to the Office for National Statistics (ONS) website than not, and they showed more willingness to pay to access articles, all topic areas and to have no advertising.
People willing to pay for access to the ONS website tend to:
be younger
be current users
have a greater familiarity with the website and its data
use data in their jobs
see themselves as data experts, technical users or analysts and more likely to make more use of data
Respondents who see themselves as data experts, technical users or analysts using data in their jobs had "higher" level of willingness to pay than more general data users.
Back to table of contents4. Future developments
In the future we plan to explore the linear interpolation between price levels to investigate if approximation is driving the differences in willingness to pay (WTP) distributions. We will also potentially use Sawtooth software, an alternative model to calculate willingness to pay, to compare WTP distributions with the current model used.
Additionally, we will use respondent raw responses to this survey to model alternative respondent utilities. We will also compare model fits to decide on what is the most appropriate method to derive utilities.
WTP was found to be higher and more variable with expert users, the next study will focus on a larger sample of expert users and others who currently pay for data to explore the possibility to elicit potential estimates. Qualitative questioning to understand drivers of value for these users can also be beneficial.
Back to table of contents5. Introduction to conjoint analysis
Conjoint analysis is a survey-based technique that derives customer preferences from their purchasing decisions. When used to value a non-market good (such as official statistics), there is no market information, such as market shares, to inform on customer value judgements. Therefore, conjoint analysis acts in this situation as a "stated preference" technique. Respondents are placed in a hypothetical situation when being asked how much they would pay for specific configuration of products.
Respondents to a conjoint study are asked a series of questions, each time to choose their preference between different products described by varying levels of underlying attributes. These questions are typically called "trade-off" questions, where levels of attributes are "considered jointly".
The preferences can be used to represent the relative value (or utility) an individual has for the level tested in each attribute. Adding the utilities for each level across all attributes that define a product can produce a utility for the overall product (compared with a baseline product).
For example, a television might be described using three attributes: brand, screen-size and price. A specific television might have a brand level of Panasonic, a screen-size level of 54 inches and a price level of £1,000. The utility a customer has for this television will simply be the sum of their utilities for each appropriate level of these attributes.
With price as an attribute, it is possible to calculate a "willingness to pay", which is the maximum amount a respondent is willing to pay for a certain level of an attribute (over a baseline level).
One main use of relative utilities is to derive "preference shares" where each respondent's preference for a specific product, among a set of products, is modelled. With appropriate weighting it is possible to create preference shares representing the population. With the assumptions that all products in a market are available to everyone, respondents have full understanding of attributes, and products have reached market maturity these preference shares can be used to denote actual market shares that should be expected given a set of products defining the market.
Back to table of contents6. Survey design
A conjoint study describes a product by its main features (varying levels of underlying attributes). If price is one of the attributes, then the levels of price shown to respondents should be realistic for prices shown in a market. However, official statistics are a non-market good (for example, a good that is provided freely and subsequently has no market to establish a realistic price range) and it can therefore be difficult to conceptualise value. For more information, see our Valuing official statistics with conjoint analysis: April 2021 working paper, and a subsequent paper looking at the potential social value of data undertaken by the Bennett Institute of Public Policy.
This conjoint study looks to indirectly value attributes (features) of official statistics by using the Office for National Statistics (ONS) website – which offers a real non-market product. It looks to test the value judgements of respondents to see if they are influenced by the option of "hypothetical" scenarios of monthly varying price-level subscriptions (Table 1) when presented with different attributes and levels for valuation around the functionality of the ONS website.
Attributes and levels used to describe the functionality of the ONS website
The attributes and levels used to describe the ONS website are:
access to articles attribute (Level 1 does not have access written articles about the data, Level 2 has access to written articles about the data)
ability to download data attribute (Level 1 is unable to download the data, Level 2 can download the data to XLS and CSV format)
use of adverts attribute (for Level 1 adverts will appear on the website, for Level 2 no adverts appear on the website)
topic areas attribute (Level 1 has access to one topic area, for example population or economy or health, Level 2 has access to all topic areas)
| Price Attribute | Level 1 | Level 2 | Level 3 | Level 4 |
|---|---|---|---|---|
| Cost per month (Conjoint A) | FREE | £1 | £3 | £5 |
| Cost per month (Conjoint B) | FREE | £3 | £5 | £8 |
Download this table Table 1: Levels of price attribute for Conjoint A and Conjoint B
.xls .csvSample design for conjoint study
A robust representative sample of the public (N=1,722) was taken from the Ipsos UK Interactive Service Panel (residents aged 16 years and over). Respondents were assigned between two groups, each representative of each other to enable comparison of results between the groups.
The two groups (known as Group A, N=861 and Group B, N=861) were interviewed using one of the two conjoint studies (Conjoint A and Conjoint B, respectively). The conjoint studies differed only in the range of levels for the price attribute, with Conjoint B having a wider price range (Conjoint A, £1, £3 and £5, and Conjoint B, £3, £5 and £8) with both having a free option (Table 1).
How the survey was conducted
The study was designed to ensure respondents were provided with enough information and cognitively prepared to answer the conjoint trade-off questions. Before starting, respondents were taken through each attribute and a realistic threshold time was set so people had time to read and make informed preference decisions. To improve robustness, survey "speedsters", those who complete the survey in an unreasonable short period of time, as a standard are removed.
Respondents received standard questioning before being asked to explore the ONS website. After their familiarisation of the website, respondents returned to a sequence of conjoint trade-off questions asking how much they would be willing to pay for different configurations of website access and functionality. Each trade-off gave the respondent the option to prefer "none" of the configurations.
Sawtooth software is used and has an in-built randomised design based on established principles that creates a balanced set of tasks for the choices and trade-offs. The established principles used are:
"minimal overlap" – an attribute's number of levels is equal to the number of product concepts in a task, each level is shown exactly once
"level balance" – each level of an attribute is shown approximately an equal number of times
"orthogonality" – attribute levels are chosen independently of other attribute levels, so that each attribute level's effect (utility) may be measured independently of all other effects
In conjoint designs, there is a trade-off between what is realistic and how respondents behave in a survey.
To minimise strategic responses (for example, refusal to consider any payment), respondents were reminded that the data on the ONS website is freely available and there was no intention to introduce charges.
The highest subscription level was set at £8. This was set as the upper range to avoid introducing a hypothetical bias and an unrealistic option, making it more likely for respondents to select the "none" option. It was important to put realistic options in place and not to artificially inflate the importance of the price attribute.
Utility values for the levels of each attribute were calculated using the inbuilt hierarchical modelling functionality of Sawtooth software. The Hierarchical Bayes (HB) algorithm fits a Multinomial Logit Model to each individual respondent using an iterative approach that maximises the posterior likelihood. In other words, HB finds the optimum set of utility parameters given the observed respondent data and the knowledge about the rest of the sample. It is called hierarchical as respondent data (lower model) is supplemented by the data for the total sample, known as the population (upper model). This additional information from the population strengthens the estimation for individual respondents by looking at how different the respondent data is compared with the population. The resulting output is a set of parameters, known as utility scores (one for every level of attribute tested) and measures the desirability of each level relative to the other levels in the attribute.
Back to table of contents7. Analysis to ensure samples are representative
Initial checks were done to verify that the two samples were representative of each other using standard profiling variables (of age, highest education and social group) so that their conjoint results could validly be compared.
Other comparisons were on variables specific to this study, including:
data user type (which of the following best describes your use of statistical data?)
familiarity with the Office for National Statistics (ONS) website (how familiar, if at all, were you with the ONS data website beforehand?)
usage of ONS website (how often have you visited the ONS data website in the past year?)
After exploring the website, 47% of respondents in Conjoint A and 44% in Conjoint B, indicated that they would not pay anything for access to the website. The modelling to derive utilities treated these respondents as a separate group (the indication to pay was used as a co-variate in the Hierarchical Bayes estimation of the utilities) to respondents who would be willing to pay something.
| Willing to Pay | Unwilling to Pay | |
|---|---|---|
| Conjoint A | N = 460 (53%) | N = 401 (47%) |
| Conjoint B | N = 478 (56%) | N = 383 (44%) |
Download this table Table 2: Conjoint A and B samples sizes
.xls .csvDifferences were seen between these two groups in the frequency comparisons, indicating that these groups do have different profiles to each other.
Examples of these differences are illustrated in Figure 1, Figure 2, Figure 3, Figure 4, Figure 5 and Figure 6.
Figure 1: Number of people within age groups in Conjoint A and Conjoint B willing to pay
Office for National Statistics and Ipsos UK conjoint study, March 2022
Source: Office for National Statistics and Ipsos – Conjoint study
Download this chart Figure 1: Number of people within age groups in Conjoint A and Conjoint B willing to pay
Image .csv .xls
Figure 2: Number of people within the age groups in Conjoint A and Conjoint B unwilling to pay
Office for National Statistics and Ipsos UK conjoint study, March 2022
Source: Office for National Statistics and Ipsos – Conjoint study
Download this chart Figure 2: Number of people within the age groups in Conjoint A and Conjoint B unwilling to pay
Image .csv .xlsFigure 1 and Figure 2 indicates that respondents who are willing to pay for the ONS website are younger overall (especially in the aged 16 to 34 years group).
Figure 3: Number of people who were willing to pay when asked if they were familiar with the ONS data website beforehand
Office for National Statistics and Ipsos UK conjoint study, March 2022
Source: Office for National Statistics and Ipsos – Conjoint study
Download this chart Figure 3: Number of people who were willing to pay when asked if they were familiar with the ONS data website beforehand
Image .csv .xls
Figure 4: Number of people who were unwilling to pay when asked if they were familiar with the ONS data website beforehand
Office for National Statistics and Ipsos UK conjoint study, March 2022
Source: Office for National Statistics and Ipsos – Conjoint study
Download this chart Figure 4: Number of people who were unwilling to pay when asked if they were familiar with the ONS data website beforehand
Image .csv .xlsFigure 3 and Figure 4 indicates that respondents who are willing to pay for the ONS website tend to have greater familiarity with it than those who are unwilling to pay.
Figure 5: Number of people willing to pay by user type
Office for National Statistics and Ipsos UK conjoint study, March 2022
Source: Office for National Statistics and Ipsos – Conjoint study
Download this chart Figure 5: Number of people willing to pay by user type
Image .csv .xls
Figure 6: Number of people unwilling to pay by user type
Office for National Statistics and Ipsos UK conjoint study, March 2022
Source: Office for National Statistics and Ipsos – Conjoint study
Download this chart Figure 6: Number of people unwilling to pay by user type
Image .csv .xlsFigure 5 and Figure 6 indicate that respondents who are willing to pay are more likely to see themselves as data experts, technical users or to be analysts using data in their jobs. Respondents were asked to indicate the most appropriate definition for their current data usage. It is possible that a respondent considers themself to belong to more than one of these definitions, however the study assumes the definitions are mutually exclusive.
A further comparison on the usage of the ONS website is contained in the Annex in Figure 16 and Figure 17. This comparison shows that respondents who are willing to pay have used the ONS website more than those who are unwilling to pay.
Another comparison was made with respondents who were detected as preferring the "none" option frequently in the conjoint trade-off questioning.
The interview detected if respondents used the "none" option more than four times (out of the eight questions asked) and asked them to explain why. In Conjoint A, 30% of respondents were detected as frequently opting for "none", in Conjoint B this was 34%. Of these, 87% of respondents in Conjoint A were not willing to pay at all for access to the ONS website versus 73% in Conjoint B. The main reason given was that these respondents did not agree with paying for ONS data (64% in Conjoint A and 62% in Conjoint B).
Although there are differences between the groups of those who said they were or were not willing to pay something, these differences are similar in both conjoint studies.
Back to table of contents8. Analysis of willingness to pay
Conjoint studies derive relative utilities for the levels within each attribute. If price is one of these attributes, then it can be possible to derive the willingness to pay (WTP) for a change in the level of an attribute of a product. In this study, our main interest is to investigate if the WTP distribution for each non-price attribute of the Office for National Statistics (ONS) website (access to articles, ability to download data, no adverts and all topic areas) is similar for respondents of Conjoint A and Conjoint B.
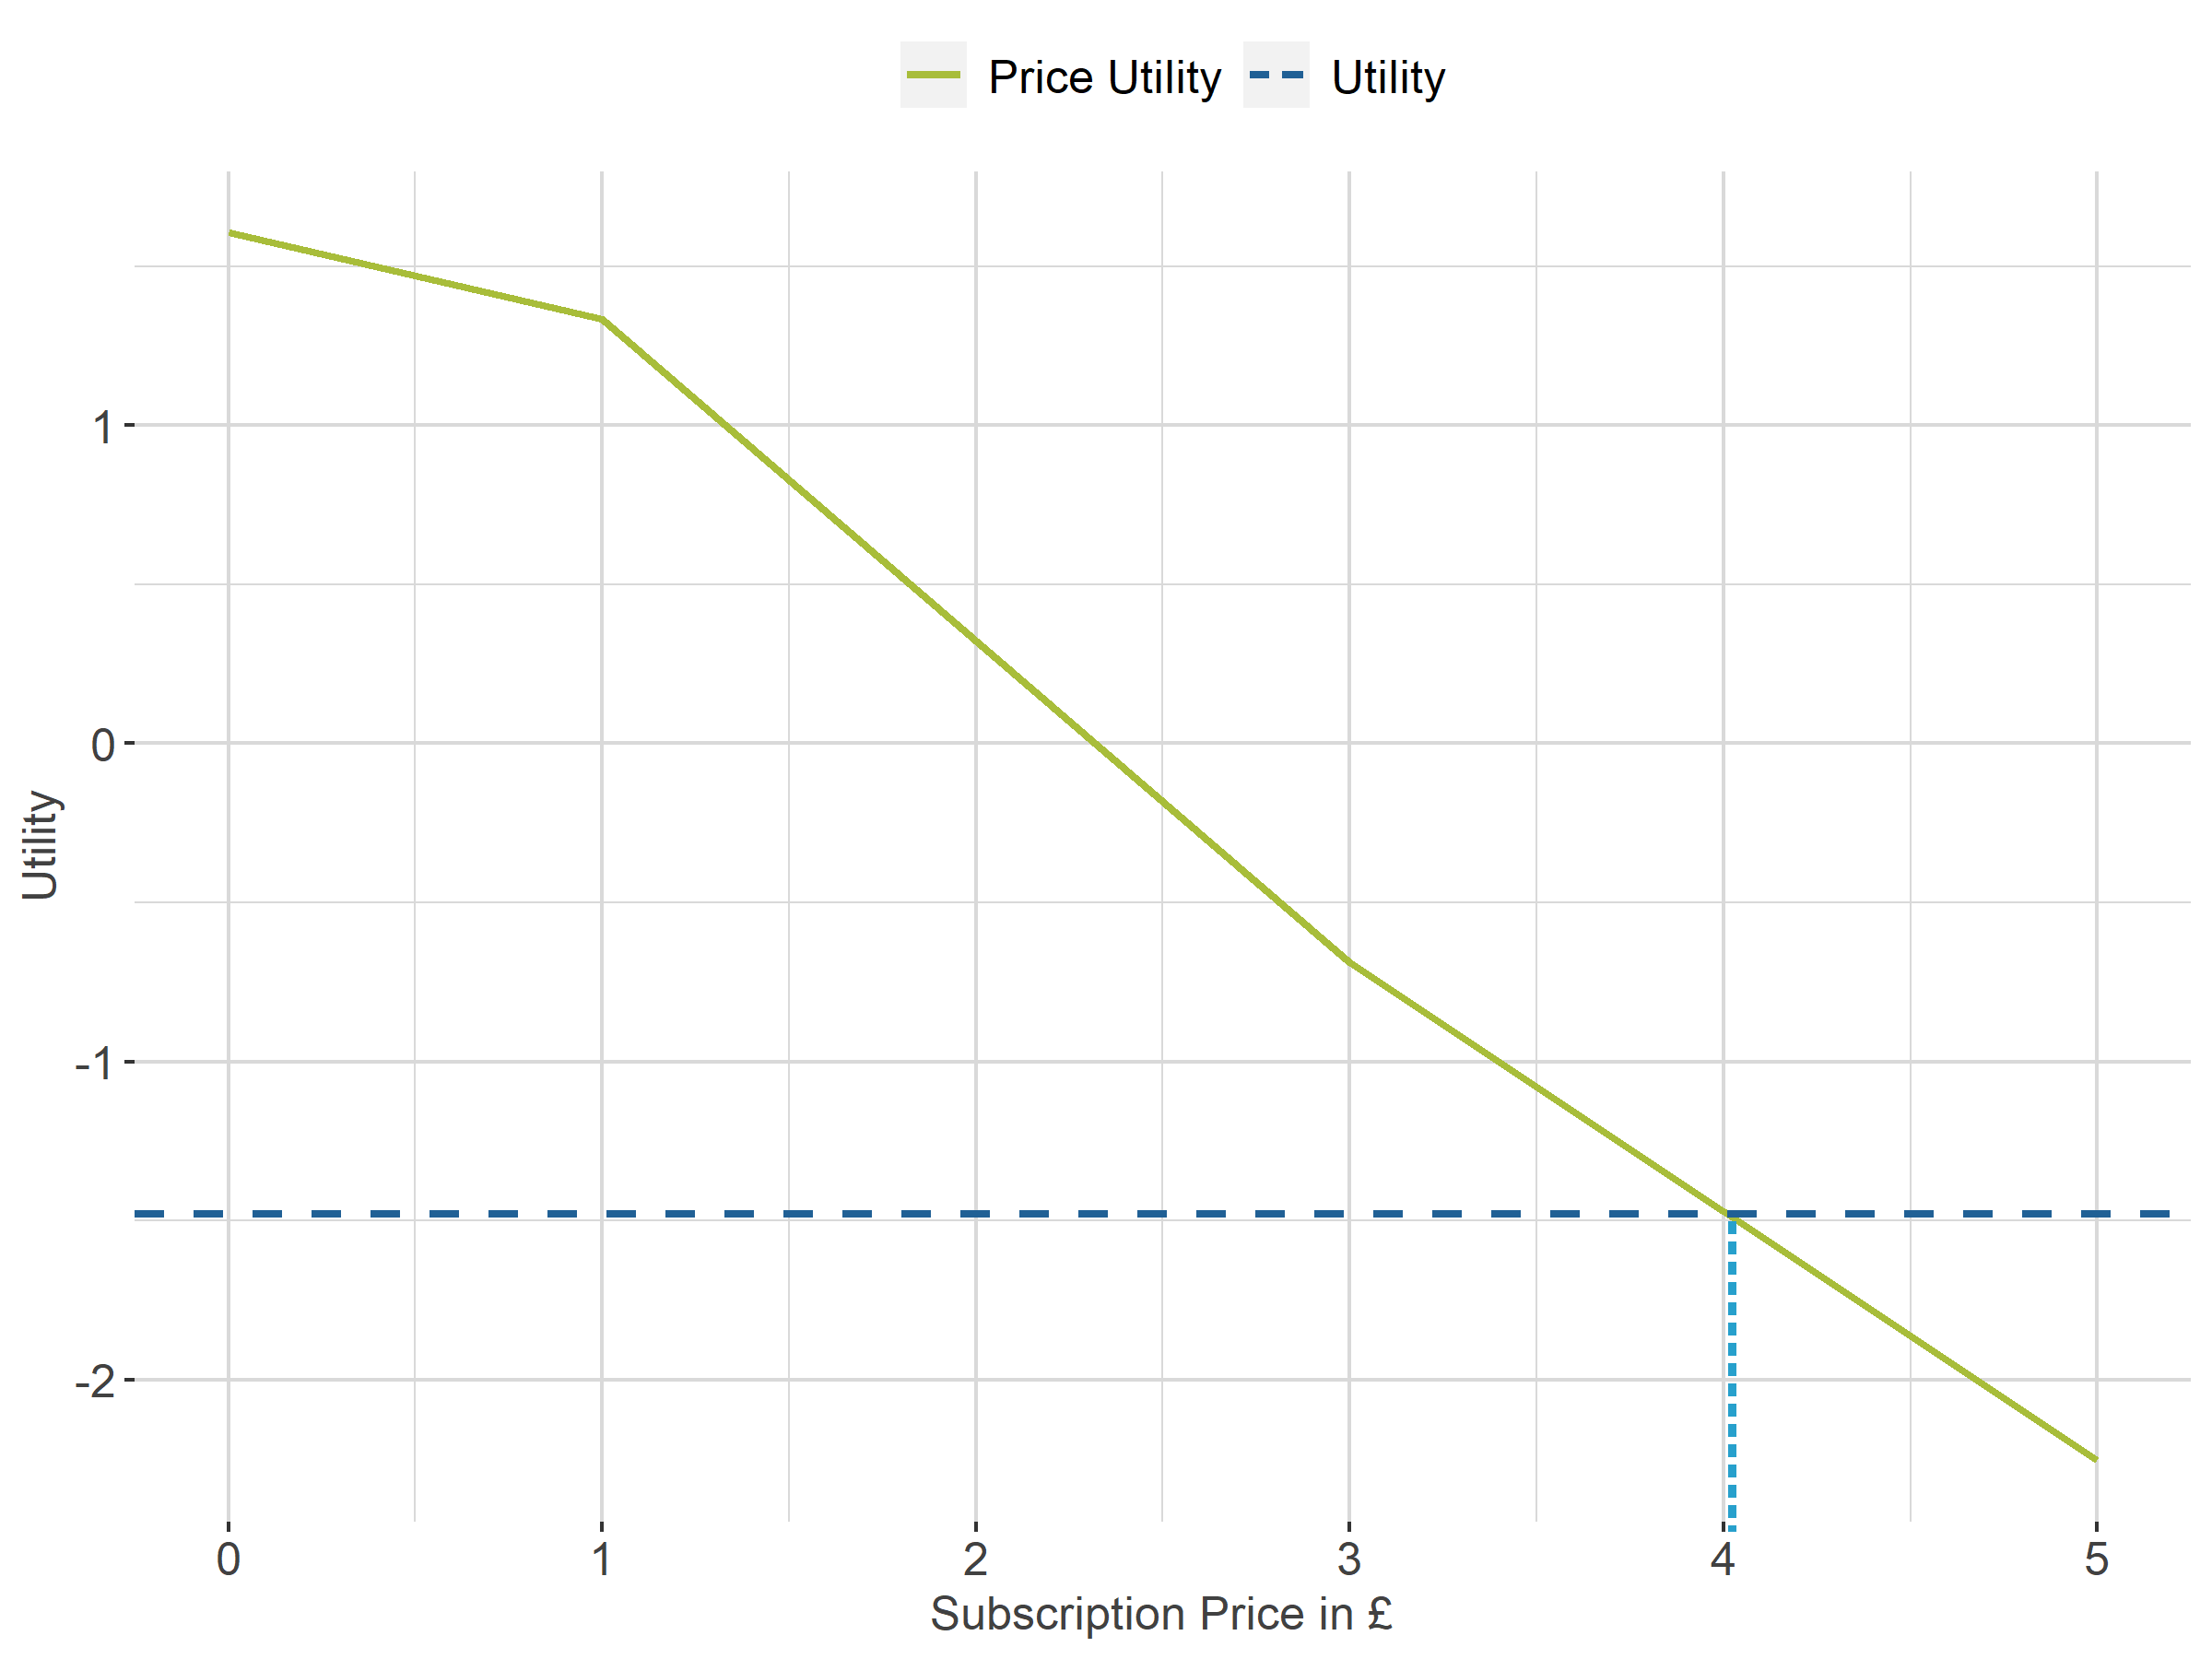
Using the price utilities, and interpolation, it is possible to create price utility curves for each respondent representing their marginal WTP (that is, the marginal increase in utility for a reduction in price).
Figure 7 illustrates a price utility curve for a typical respondent. The respondent has a utility of 1.480 for access to articles compared with not having access.
The respondent's price utility curve is shown together with a horizontal line depicting a utility of minus 1.480. The WTP is calculated by interpolation of the price utilities at the point at which the horizontal line crosses the price curves. The point that the price utility is minus 1.480 is £4.01 using the price utility curve. This represents the WTP for access to articles (compared with not having access to articles).
Figure 7: Willingness to pay for a single respondent
Office for National Statistics and Ipsos UK conjoint study, March 2022
Source: Office for National Statistics and Ipsos – Conjoint study
Download this image Figure 7: Willingness to pay for a single respondent
.png (37.1 kB) .xlsx (18.7 kB)
WTP values were calculated for all non-price attribute levels and for all respondents in Conjoint A and Conjoint B.
The distributions of these WTP values reveal that there are clear differences by group.
Respondents who initially said they would not pay for the ONS website are shown to have lower WTP than respondents who would be willing to pay. This is seen in both Conjoint A and Conjoint B. This is reasonable as the conjoint trade-off questions would have profiled the ONS website as being "free" multiple times. If more than one profiled product was "free", respondents might have considered their value for other attributes to make a preference. This additional value would have been detected in the utility modelling but overall, these values are smaller than for respondents who are willing to pay.
In both conjoints, there is a much larger range of WTP values for those who said they would pay.
Figure 8: Distribution of willingness to pay in Conjoint A
Office for National Statistics and Ipsos UK conjoint study, March 2022

Source: Office for National Statistics and Ipsos – Conjoint study
Download this image Figure 8: Distribution of willingness to pay in Conjoint A
.png (51.3 kB) .xlsx (70.7 kB)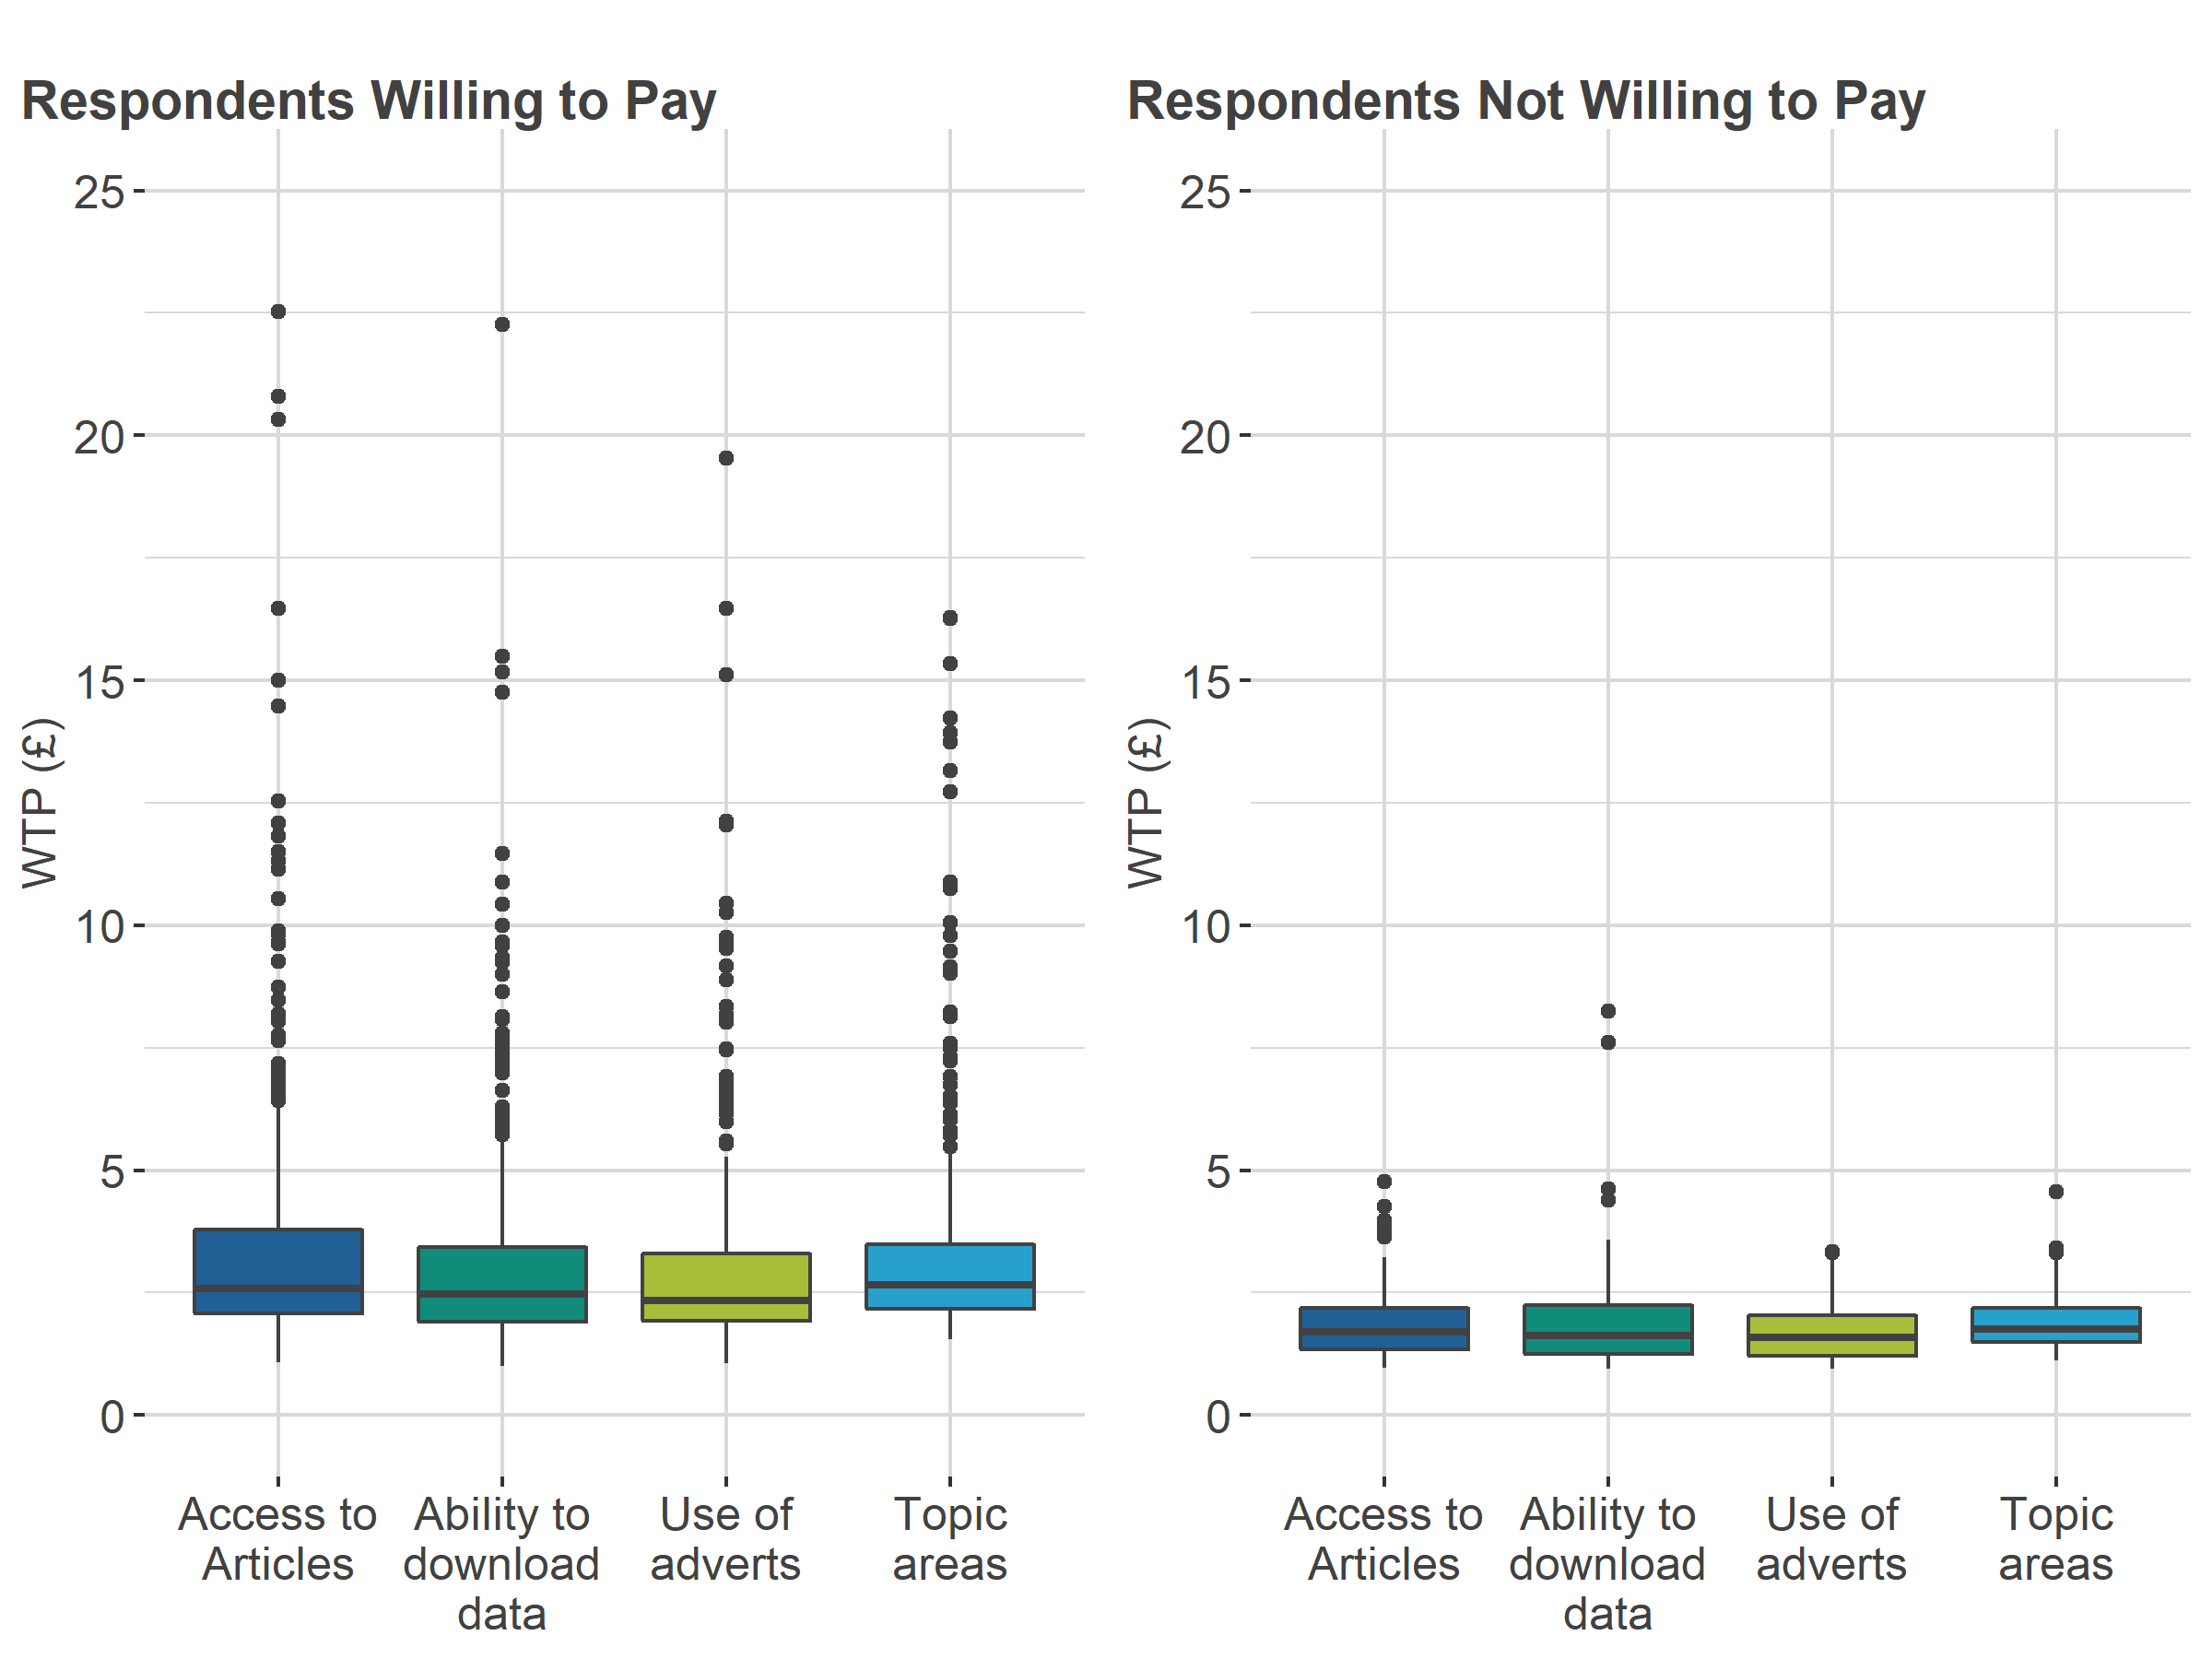
| All Respondents | Willing to pay | Not willing to pay | |
|---|---|---|---|
| WTP Access to articles | 2.16 | 2.59 | 1.71 |
| WTP Ability to download | 2.11 | 2.46 | 1.61 |
| WTP no adverts | 2 | 2.34 | 1.59 |
| WTP All topic areas | 2.2 | 2.66 | 1.75 |
Download this table Table 3: Median willingness to pay in pounds for Conjoint A
.xls .csv
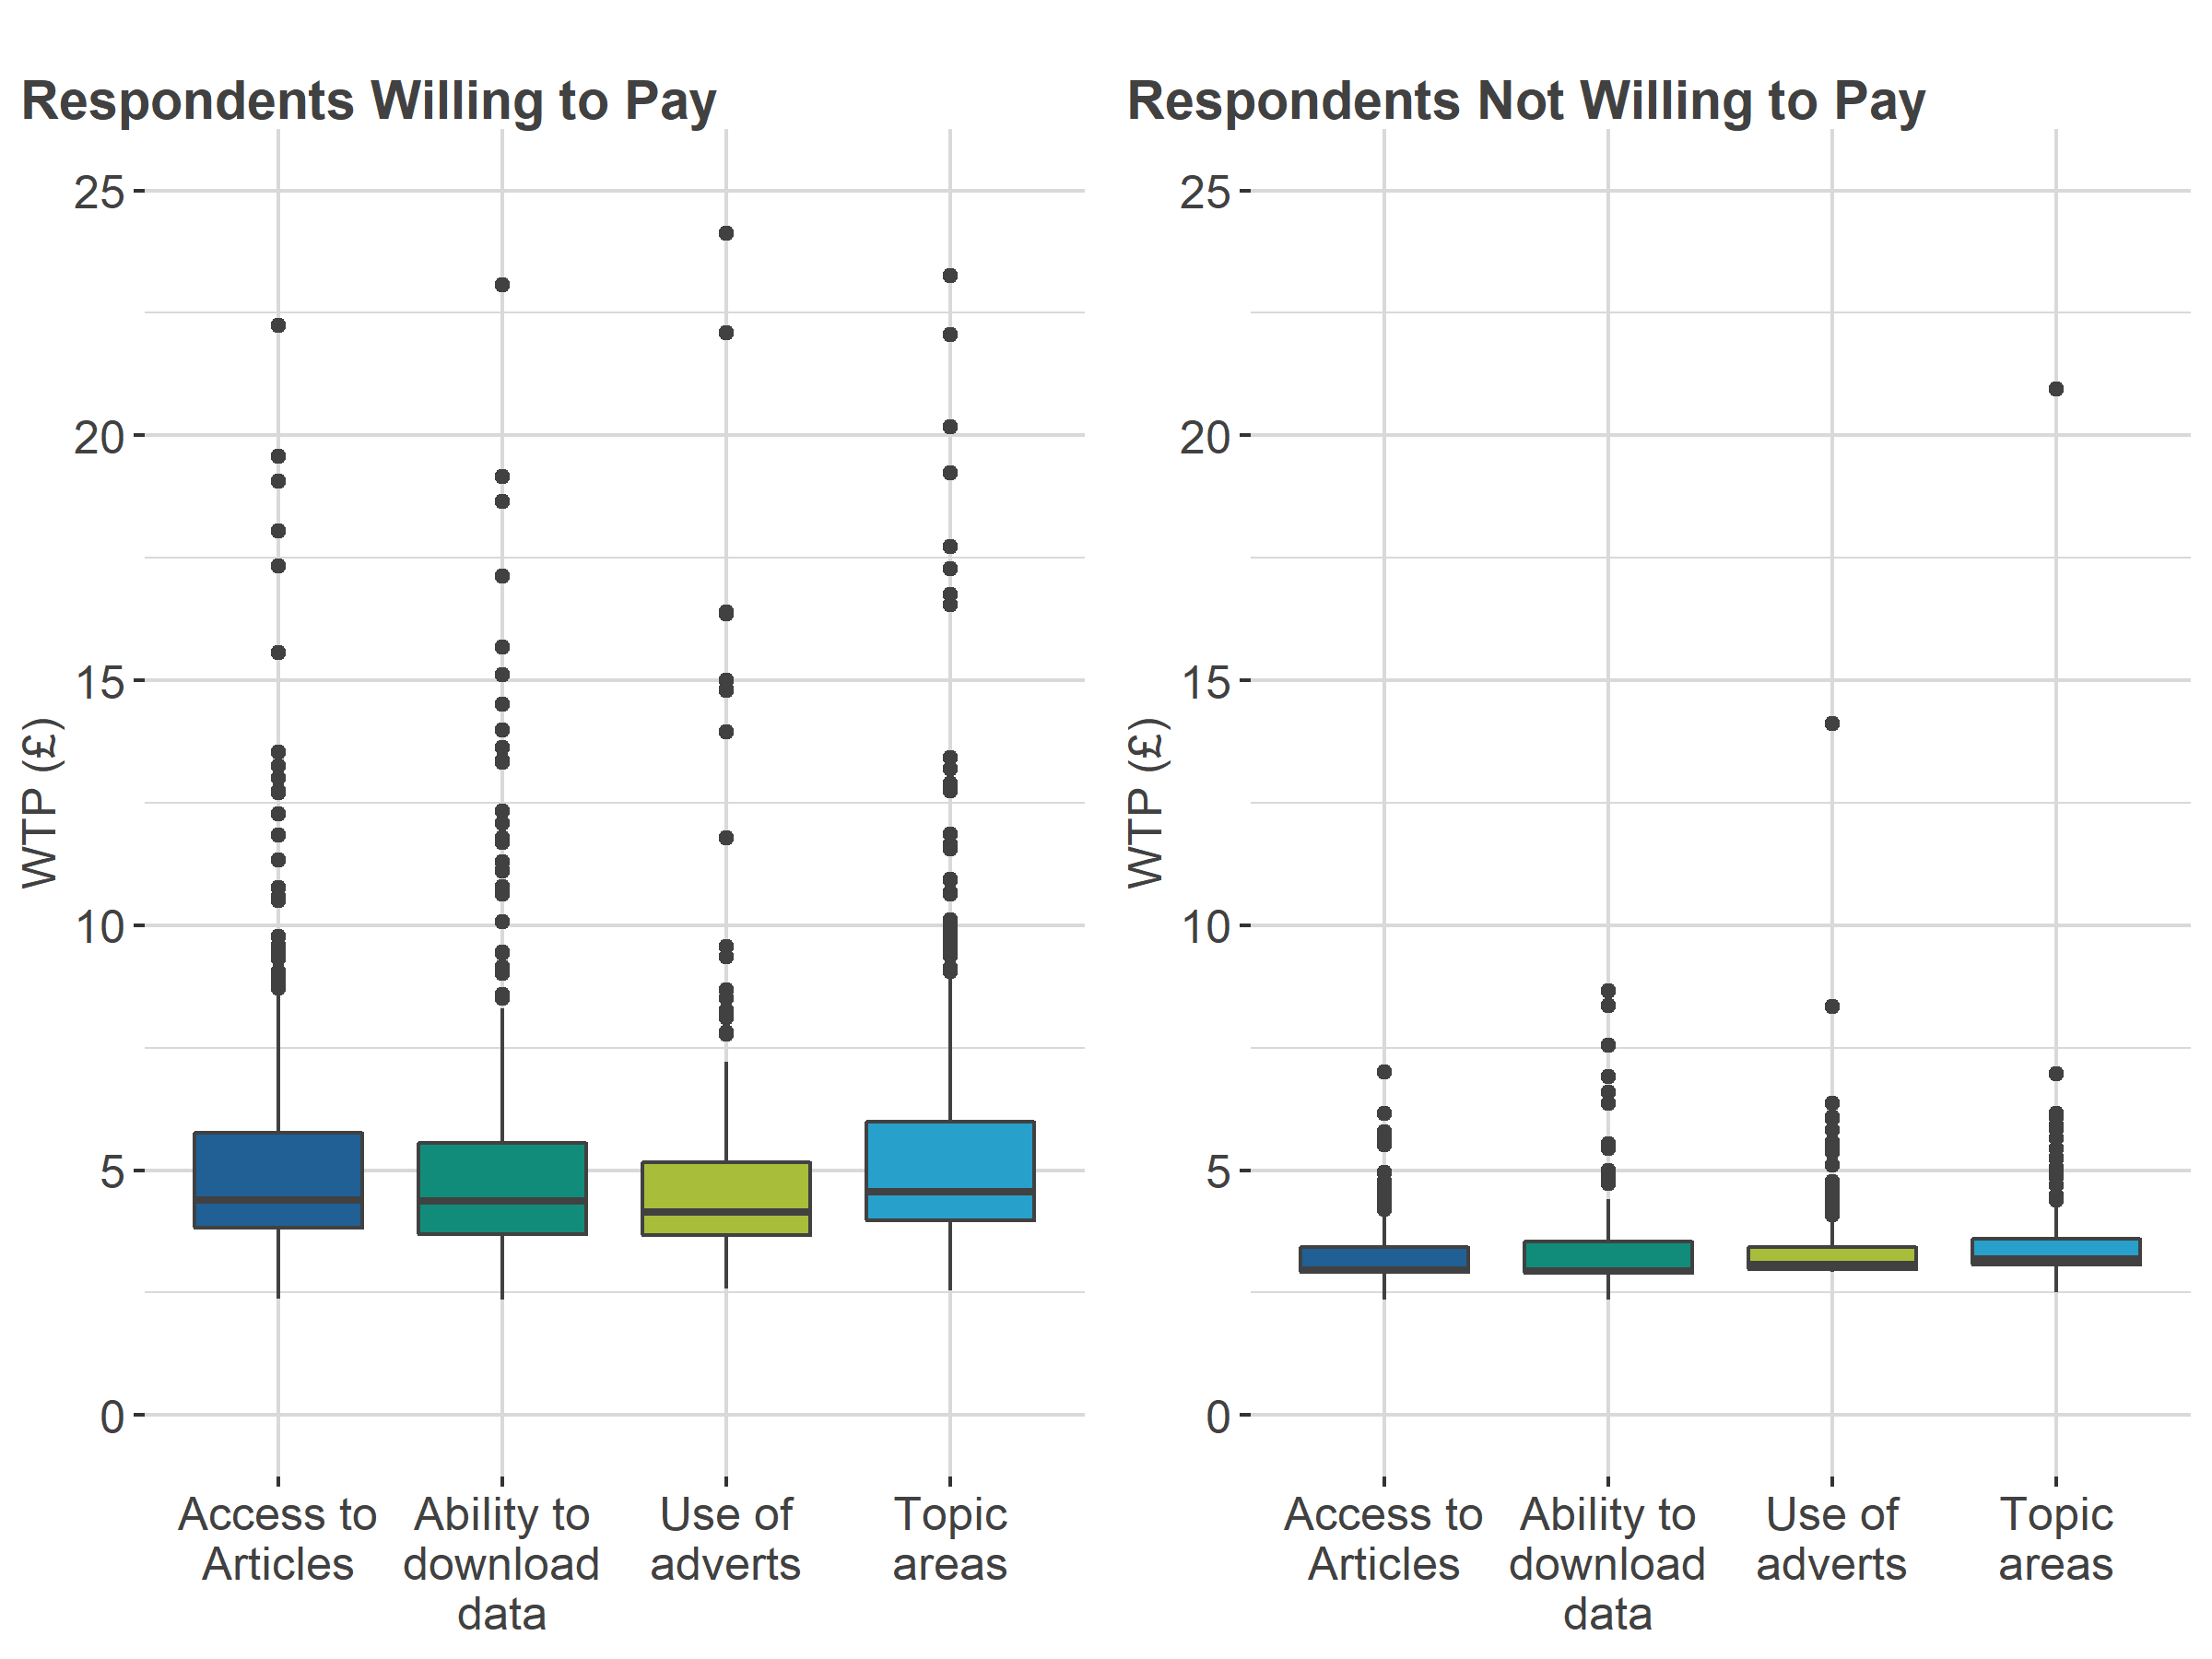
Figure 9: Distribution of willingness to pay in Conjoint B
Office for National Statistics and Ipsos UK conjoint study, March 2022
Source: Office for National Statistics and Ipsos – Conjoint study
Download this image Figure 9: Distribution of willingness to pay in Conjoint B
.png (52.2 kB) .xlsx (71.3 kB)
| All Respondents | Willing to pay | Not willing to pay | |
|---|---|---|---|
| WTP Access to articles | 3.60 | 4.44 | 2.97 |
| WTP Ability to download | 3.61 | 4.38 | 2.95 |
| WTP no adverts | 3.56 | 4.16 | 3.07 |
| WTP All topic areas | 3.82 | 4.56 | 3.18 |
Download this table Table 4: Median willingness to pay in pounds for Conjoint B
.xls .csvTo show this further, median WTP values for each conjoint and group are highlighted in Figure 10 and Figure 11. This highlights clearly that WTP medians are always higher in Conjoint B, the conjoint study with the wider price range.
Figure 10: Median WTP values by group for respondents willing to pay
Office for National Statistics and Ipsos UK conjoint study, March 2022
Source: Office for National Statistics and Ipsos – Conjoint study
Download this chart Figure 10: Median WTP values by group for respondents willing to pay
Image .csv .xls
Figure 11: Median WTP values by group for respondents unwilling to pay
Office for National Statistics and Ipsos UK conjoint study, March 2022
Source: Office for National Statistics and Ipsos – Conjoint study
Download this chart Figure 11: Median WTP values by group for respondents unwilling to pay
Image .csv .xlsThe WTP analysis in Figure 10 and Figure 11 used all four price utility levels in each conjoint study to generate price utility curves for respondents. The WTP analysis was repeated using just the price utilities that the conjoint studies had in common: FREE, £3 and £5. The results from that analysis were similar to the analysis using all four levels, however the range of WTP in Conjoint B became much larger (reaching a WTP of £300 in some cases).
Statistical tests
This analysis used two non-parametric statistical tests to see if the distributions of WTP derived from each conjoint study were the same. The two tests used were the Kolmogorov-Smirnov (KS) test, and the Mann-Whitney U test.
If differences in WTP distributions are not significant between Conjoint A and Conjoint B, then this would give support to using the conjoint approach for valuing the ONS website.
Kolmogorov-Smirnov 2-sample test
The Kolmogorov-Smirnov two-sample test (KS 2-sample test) compares two sample distributions and produces a probability that they are both from the same underlying (but unknown) probability distribution. The test requires the sample distributions to be continuous and independent of each other. To achieve sufficient statistical power in this test, the two sample distributions need large sample sizes so that natural variability does not distort results.
This study has been designed to produce two representative large samples (861 respondents in each) that differ only in the conjoint study they were asked to respond to. Analysis on the composition of respondents in Conjoint A and Conjoint B has shown that their composition is similar.
The WTP values calculated for each respondent and all non-price attribute levels provide continuous distributions that can be compared with the KS test between Conjoint A and Conjoint B.
As each non-price attribute has only two levels the WTP is simply the WTP for one of these levels over the other. For example, the WTP for access to articles is the WTP for access compared with not having access. Mathematically, the WTP for access (compared with no access) is the negative of the WTP for not having access (compared with a product that has access). This means the KS test need only be performed on one of the levels for each non-price attribute, as performing it on both levels would give the same result. Our analysis chose the second level of each attribute, which are positive for all respondents (as found in the initial validity checks on utilities). The WTP for the total product also produced a distribution that was tested.
The KS 2-sample tests for all comparisons of WTP distributions between Conjoint A and Conjoint B indicated that the probability they were drawn from the same underlying distribution was close to zero. The WTP distributions were trimmed to remove 5.0% outliers (2.5% of the highest WTP values and 2.5% of the lowest WTP values) but the KS tests still produced near zero probabilities that the WTP distributions from Conjoint A and Conjoint B were from the same underlying distribution.
The KS tests were also tested on the WTP distributions derived from using only the three price levels that each conjoint had in common (namely FREE, £3 and £5). The KS test again produced near zero probability that these alternate WTP distributions were from the same distribution.
Mann-Whitney U test
As an alternative, the Mann-Whitney U test is another non-parametric test to assess if two independent samples have the same underlying distribution. Continuous distributions are again required and the WTP distributions were run through these tests as for the KS 2-sample test. The same results were produced: near zero probability that the WTP distributions from Conjoint A and Conjoint B were from the same underlying distribution.
All statistical comparisons between WTP distributions suggested that WTP distributions were significantly different between Conjoint A and Conjoint B. This can also be seen in all the distribution charts generated through the WTP analysis. The ranges of WTP values were trimmed to remove outliers but this had no effect on the significance.
Analysis of users
Expert and general data users were defined according to respondent response to the question: "Which of the following best describes your use of statistical data?"
Expert users responded in the following three ways:
I am an expert statistical user and create my own analysis from data
I am a technical user and create my own datasets
I work as an analyst and use data for my job
General users responded:
I want unbiased facts about topical issues
I want local data to help me make practical decisions for my job or life
other
Figure 5 and Figure 6 already indicate that expert data users are more likely to be willing to pay for access to the ONS website. An additional investigation was conducted to see if these expert users might have similar WTP distributions between Conjoint A and Conjoint B.
Care is needed in this comparison as there are only 95 expert data users in Conjoint A and 118 in Conjoint B.
It can be seen in Figure 12 and Figure 13 that the data experts have consistently higher WTP medians than all respondents in Conjoint A and Conjoint B, respectively. However, overall, the same pattern is observed between the two conjoint studies, with respondents in Conjoint B having higher median WTP values than respondents in Conjoint A (Figure 14).
Figure 12: Expert data users’ willingness to pay in Conjoint A
Office for National Statistics and Ipsos UK conjoint study, March 2022

Source: Office for National Statistics and Ipsos – Conjoint study
Download this image Figure 12: Expert data users’ willingness to pay in Conjoint A
.png (49.2 kB) .xlsx (24.0 kB)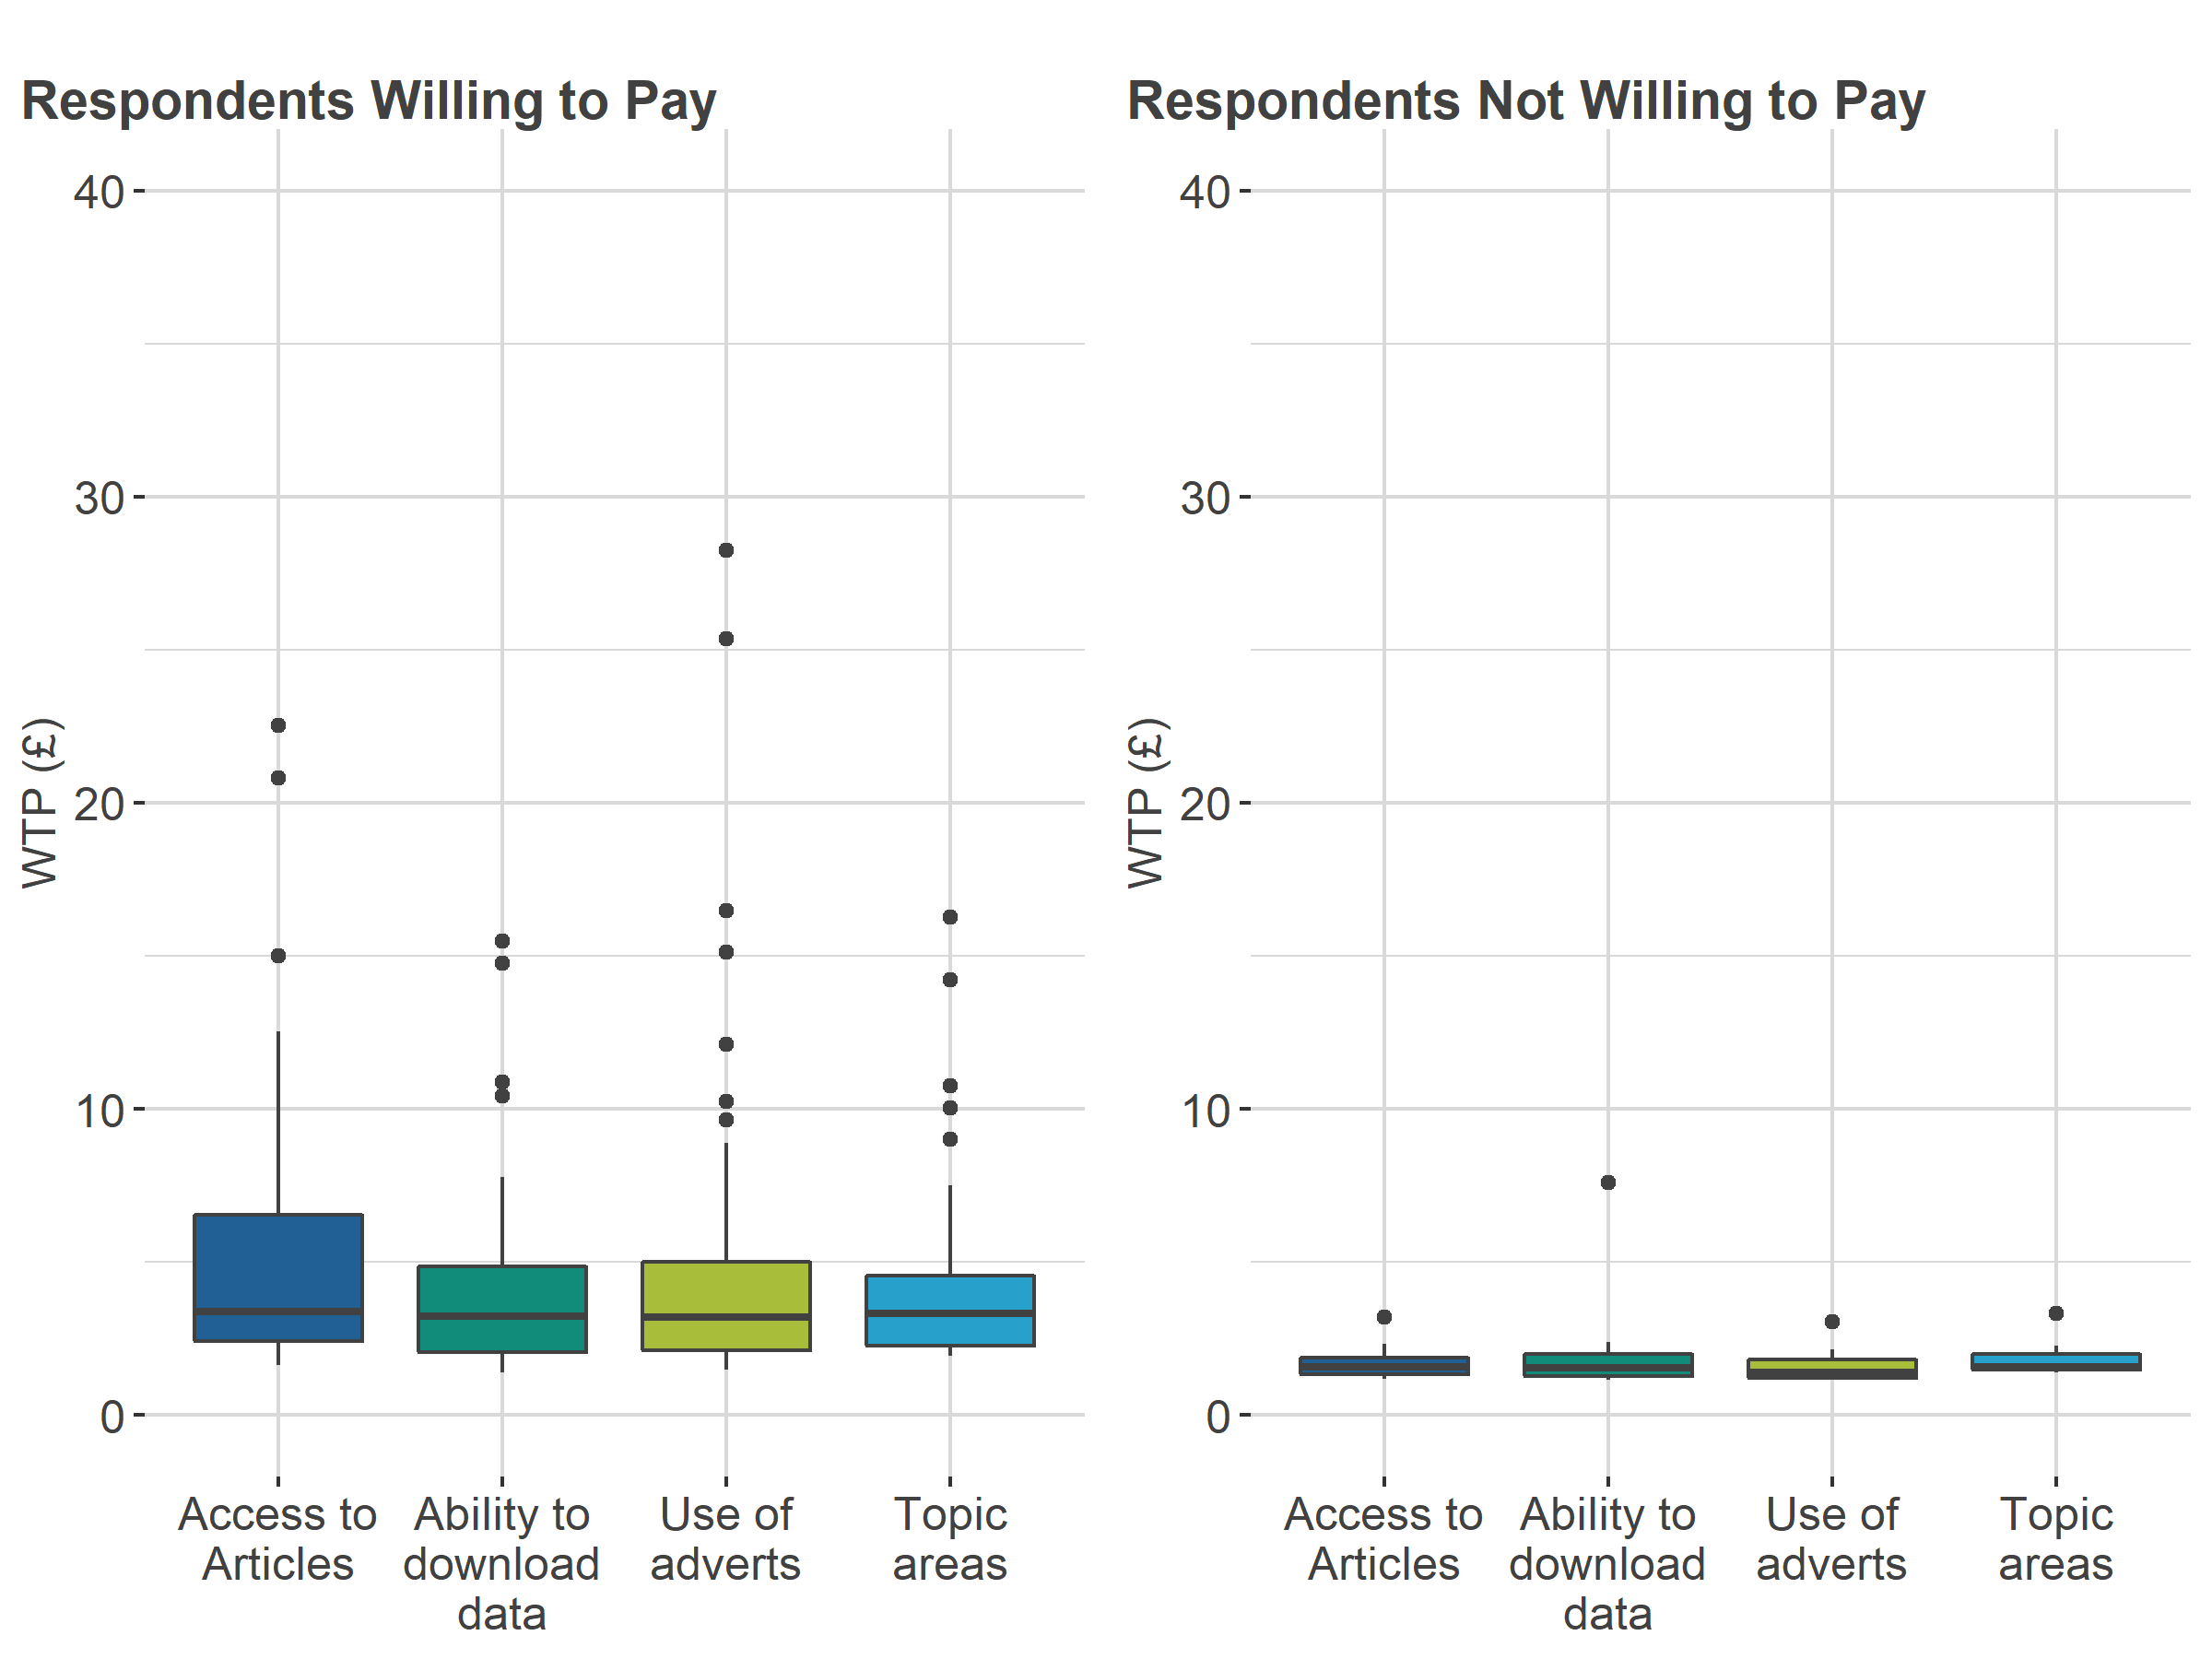
| All Respondents (N = 95) | Willing to pay (N = 66) | Not willing to pay (N = 29) | |
|---|---|---|---|
| WTP Access to articles | 2.52 | 3.39 | 1.57 |
| WTP Ability to download | 2.32 | 3.24 | 1.55 |
| WTP no adverts | 2.22 | 3.19 | 1.40 |
| WTP All topic areas | 2.42 | 3.33 | 1.57 |
Download this table Table 5: Expert data users’ median willingness to pay in pounds in Conjoint A
.xls .csv
Figure 13: Expert data users’ willingness to pay in pounds in Conjoint B
Office for National Statistics and Ipsos UK conjoint study, March 2022

Source: Office for National Statistics and Ipsos – Conjoint study
Download this image Figure 13: Expert data users’ willingness to pay in pounds in Conjoint B
.png (50.0 kB) .xlsx (25.7 kB)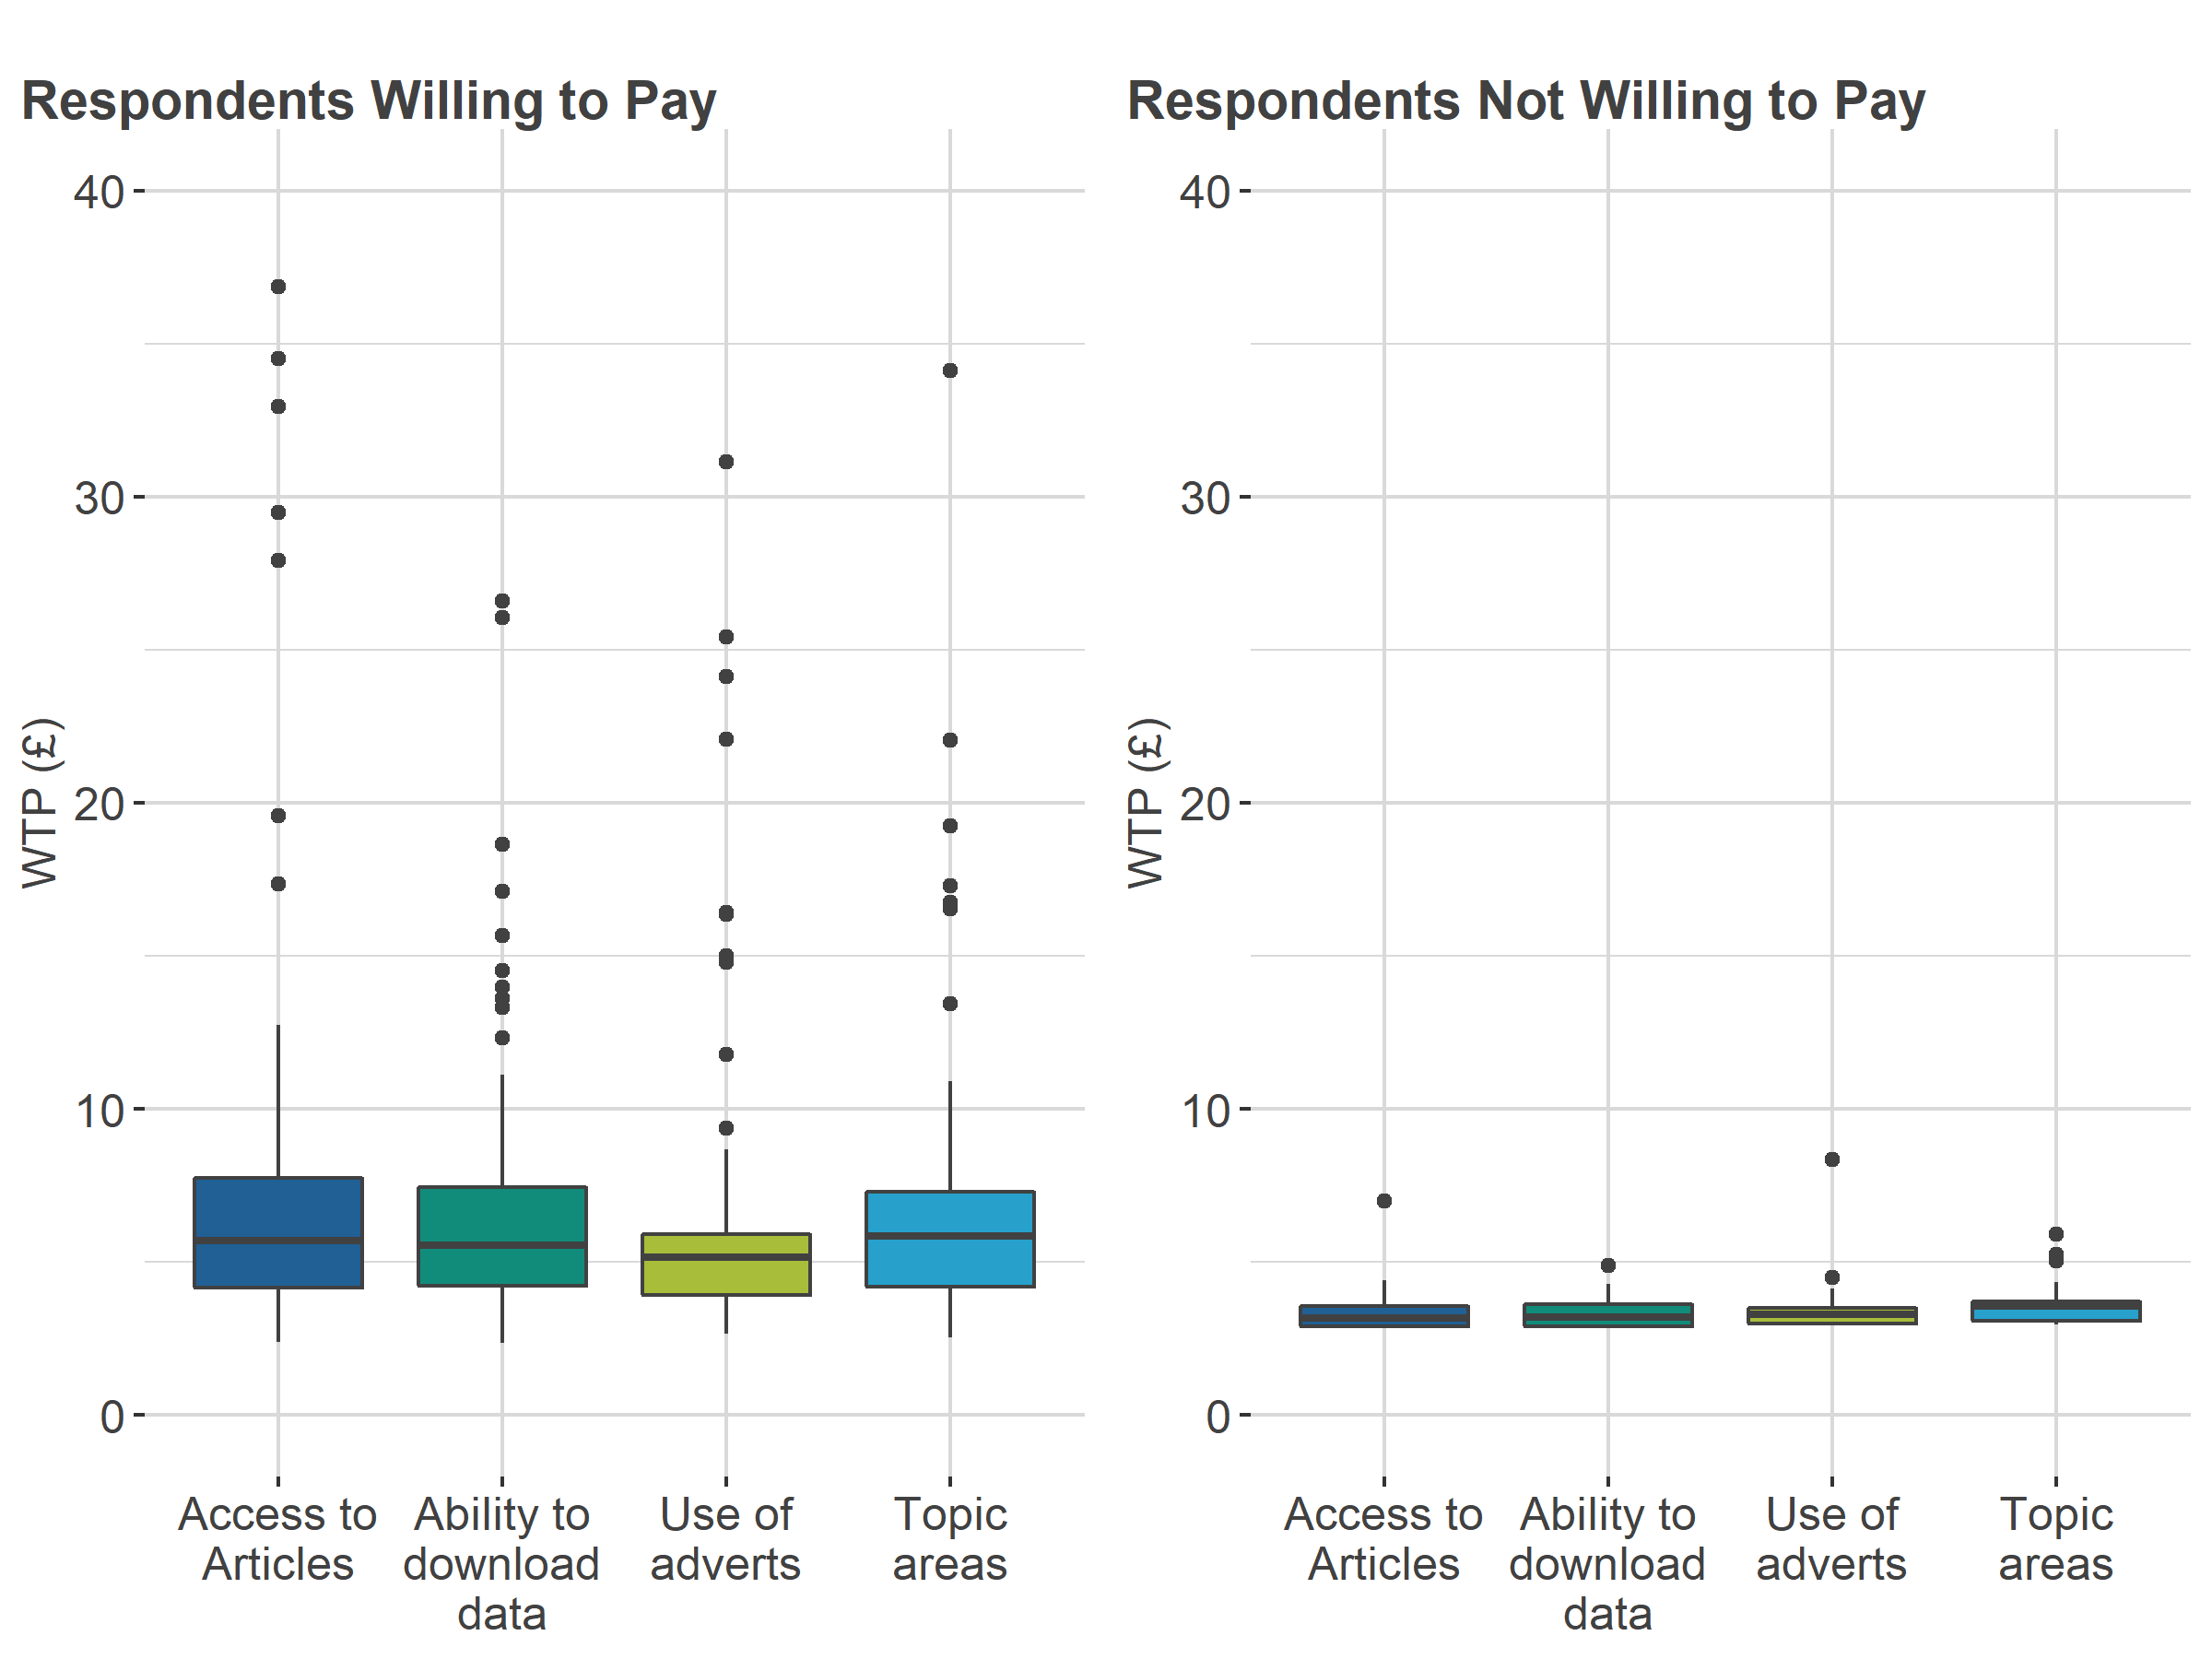
| All Respondents (N = 118) | Willing to pay (N = 99) | Not willing to pay (N = 19) | |
|---|---|---|---|
| WTP Access to articles | 5.28 | 5.69 | 3.17 |
| WTP Ability to download | 4.95 | 5.55 | 3.19 |
| WTP no adverts | 4.60 | 5.17 | 3.30 |
| WTP All topic areas | 5.40 | 5.86 | 3.56 |
Download this table Table 6: Expert data users’ median willingness to pay in pounds in Conjoint B
.xls .csv
Figure 14: Expert data users’ median willingness to pay in pounds for respondents willing to pay
Office for National Statistics and Ipsos UK conjoint study, March 2022
Source: Office for National Statistics and Ipsos – Conjoint study
Download this chart Figure 14: Expert data users’ median willingness to pay in pounds for respondents willing to pay
Image .csv .xls
Figure 15: Expert data users’ median willingness to pay in pounds for respondents unwilling to pay
Office for National Statistics and Ipsos UK conjoint study, March 2022
Source: Office for National Statistics and Ipsos – Conjoint study
Download this chart Figure 15: Expert data users’ median willingness to pay in pounds for respondents unwilling to pay
Image .csv .xlsThe WTP distributions were run through the KS 2-sample test and the Mann-Whitney test in a similar way for all respondents. Again the probabilities that WTP distributions for expert data users are from the same distribution were close to zero, indicating that they are statistically significantly different.
Back to table of contents9. Conclusion to study
A conjoint study (a stated preference approach) was developed between the Office for National Statistics (ONS) and Ipsos UK with the overall aim to test to see if the method could be used to obtain a monetary value on the official statistics by eliciting willingness to pay (WTP) estimates. This method is generally used where customers have awareness of products and prices in a real market, however, official statistics are a non-market good making it more challenging to obtain customer preferences with WTP.
Ipsos UK used their Interactive Panel Survey (UK residents aged 16 years and over) which was split into two groups (Conjoint A and Conjoint B with similar compositions). Each group received a "hypothetical" scenario offering different price ranges of monthly subscriptions to access products on the ONS website.
It was thought that if the WTP distribution was similar between the groups regardless of the price range offered, the method could help offer a way to put a monetary value on official statistics. However, the WTP distribution varied between the two groups. Analysis of WTP values shows that Conjoint B (the conjoint study with the higher price range), consistently produced distributions with higher WTP medians. Concluding that use of the conjoint method is somewhat inconclusive and further work needs to be explored.
There were some plausible results found with this study, which were that:
people would rather have access to the ONS website than not, and they showed more WTP for access to articles for all topic areas and for downloads without any advertising
expert data users and those already familiar with the ONS website were more willing to pay for access and products on the ONS website
people who were willing to pay something for access to the ONS website tend to be younger, are current users, have a greater familiarity with the website and its data, use data in their jobs, see themselves as either data experts, technical users or analysts and more likely to make more use of data
respondents who see themselves as data experts, technical users or analysts using data in their jobs had higher median level of WTP than more general data users
10. Further work
The calculation of each respondent's willingness to pay (WTP) is derived using the utilities for each price level. These price utilities are used to approximate the respondent's price utility curve as in Figure 7. This approximation, using linear interpolation between price levels might be investigated further to understand if the approximation might be driving the higher WTP in Conjoint B. Sawtooth software has an alternative method for calculating WTP and this might also be considered.
Using respondent responses to this survey, alternative modelling can be done to produce the respondent utilities. These results can then be compared with those produced through the inbuilt Sawtooth functionality. Modelling the utilities as one group, instead of including a co-variate for the intent of the respondent to pay for the website, could assess the impact this has on the WTP distributions.
Large sample sizes were required to perform the statistical tests comparing distributions, and this necessitated using the general population panels set up by various market research organisations. The results indicated that expert data users have a higher median WTP on average and ideally, a comparison of larger samples of expert data users might provide more reliable WTP in this type of analysis. Respondents who currently pay for data would also be desirable in any sample.
Another avenue to research could be to derive preference shares for each respondent in various market settings. Comparing the preference share distributions for the current Office for National Statistics (ONS) website with the "none" option might produce more equivalent distributions.
Back to table of contents11. Annex: Descriptive statistics
Figure 16: Descriptive statistics – number of visits to ONS website for respondents willing to pay
Office for National Statistics and Ipsos UK conjoint study, March 2022
Source: Office for National Statistics and Ipsos – Conjoint study
Download this chart Figure 16: Descriptive statistics – number of visits to ONS website for respondents willing to pay
Image .csv .xls
Figure 17: Descriptive statistics – number of visits to ONS website for respondents unwilling to pay
Office for National Statistics and Ipsos UK conjoint study, March 2022
Source: Office for National Statistics and Ipsos – Conjoint study
Download this chart Figure 17: Descriptive statistics – number of visits to ONS website for respondents unwilling to pay
Image .csv .xls12. Cite this methodology
Office for National Statistics (ONS), released 7 September 2022, ONS website, methodology, Conjoint analysis for valuing official statistics, UK: 2022