Table of contents
- Main points
- Things you need to know about this release
- Public sector employment rises on the quarter
- Central government employment rises whilst local government employment falls
- Employment in public administration and the National Health Service rises
- Private sector employment continues to rise
- Civil Service employment rises
- Links to related statistics
- Quality and methodology
1. Main points
There were 5.36 million people employed in the public sector for March 2018, that is, 10,000 more than for December 2017.
There were 27.04 million people employed in the private sector for March 2018, that is, 136,000 more than for December 2017.
Between March 2017 and March 2018, employment in the public sector fell by 102,000 due to the reclassification of English housing associations; excluding the effects of this reclassification, public sector employment increased by 42,000.
Between March 2017 and March 2018, employment in the private sector increased by 542,000, due partly to the reclassification of English housing associations; excluding the effects of this reclassification, private sector employment increased by 398,000.
For March 2018, of all people in paid work, 16.5% were employed in the public sector (the lowest proportion since comparable records began in 1999) and the remaining 83.5% were employed in the private sector.
2. Things you need to know about this release
This bulletin presents the latest quarterly estimates of UK public sector employment (PSE). The public sector comprises central government, local government and public corporations as defined for the UK National Accounts.
These statistics are used mainly to monitor changes in the number of people employed in the UK public and private sectors and to inform policy-making across government.
Estimates of PSE are presented by sector classification, industry and region. Civil Service employment is shown by government department and agency. Employment in executive non-departmental public bodies (NDPBs) is aggregated by sponsoring department.
While this bulletin focuses on headcount estimates of PSE, full-time equivalent estimates (based on the number of hours worked divided by the standard full-time hours) are available in the accompanying PSE datasets.
The PSE estimates are point-in-time employment estimates and relate to a specific day in the published month.
The main source of PSE is the Quarterly Public Sector Employment Survey, which aims to obtain complete coverage of local authorities and the Civil Service, and coverage of all public bodies with 20 or more employees. It is difficult to achieve complete coverage for local and central government, for example, in the education sector. Further information can be found in the Quality and Methodology Information report.
All time series in this release, except for the regional series, are seasonally adjusted to aid interpretation. Relationships that hold in the unadjusted series do not necessarily hold for the seasonally adjusted series. For example, total PSE equals the total of all public sector industry estimates before seasonal adjustment, but this is not necessarily true after seasonal adjustment.
Comparisons of public and private sector employment over time are complicated by a number of major reclassifications, where bodies employing large numbers of people have moved between the public and private sectors. We produce estimates of public and private sector employment excluding the effects of major reclassifications to help you understand underlying trends in employment. We publish these alongside estimates of total public and private sector employment in Tables 5, 6a and 7a of the PSE datasets.
Consistent with the revisions policy for public sector employment statistics, the statistics are subject to revisions. Revisions can be made for a variety of reasons, the most common include:
to account for late information from respondents
to account for recent classifications to the public sector
to update seasonal factors (updated quarterly and reviewed annually)
3. Public sector employment rises on the quarter
There were 5.36 million employees in the public sector for March 2018, up 10,000 (0.2%) compared with December 2017 but down 102,000 (1.9%) compared with March 2017. The annual fall of 102,000 was entirely due to the reclassification of English housing associations, which are included in the private sector from December 2017 but are included in the public sector between September 2008 and September 2017. Excluding the effects of this reclassification, public sector employment increased by 42,000 between March 2017 and March 2018.
Of all people in paid work, 16.5% were employed in the public sector for March 2018, the lowest proportion since comparable records began in 1999.
Figure 1 shows trends in total public sector employment and public sector employment excluding major reclassifications since comparable records began in 1999.
Figure 1: Total UK public sector employment, seasonally adjusted
March 1999 to March 2018
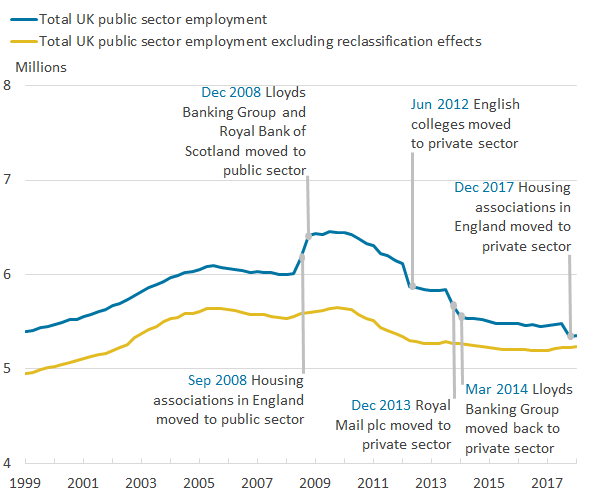
Source: Office for National Statistics
Download this image Figure 1: Total UK public sector employment, seasonally adjusted
.png (23.8 kB) .xlsx (21.1 kB)
4. Central government employment rises whilst local government employment falls
The number of people employed in central government continued to rise in March 2018, as shown in Figure 2. At 3.10 million, it was up 25,000 (0.8%) compared with December 2017 and up 104,000 (3.5%) compared with March 2017.
The increase of 25,000 in central government employment between December 2017 and March 2018 was mainly due to:
- local authority schools converting to academy status
- a small increase in employment in the National Health Service
- a small increase in employment in the Civil Service
The number of people employed in central government has risen steadily for over five years and the latest figure for March 2018 (3.10 million) is the highest figure since comparable records began in 1999.
Local government employment fell by 15,000 (0.7%) between December 2017 and March 2018, and fell by 65,000 (3.1%) between March 2017 and March 2018, to reach 2.06 million, the lowest figure since comparable records began in 1999. Local authority schools converting to academies (which are classified to central government) accounted for most of these decreases.
The number of people employed in public corporations was unchanged between December 2017 and March 2018 at 199,000. Between March 2017 and March 2018, employment in public corporations fell by 141,000 (41.5%), due mainly to the reclassification of English housing associations to the private sector. Employment in public corporations has steadily fallen for over five years.
Figure 2: UK public sector employment in local and central government, seasonally adjusted
March 1999 to March 2018
Source: Office for National Statistics
Notes:
- July 2010: Academies Act 2010 passed.
- June 2012: English colleges moved to the private sector.
Download this chart Figure 2: UK public sector employment in local and central government, seasonally adjusted
Image .csv .xlsThe academies impact
The composition of the public sector is changing due to academy conversions in England. Employees move from local government to central government when local authority schools become academies. In March 2018, academy conversions accounted for around 14,000 employees over the quarter and 64,000 over the year, as shown in Table 1. A full time series of employment in academies is available in Table 11 of the public sector employment dataset.
Table 1: Employment in academies, June 2015 to March 2018, England
| Thousands, not seasonally adjusted | |||
| Headcount | Full-time equivalent | ||
|---|---|---|---|
| 2015 | June | 414 | 324 |
| September | 431 | 333 | |
| December | 437 | 337 | |
| 2016 | March | 442 | 341 |
| June | 450 | 345 | |
| September | 468 | 360 | |
| December | 478 | 367 | |
| 2017 | March | 487 | 373 |
| June | 513 | 392 | |
| September | 526 | 401 | |
| December | 537 | 408 | |
| 2018 | March | 551 | 418 |
| Change on quarter | 14 | 10 | |
| Change on year | 64 | 45 | |
| Source: Office for National Statistics | |||
Download this table Table 1: Employment in academies, June 2015 to March 2018, England
.xls (37.4 kB)5. Employment in public administration and the National Health Service rises
Looking at public sector employment by industry, public administration and the National Health Service show increases.
Employment in public administration increased by 8,000 (0.8%) between December 2017 and March 2018 and by 21,000 (2.1%) between March 2017 and March 2018 to reach 1.03 million. Within public administration, Civil Service employment increased by 3,000 (0.7%) between December 2017 and March 2018 and by 11,000 (2.6%) on the year to reach 430,000.
For March 2018, there were 1.64 million people employed in the National Health Service (NHS), accounting for 30.6% of all people employed in the public sector. There were 1.51 million people employed in public sector education, accounting for 28.2% of all people employed in the public sector. The NHS has seen a consistent long-term increase in employment and is now at 1.64 million compared with 1.17 million when the series began in March 1999.
For March 2018, there were 225,000 employed in other health and social work (4.2% of people employed in the public sector). While this is unchanged compared with December 2017, looking longer-term the series has shown a strong decrease in employment. Between March 2017 and March 2018, employment in other health and social work fell by 48,000, due mainly to the reclassification of English housing associations to the private sector.
Figure 3 shows public sector employment by selected industries since the series began in 1999.
Figure 3: UK public sector employment, by selected industries, seasonally adjusted
March 1999 to March 2018
Source: Office for National Statistics
Notes:
- Sep 2008: Housing associations in England reclassified to public sector.
- Jun 2012: English colleges moved to private sector.
- Dec 2017: Housing associations in England reclassified to private sector.
Download this chart Figure 3: UK public sector employment, by selected industries, seasonally adjusted
Image .csv .xls6. Private sector employment continues to rise
Private sector employment estimates are derived as the difference between total employment estimates, sourced from the Labour Force Survey, and public sector employment estimates collected from public sector organisations.
For March 2018, there were 27.04 million people employed in the private sector. This was:
136,000 (0.5%) more than for December 2017
542,000 (2.0%) more than for March 2017
the highest since comparable records began, as shown in Figure 4
The reclassification of English housing associations to the private sector has contributed to the annual increase of 542,000 in private sector employment. Excluding the effect of this reclassification, private sector employment increased by 398,000 (1.5%) between March 2017 and March 2018.
Figure 4: UK private sector employment, seasonally adjusted
March 1999 to March 2018
Source: Office for National Statistics
Download this chart Figure 4: UK private sector employment, seasonally adjusted
Image .csv .xls7. Civil Service employment rises
For March 2018, there were 430,000 people employed in the Home Civil Service (8.0% of total public sector employment). This was:
3,000 (0.7%) more than for December 2017
11,000 (2.6%) more than for March 2017
Civil Service employment last peaked in June 2005 at 566,000. Figure 5 shows employment in the Home Civil Service gradually rising in more recent periods following a longer-term decline since 2005.
Figure 5: Employment in the Home Civil Service, UK
March 1999 to March 2018
Source: Office for National Statistics
Download this chart Figure 5: Employment in the Home Civil Service, UK
Image .csv .xlsMachinery of government changes in the period since 1 April 2017 are listed in Table 2.
Table 2: Machinery of government changes, 1 April 2017 to 31 March 2018, UK
| Organisation name | Details | |
|---|---|---|
| National Infrastructure Commission | The National Infrastructure Commission, an executive agency of HM Treasury, is reported for the first time in the March 2018 release. | |
| Defence Equipment and Support | Around 1,250 staff moved from Defence Equipment and Support to the Ministry of Defence (excluding trading funds) between December 2017 and March 2018. | |
| HM Revenue and Customs | Around 120 staff transferred from HM Revenue and Customs to the Department for Work and Pensions between December 2017 and March 2018. | |
| Ministry of Housing, Communities and Local Government | The Department for Communities and Local Government became the Ministry of Housing, Communities and Local Government on 8 January 2018. | |
| Department of Health and Social Care | The Department of Health became the Department of Health and Social Care on 8 January 2018. | |
| HM Revenue and Customs | Around 600 employees transferred from HM Revenue and Customs to the Cabinet Office between September and December 2017. | |
| Rural Payments Agency | Around 60 employees transferred from the Rural Payments Agency to the Department for Environment, Food and Rural Affairs between June and September 2017. | |
| HM Revenue and Customs | Around 1,400 employees transferred from HM Revenue and Customs to the Cabinet Office between June and September 2017. | |
| Crown Commercial Service | Around 20 employees transferred from Crown Commercial Service to the Cabinet Office between June and September 2017. | |
| Department for Digital, Culture, Media and Sport | The Department for Culture, Media and Sport became the Department for Digital, Culture, Media and Sport on 3 July 2017. | |
| Scottish Fiscal Commission | The Scottish Fiscal Commission was established as a non-ministerial department on 1 April 2017. | |
| HM Prison and Probation Service | The National Offender Management Service became Her Majesty’s Prison and Probation Service on 3 April 2017. Around 600 employees transferred from HM Prison and Probation Service to the Ministry of Justice. | |
| Education and Skills Funding Agency | On 1 April 2017, the Education Funding Agency and the Skills Funding Agency merged to form the Education and Skills Funding Agency. | |
| HM Revenue and Customs | Around 60 employees transferred from HM Revenue and Customs to the Cabinet Office between April and June 2017. | |
| Rural Payments Agency | Around 200 employees transferred from the Rural Payments Agency to the Department for Environment, Food and Rural Affairs on 1 April 2017. | |
| Foreign and Commonwealth Office | Around 40 employees transferred from the Foreign and Commonwealth Office to FCO Services on 1 April 2017. | |
| Department for Business, Energy and Industrial Strategy | Around 150 employees transferred from the Department for Business, Energy and Industrial Strategy to the Government Legal Department as of 1 April 2017. Around 80 employees transferred from the Department for Business, Energy and Industrial Strategy to the Insolvency Service between April and June 2017. | |
| Legal Aid Agency | Around 100 employees transferred from the Legal Aid Agency to the Ministry of Justice between April and June 2017. | |
| Source: Office for National Statistics | ||
Download this table Table 2: Machinery of government changes, 1 April 2017 to 31 March 2018, UK
.xls (44.5 kB)9. Quality and methodology
The Public sector employment (PSE) Quality and Methodology Information report contains important information on:
- the strengths and limitations of the data and how it compares with related data
- uses and users of the data
- how the output was created
- the quality of the output including the accuracy of the data
Response rates
The primary source of the PSE statistics is the Quarterly Public Sector Employment Survey (QPSES), which comprises three separate data collections: local authorities in England and Wales, public corporations and non- departmental public bodies (NDPBs) in Great Britain and the Home Civil Service. Our targets for response before the results are compiled are 90% for Local Authorities and Public Bodies QPSES and 100% for Civil Service QPSES. Response rates for the latest period are shown in Table 3.
Table 3: Response rates for sources of UK public sector employment, March 2018
| Response (% of questionnaires returned) | Response (% of employment returned) | |
|---|---|---|
| Local authorities survey | 93 | 95 |
| Public bodies survey | 95 | 97 |
| Civil service survey | 100 | 100 |
| Other sources (see Table 4) | 100 | 100 |
| Source: Office for National Statistics | ||
Download this table Table 3: Response rates for sources of UK public sector employment, March 2018
.xls (41.0 kB)So that estimates of total public sector employment can be made, it is necessary for further information to be gathered from external sources, listed in Table 4.
Table 4: External sources of data for UK public sector employment statistics, March 2018
| Central government | ||||
|---|---|---|---|---|
| HM Forces | UK | Ministry of Defence: Defence Statistics | ||
| National Health Service | England | NHS Digital | ||
| Wales | NHS Wales Informatics Service | |||
| Scotland | Scottish Government | |||
| Northern Ireland | Department of Finance and Personnel | |||
| Academies | England | School Workforce Census and list of all open academies (Department for Education) | ||
| Police (including civilians) | Scotland | Scottish Government | ||
| Police (British Transport Police) | England and Wales | Home Office | ||
| Other central government | Great Britain | Quarterly Public Sector Employment Survey (ONS) | ||
| Northern Ireland | Department of Finance and Personnel | |||
| Local government | ||||
| Local authorities | England and Wales | Quarterly Public Sector Employment Survey (ONS) | ||
| Scotland | Joint Staffing Watch (Scottish Government) | |||
| Northern Ireland | Department of Finance and Personnel | |||
| Police (including civilians) | England and Wales | Home Office | ||
| Northern Ireland | Department of Finance and Personnel | |||
| Public corporations | ||||
| Great Britain | Quarterly Public Sector Employment Survey (ONS) | |||
| Northern Ireland | Department of Finance and Personnel | |||
| Housing associations | Wales | Short-Term Employment Survey (ONS) | ||
| Scotland | Scottish Housing Regulator; Scottish Government | |||
| Northern Ireland | Department of Finance and Personnel | |||
| Source: Office for National Statistics | ||||