Table of contents
- Main points
- Changes to publication schedule for economic statistics
- Introduction
- Labour productivity
- International comparisons of productivity
- Quality adjusted labour input (QALI)
- Management practices
- Measuring output in the Information Communication and Telecommunications industries
- Public service productivity
1. Main points
Estimates for the second quarter (Apr to June) 2016 suggest that productivity as measured by output per hour worked grew by 0.6% on the quarter – slightly faster than the 0.5% observed in the previous quarter.
Output per hour has now returned to its pre-downturn level and has slightly exceeded it for the first time since 2008.
Estimates of productivity which are comparable across countries suggest that the productivity gap between the UK and the Group of 7 (G7) economies as a whole was little changed in 2015. On a GDP per hour worked basis, productivity in the UK was 18 percentage points lower than the average for the rest of the G7 advanced economies in 2015.
Public services productivity is estimated to have grown by 0.2% in Q2 2016, reflecting stable output and a slight fall in the volume of inputs.
New estimates of Quality Adjusted Labour Input (QALI) suggest that the effective supply of labour grew by 1.4% in 2015 – although this was a consequence of increased hours worked and a slight fall in labour ‘quality’.
The first results of a pilot survey of management practices in the manufacturing industry point to variation in the application of structured management practices in Great Britain, with larger firms and multi-national firms recording greater use of strong management practices in 2015.
ONS has been working with the Institution of Engineering and Technology, the Office for Communications (Ofcom) and other key stakeholders to identify potential improvements to the measurement of output in the Information and Communications industries, highlighting several potential avenues for development.
Back to table of contents2. Changes to publication schedule for economic statistics
From January 2017 we are improving the way we publish economic statistics, with related data grouped together under new "theme" days. This will increase the coherence of our data releases and involve minor changes to the timing of certain publications. For more information see Changes to publication schedule for economic statistics.
Back to table of contents3. Introduction
The UK’s recent productivity performance has been marked by two “puzzles”. Firstly, output per hour growth has been unusually weak since the onset of the economic downturn. UK output per hour worked grew at an average quarterly rate of 0.5% in the decade prior to Quarter 1 (Jan to Mar) 2008, but has slowed to just 0.1% per quarter since the start of the recovery of productivity in Quarter 4 (Oct to Dec) 2008. As a consequence, productivity growth has been much weaker during this recovery than during any of the economic recoveries of the past half-century.
The second “puzzle” concerns the UK’s well-documented “productivity gap” with other economies in the Group of Seven (G7), and with Germany, France and the USA in particular. While the more recent productivity slowdown has been observed across the advanced economies, the UK’s productivity gap to some of these countries has been highly persistent and has grown in recent years. In Gross Domestic Product (GDP) per hour worked terms, UK productivity was around 27, 30 and 35 percentage points lower than in France, the USA and Germany respectively.
This edition of the Productivity Bulletin presents new information on both of these features of the UK’s recent performance. In terms of ONS’ headline measure of labour productivity (output per hour worked), the data presented here suggests that the UK recovered its pre-downturn level of productivity for the first time in Quarter 2 (Apr to June) 2016. On this measure, labour productivity grew by 0.6% between Quarter 1 2016 and Quarter 2 2016, rising 0.02% above its previous peak. This edition of the Productivity Bulletin unpacks these data and identifies the contributions of different industries to this recovery.
This edition also offers new estimates of the UK’s labour productivity performance relative to the other G7 economies in 2015, which suggest that the gap between the UK and other leading economies has changed relatively little in recent years. On these estimates, output per hour was around 18 percentage points lower in the UK in 2015 than in the rest of the G7 – unchanged on a year earlier – reflecting a slight narrowing of the productivity gap to Germany, France and Italy. This edition of the Productivity Bulletin sets out these recent estimates, as well as an analysis of the distribution of hours worked in the USA and UK.
Alongside estimates of labour productivity, this edition also examines four areas where ONS outputs are being developed in an effort to better understand the recent productivity experience of the UK:
Quality of labour indices
These data suggest that the composition of the workforce fell in quality terms in 2015 – the first such fall since 2001 – with the implication that much of the growth in labour input in the UK has been a consequence of growth in the quantity of hours worked. All else equal, slower growth of the quality of the workforce is likely to be associated with a slower pace of productivity growth.
Management practices
Following recent academic work which has suggested that variation in management practices may help to explain the broad dispersion of productivity levels between firms in the same industry, ONS have conducted a pilot survey of management practices in the manufacturing industry. This edition of the Productivity Bulletin sets out the first findings of this work, which highlights the potential of this area for future study.
Measurement of services output
This edition also sets out the discussions that ONS have held with the Institution of Engineering and Technology, the Office for Communications (Ofcom) and members of the academic community on the measurement of output in the Information and Communications industry in particular. This work responds to some of the central challenges of the Bean Review as set out in the Economic Statistics and Analysis Strategy.
Measurement of public service productivity
Following the publication of the first quarterly estimates of public service productivity in Quarter 1 2016, this edition sets out estimates of output, input and productivity growth for these activities for the most recent quarter. Public service productivity is now at a comparable level to that achieved in 1998, at its previous peak.
Back to table of contents4. Labour productivity
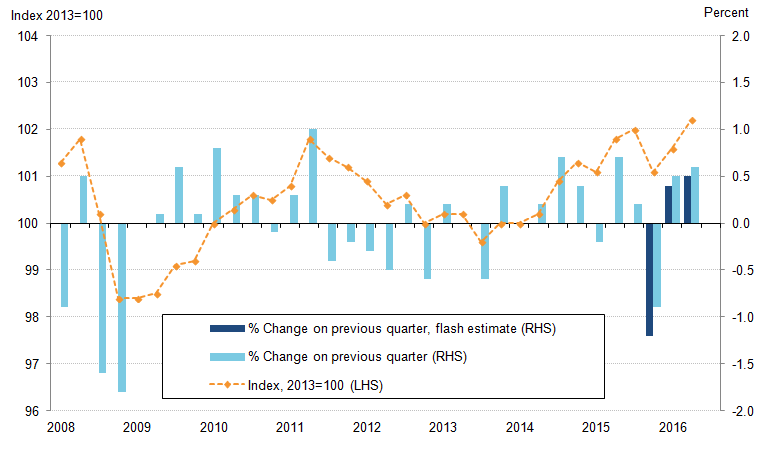
Output per hour – ONS’s main measure of labour productivity – grew by 0.6% in Quarter 2 (Apr to June) 2016 (Figure 1), 0.1 percentage points higher than the flash estimate reported in August, and higher than the 0.5% growth rate experienced in Quarter 1 (Jan to Mar) 2016. This growth was largely a result of higher output – which grew by 0.7% on the quarter – which was slightly offset by growth in hours worked, which grew by 0.1% over the same period. This strengthening of productivity growth reflects growth in both the services (0.6% on the quarter) and manufacturing industries (2.2%), with strong growth in the latter industry driven by high output growth and a fall in hours worked.
Figure 1: Output per hour
Seasonally adjusted, quarter 1 (Jan to Mar) 2008 to quarter 2 (Apr to Jun) 2016, UK
Source: Office for National Statistics
Download this image Figure 1: Output per hour
.png (25.9 kB) .xls (20.0 kB)
As a consequence, the level of output per hour in the UK exceeded its pre-downturn peak for the first time in Quarter 2 2016 (Figure 2). While productivity remains far below the level implied by its pre-downturn trend, this is the first time that the UK has passed this largely symbolic threshold. Figure 2 shows the productivity performances of different industries in recent years, indexing their levels of output per hour to their respective levels in Quarter 4 (Oct to Dec) 2007 – the pre-downturn productivity peak. It shows the range of experiences across industries and highlights the fall in output per hour in non-Manufacturing production over the last 20 years in particular, largely associated with the fall in the productive potential of the UK’s oil and gas reserves in the North Sea. It also shows the more recent fall in productivity in the finance and insurance industries, and the offsetting, positive experiences of the non-financial services industry and manufacturing.
Figure 2: Output per hour by industry
Seasonally adjusted, quarter 1 (Jan to Mar) 2008 to quarter 2 (Apr to Jun) 2016, UK
Source: Office for National Statistics
Notes:
- Q1 is Quarter 1 (Jan to Mar), Q2 is Quarter 2 (Apr to June), Q3 is Quarter 3 (July to Sept) and Q4 is Quarter 4 (Oct to Dec).
Download this chart Figure 2: Output per hour by industry
Image .csv .xlsVariation in the relative size and productivity experiences of different industries means that these industries have made quite different contributions to productivity growth over recent years. Figure 3 shows the cumulative change in UK output per hour (represented by the line) as well as the contributions of different industries since the pre-downturn peak. It highlights the negative contribution of non-manufacturing production (mainly oil and gas) in particular, which reduced the level of output per hour by around 2 percentage points between Quarter 4 2007 and Quarter 4 2012 – since when the contribution has remained fairly constant. The finance and insurance industries also made a negative contribution in the five years during and following the downturn. Non-financial services – which initially made a negative contribution to productivity following the economic downturn – have since become the main positive contributor, partly driven by the attribution of imputed rents to the real estate industry. While all of these industries are some way below the level of productivity implied by their pre-downturn trend, these data suggest that the weakness of productivity has been relatively more acute in some industries than in others.
Figure 3: Contributions to growth of whole economy output per hour
Cumulative quarterly changes, Q4 2007 to Q2 2016, Seasonally Adjusted, UK
Source: Office for National Statistics
Download this chart Figure 3: Contributions to growth of whole economy output per hour
Image .csv .xls5. International comparisons of productivity
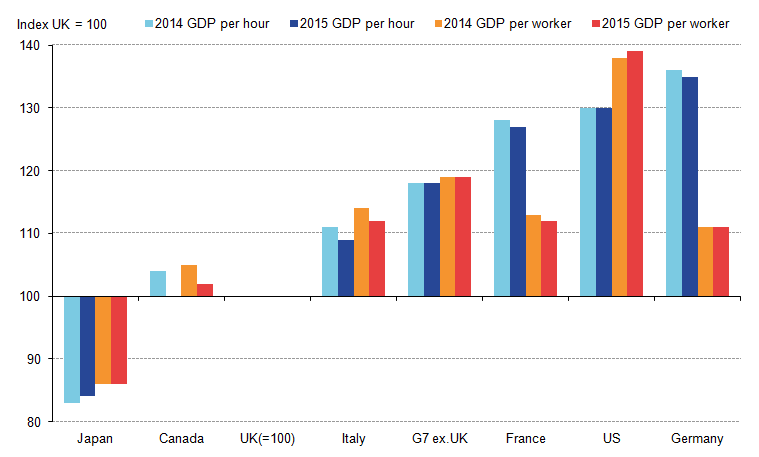
The second of the two “puzzles” which characterise the UK’s productivity performance is the gap between UK output per hour and that in other countries – a gap which, according to new estimates published as part of this Bulletin, was largely unchanged between 2014 and 2015. Although these estimates are constructed using Purchasing Power Parity exchange rates which need careful interpretation, they suggest that output per hour worked in the UK was 18 percentage points lower than the average for the rest of the G7 advanced economies in 2015 (Figure 4). This represents a slight closing of the gap between the UK and Italy, France, Germany and Canada, although the UK’s productivity lead over Japan was eroded slightly on this basis in 2015.
Figure 4: GDP per hour worked and per worker in the G7 economies
Seasonally adjusted, UK=100
Source: Office for National Statistics
Download this image Figure 4: GDP per hour worked and per worker in the G7 economies
.png (18.9 kB) .xls (25.6 kB)
Figure 4 also shows that the gap in output per worker terms between the UK and the rest of the G7 remained constant between 2014 and 2015; at around 19 percentage points. Variation in average hours worked across economies accounts for the marked differences in the output per hour and per worker measures presented in Figure 4. For instance, workers in Germany and France report working fewer hours on average than their UK counterparts and as a consequence, the productivity gap between the UK and these nations is larger when expressed in hourly terms than per worker. Conversely, the productivity gap with the USA is smaller when expressed in output per hour terms, as workers in the USA report longer average working weeks than those in the UK. On either basis, it is clear that these new data do little to improve the UK’s position relative to other leading economies in recent years.
Average hours worked per week is closely watched as an indicator of spare capacity in the labour market and is strikingly different across countries. Figure 5 shows average hours worked per week in the USA and UK since 1998, and indicates that while the trends in the two countries are similar, the working week is consistently 2 to 3 hours longer in the USA than in the UK. In both economies, average hours worked were around an hour a week lower in 2015 than in 1998, although the precise path which the two economies has followed has varied slightly over this period.
Figure 5: Average weekly hours worked
1998 to 2015, UK and US
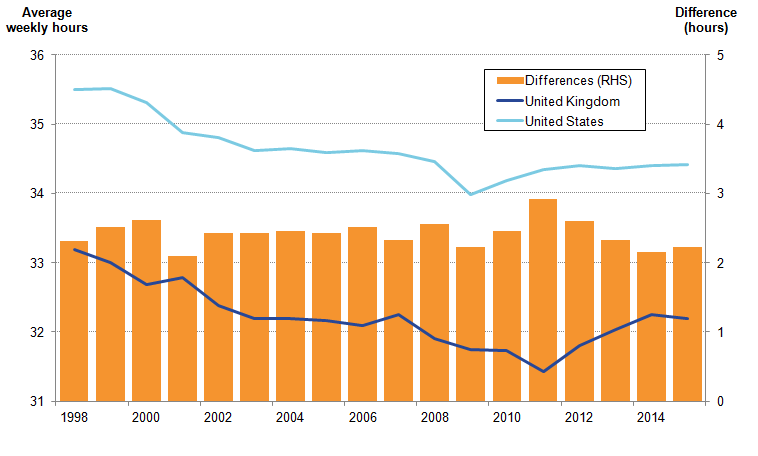
Source: Organisation for Economic Co-operation and Development (OECD)
Download this image Figure 5: Average weekly hours worked
.png (27.3 kB) .xls (27.6 kB)
Changes in the average number of hours worked per week are a consequence of shifts in the distribution of actual hours worked reported in each nation. As previous analysis has established, the distribution of actual hours worked is quite broad in the UK, and much of the long-term movement in average hours worked in the UK is a consequence of smaller numbers of workers reporting very long working weeks. This is evident in Panel A of Figure 6, which shows the distribution of actual hours worked in UK in 1998, 2009 and 2015. In this depiction, the height of the line reflects the proportion of workers at each length of working week. It indicates that the fraction of workers who work more than 40 hours per week fell between 1998 and 2009, with only a partial recovery since the economy emerged from the downturn. Conversely, the number of part-time workers has increased over this time frame – as has the fraction of workers on broadly “full-time” hours of between 37 and 40 per week.
Figure 6: Distribution of actual hours worked through time
1998, 2008, 2015: US and UK
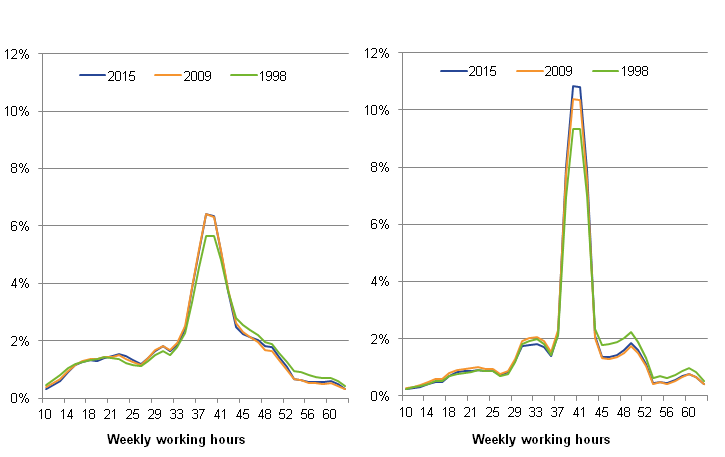
Source: Office for National Statistics and Bureau of Labor Statistics
Download this image Figure 6: Distribution of actual hours worked through time
.png (27.8 kB) .xls (32.3 kB)
Panel B of Figure 6 uses equivalent data from the Current Population Survey for the USA, and indicates that these broad dynamics also appear at play in the USA over the same period. In particular, the number of workers reporting relatively long working weeks has fallen over the last 17 years, replaced by additional mass at the broad, full-time hours peak of around 40 hours. Since the onset of the economic recovery and in contrast to the UK experience, however, the prevalence of part-time working weeks has declined slightly in the US, with a shift back towards full-time hours.
These distributions enable a deeper understanding of differences in labour input in the USA and the UK. Taken together, they indicate that the difference in average hours worked in the USA and UK – a key metric for the calculation of productivity – is not driven by a greater prevalence of very long working weeks in the USA, but by (a) a greater degree of part-time working in the UK and, more importantly, (b) a relatively larger fraction of the USA workforce working close to 40 hours per week.
Figure 7 unpacks these differences, by plotting the difference in the density of workers at each length of working week (as depicted in Figure 6) between the UK and USA in 2015. It indicates that the share of the UK workforce working less than 30 hours per week is greater than the same share in the USA, as is the share working between 44 and 48 hours per week. However, the modal point in the USA distribution of hours worked is to the right of the equivalent UK point (Figure 6). This is consistent with full-time hours being defined as 40 hours per week in the USA and closer to 37 hours in the UK, and may reflect cultural differences between the two labour markets, including the number of public holidays and entitlement to paid holiday. Understanding these differences in average labour input are central to understanding the relative productivity metrics of the UK and USA.
Figure 7: Differences in the distribution of hours worked: UK less US
2015
Source: Office for National Statistics and Bureau of Labor Statistics
Download this chart Figure 7: Differences in the distribution of hours worked: UK less US
Image .csv .xls6. Quality adjusted labour input (QALI)
In addition to data which improves understanding of the quantity of labour input applied in production, ONS also produce data which estimates changes in the effective supply of labour, known as quality adjusted labour input (QALI). These data – new estimates of which are published alongside this Bulletin – provide a measure of labour quality by weighting the hours worked by different types of worker according to their relative productivity. A QALI index will grow faster than a pure volume measure of labour input such as hours worked when the share of workers with relatively high productivity as reflected in their remuneration is increasing and vice versa. Conversely, a QALI index will grow more slowly or fall when the share of workers with relatively low productivity as captured by their pay is increasing.
Estimates of QALI for the UK are of particular interest for productivity analysis as they are a key ingredient for multi-factor productivity (MFP) analysis. In this framework, output growth is decomposed into that which is due to growth in factor inputs – such as capital and labour – and a residual factor which is broadly interpreted as technological progress. When incorporating labour into this framework, ONS accounts for changes in both the quantity of hours worked and the quality of those hours by using the QALI index. Alongside this Bulletin, ONS are publishing updated estimates of quality adjusted labour input (QALI) for the whole economy as well as new estimates for the market sector. The market sector estimates of QALI will be incorporated into MFP estimates in a future publication and reflect development of industry level market sector estimates for workers, hours worked and labour compensation as set out in an accompanying article.
The results of this work suggest that changes in the composition and relative pay rates in the UK economy resulted in a decline of the “quality” of the workforce in both the whole economy and the market sector in 2015. Combined with a deceleration in growth of hours worked, growth of quality adjusted labour in the whole economy was 1.4% in 2015, the slowest since 2011 (Figure 8). The decline in labour quality in 2015 followed two years of marginal improvement and contrasts with robust improvements in labour quality between 2009 and 2012.
Figure 8: Annual QALI growth
Source: Office for National Statistics
Download this chart Figure 8: Annual QALI growth
Image .csv .xlsAlthough the aggregate QALI index grew in 2015, this was entirely due to a change in the quantity of hours worked, rather than an increase in average quality. In addition to annual changes in QALI, Figure 8 shows the contributions of hours worked and labour quality for 1995 to 2015. The labour quality contribution was negative in 2015, continuing a downward trend since 2012 and the first negative contribution from labour quality since 2001. This means that almost all of the growth in quality adjusted labour input over 2013 to 2015 has come from rising hours worked, in marked contrast to the period 2009 to 2012 when all of the growth in QALI came from improvements in quality.
Figure 9 shows annual QALI growth, expressed as differences between the aggregate whole economy estimates (as in Figure 8) and the equivalent estimates for the aggregate market sector using our new market sector framework. Points above the horizontal axis consequently indicate that the QALI index is growing more quickly in the whole economy than in the market sector. Figure 9 suggests that the differences in the QALI growth rates are relatively small – less than 1% in all but one year in the last 20 years – and that they are largely driven by differences in growth of hours worked. The relatively large difference in 2009 reflects market sector hours falling more sharply during the economic downturn, although it is worth noting that hours worked in the whole economy have grown less rapidly than market sector hours in each of the last five years.
Figure 9: Annual QALI growth
Whole economy minus Market sector, UK, 1995 to 2015
Source: Office for National Statistics
Download this chart Figure 9: Annual QALI growth
Image .csv .xlsONS intend to use the industry level market sector QALI estimates from this release in a future MFP release of estimates up to 2015, currently scheduled for publication in April 2017. The ONS Economic Statistics and Analysis Strategy published in September 2016 states that ONS will develop a methodology for compiling quarterly estimates of MFP. The first such quarterly estimates are currently scheduled for publication in January 2018. The development of industry level market sector labour metrics will also allow us to develop QALI estimates for the non-market sector. Such estimates would allow direct comparisons between market sector and non-market sector labour inputs by industry, and potentially offer new insights into productivity. We welcome feedback from users on the value of such estimates.
Back to table of contents7. Management practices
These planned developments to ONS’ existing productivity releases are part of a broader strategy of improvements designed to shed light on the “puzzles” which characterise the UK’s recent performance. As well as developing existing outputs, ONS has been working to develop new data sources on key features of the UK economy which the research literature has identified as important. In particular, a key strand of this literature has shown a relationship between structured management practices and firm-level productivity. As a result, ONS has conducted a pilot survey designed to collect information on the use of structured management practices among businesses in Great Britain. The first results of this pilot are set out as part of this Bulletin and may, in time, provide new insights into the productivity gap between the UK and most other G7 countries and the dispersion of productivity levels among firms in the same industry. These results act as a proof of concept, designed to explore the value of collecting these data on a regular basis.
The pilot Management Practices Survey (MPS) was a voluntary postal survey of 1,026 British manufacturing businesses with 10 or more people in employment, and achieved 68% response rate. The questionnaire comprised 8 questions on structured management practices, which were used to calculate a single management score as the average of individual question scores. The scores ranged from 0 to 1, where the higher the score for a business, the more structured their management practices. Although the pilot had a relatively small sample, the results provide some interesting trends, generally in line with the research literature on the use of structured management practices among manufacturing businesses in Great Britain. The average (weighted) management practice score of a manufacturing business within the survey sample was 0.56, reflecting a mix of practice across businesses.
Some of the key findings of the pilot related to management practices at firms of different sizes and under different forms of ownership. The prevalence of structured management practices for instance is found to be higher among larger businesses (250+ employment), with an average score of 0.79, than among smaller businesses (10-49 employment), scoring on average 0.51 (Figure 10). As smaller businesses account for a majority of the manufacturing business population with 10 or more people in employment (74%), the average for the industry as a whole is closer to that of smaller firms. In general, average management practice scores increase in line with the size of businesses.
Figure 10: Average score by business size
Great Britain, 2015
Source: Office for National Statistics
Notes:
- Population of interest covers manufacturing businesses in Great Britain with employment of at least 10.
Download this chart Figure 10: Average score by business size
Image .csv .xlsAverage management scores were also found to vary by business type in terms of ownership structure (Figure 11). Businesses which are not family-owned are found to have a higher level of structured practices than businesses which are family-owned. However, the low score of family-owned businesses masks considerable variation within this category. Businesses which are family-owned and managed have a relatively low level of structured management practices, but where the business is family-owned but not family-managed, the results suggest a high level of structured practices. In this latter case, the management practices score may be higher even than businesses which are not family owned and comparable to multinational businesses.
Figure 11: Average score by family ownership status
Great Britain, 2015
Source: Office for National Statistics
Notes:
- Population of interest covers manufacturing businesses in Great Britain with employment of at least 10.
Download this chart Figure 11: Average score by family ownership status
Image .csv .xlsMultinational businesses within our population, with a mean score of 0.71, have on average more structured management practices than domestic UK businesses, at 0.54 (Figure 12). However, among multinationals there is little difference in the average scores of businesses with head offices located within or outside the UK.
Figure 12: Average score by multinational status
Great Britain, 2015
Source: Office for National Statistics
Download this chart Figure 12: Average score by multinational status
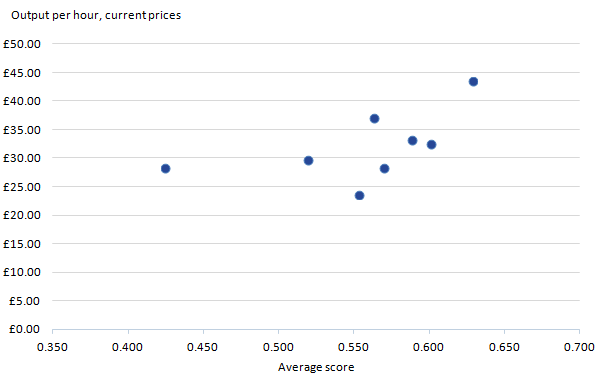
Image .csv .xlsThe primary aim of the management practice survey is to analyse the relationship between businesses’ management practices and their productivity performance. This work will be done at the firm-level – linking information on firm-level productivity and management practices – when data on firm-level productivity becomes available later this year. As an initial step, however, Figure 13 examines the correlation between industry-level management scores and published industry-level measures of labour productivity for 2015 on an output per hour basis. While this analysis is based on relatively few observations, the results suggest a positive relationship between the level of structured management practices and labour productivity at the industry level, with a correlation coefficient of 0.55. While this comparison is too broad to allow for detailed conclusions, it underscores the importance of future work to link MPS data with business level labour productivity estimates, to further analyse the relationship between structured management practice and economic performance. An MPS pilot for services industries currently under development will allow for a wider scope for comparisons across the manufacturing and services industries in Great Britain.
Figure 13: Correlation between management score and labour productivity
UK and Great Britain, 2015
Source: Office for National Statistics
Notes:
- Population of interest covers manufacturing businesses in Great Britain with employment of at least 10.
Download this image Figure 13: Correlation between management score and labour productivity
.png (10.1 kB)
8. Measuring output in the Information Communication and Telecommunications industries
In addition to this work to better understand the quantity, quality and organisation of labour input, ONS has been reviewing existing measures of industry output, building on the challenges set out in the Bean Review (Bean 2016) and the Economic Statistics and Analysis Strategy. In particular, ONS has been working in collaboration with the Institution of Engineering and Technology (IET), the Office for Communications (Ofcom), ONS Research Fellows and members of the academic community to better understand the challenges of measuring output of businesses within the Information and Communications industry.
The activities of this industry capture many of the key issues highlighted in Bean (2016) – including the complexity of measuring output in services, quality adjustment of rapidly changing products and the various conceptual and measurement issues faced in measuring output in the digital economy. To the extent that developments in Information Communication and Telecommunications (ICT) have an impact on other industries, the results of this work are expected to have a wider impact on the measurement of other areas of the economy. Alongside this Bulletin, ONS are publishing an interim report based on the discussions of this group which provides some sense of the key questions posed and the results of this collaboration.
The review is focussed on the measurement of output in Section J of the 2007 Standard Industry Classification (SIC2007) – Information and Communication, and within this section the activities of Divisions 61 – Telecommunications, 62 – Computer programming, consultancy and related activities, and 63 – Information service activities1. The main aim of this review of output measurement was to cover the adequacy of the:
- compilation methods of current and constant price gross value added (GVA)
- coverage of the activities of the industry which are in scope of the National Accounts
- measures of price change
- adjustments for quality in price deflators
- various aspects of quality, value and utility from a consumer’s perspective
The main findings of the group are set out in greater detail in the note which accompanies this Bulletin. In broad terms, the group noted that there is an apparent disconnection between the observable rate of technological change in the ICT industry and the growth rates of output and productivity, which should be better understood. The group discussed several different reasons for this development within a framework which covered the main activities of this industry, as well as several areas in which changes might be made to improve the measurement of output. Several key issues were identified, in particular:
Despite being a perennial issue, the review identified quality adjustment of price deflators as the most likely mechanism for any measurement error in existing measures of output within the National Accounts framework. In particular, the Review suggests that there may be room to improve the measurement of output within the existing National Accounts framework through a review of quality adjustments applied to ICT goods and particularly ICT services in the first instance.
The method for applying those quality adjustments was also discussed. Hedonic regression is the preferred method for quality adjusting ICT products – a method which takes more explicit account of changes in the nature of the products which are offered to market – however, expanding the current scope of quality adjusted prices as suggested above would require exploratory work into efficient quality adjustment models with regard to data, time and resource requirements.
Alongside changes to the measurement of market output from these industries, the group recognised that many of the benefits of recent technological progress in this area accrue to individuals and households. The development of wider measures of consumer welfare may therefore need a new focus, as the traditional notion of Gross Domestic Product (GDP) as a sufficient proxy for welfare may be weakened in the modern digital economy. This is because current output measures may not be able to wholly capture the scale of welfare gains arising from technological improvements. These welfare gains include higher quality of goods and services, increased choice, convenience, time-saving and consumer surplus gained through transactions within the e-economy, including the proliferation of free digital products, which have an impact on National Accounts, household production and consumer leisure activities.
The next steps in developing this agenda includes work towards obtaining new datasets which would support the development of new and efficient quality adjustment models for ICT goods and services. ONS will set out more detailed plans on the goods and datasets that will be used in this work in the coming months.
Notes:
- Section J also includes industries 58 - Publishing activities, 59 - Motion picture, video and television programme production, sound recording and music publishing activities and 60 - Programming and broadcasting activities.
9. Public service productivity
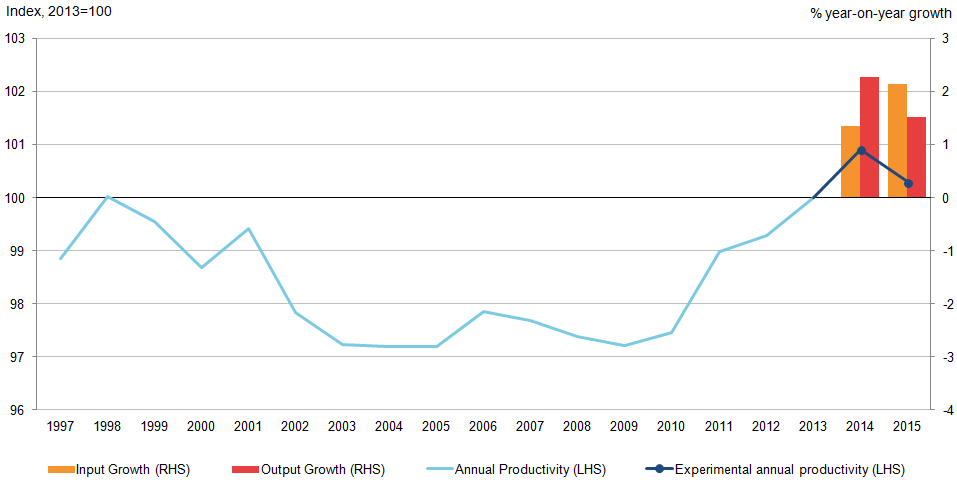
Alongside these improvements to measures of whole economy and market sector productivity, ONS has continued to develop its suite of public service productivity measures, the most recent results of which are published alongside this Bulletin. Public service productivity is estimated to have fallen by 0.6% in 20151, as shown in Figure 14. This was revised down from the previous estimate of a fall of 0.2% in July’s release, driven by growth in public service inputs, which were only partially offset by growth of public service output.
Figure 14: Total UK public service annual productivity with quarterly constructed estimate, 1997 to 2015
Source: Office for National Statistics
Notes:
- Estimates for 2014 and 2015 reflect growth rates of the annualised quarterly total public service productivity applied to the quality adjusted annual total public service productivity.
Download this image Figure 14: Total UK public service annual productivity with quarterly constructed estimate, 1997 to 2015
.png (23.8 kB) .xls (31.2 kB)
Despite the contraction in the latest period, the productivity of the UK public services have been on an upwards trend for much of the last six years. Since 2009 total public service productivity is estimated to have increased by 3.2% – around 0.5% growth per year, and considerably faster than whole economy estimates of multi-factor productivity, which are the closest conceptual equivalent for the UK economy as a whole. Further analysis on annual total public service productivity prior to 2013, including the contribution of individual services, can found in Public service productivity estimates: total public service, 2013.
Examining the quarterly path for these data, Figure 15 shows that public service productivity increased by 0.2% in Quarter 2 (Apr to June) 2016 relative to the previous quarter. The latest rise of productivity was driven by a fall of 0.2% in the volume of public service inputs while output remained flat and was the fourth consecutive period of growth. Despite this recent growth, however, public service productivity remains below its 2014 peak.
Figure 15: Quarterly total UK public service productivity
Quarter 1 (Jan to Mar) 2011 to Quarter 2 (Apr to June) 2016, seasonally adjusted
Source: Office for National Statistics
Notes:
- All estimates are based on experimental quarterly total public service productivity
- Estimates of productivity are indirectly seasonally adjusted, calculated using seasonally adjusted inputs and seasonally adjusted outputs.
Download this chart Figure 15: Quarterly total UK public service productivity
Image .csv .xlsUsing an experimental methodology, these quarterly total public service productivity, inputs and output series provide more timely indicators of the likely trend in the more detailed annual series. To provide this more timely data, these estimates are based on different sources to estimates of annual total public service productivity: they contain less detail and involve a degree of estimation. As a result, they are not intended as replacements for earlier published figures, but are instructive of the more recent periods.
ONS’ next steps in this work are to assess the impact of these differences in methodology and to address issues such as quality adjustment, direct measures of output and inputs, the treatment of annual data, and the geographical and service level breakdown. Feedback on the use of these estimates and suggestions for improvements will be essential for the future development of timely estimates for public service productivity. All feedback is welcome and can be sent to fred.foxton@ons.gov.uk.
Notes:
- Estimates for 2014 and 2015 reflect growth rates of the annualised quarterly total public service productivity applied to the quality adjusted annual total public service productivity.
Contact details for this Article
Related publications
- Labour productivity, UK: October to December 2019
- Measuring output in the Information Communication and Telecommunications industries: 2016
- Management practices and productivity in British production and services industries - initial results from the Management and Expectations Survey: 2016
- Quality adjusted labour input: UK estimates to 2016
- International comparisons of UK productivity (ICP), first estimates: 2016
- Developing labour market metrics for the market sector, UK: 2016
- Public service productivity: quarterly, UK, October to December 2019