Table of contents
- Main points
- Things you need to know about this release
- How many days are lost to sickness absence?
- What are the reasons for sickness absence?
- Which groups have the highest sickness absence rates?
- What is the likelihood of being absent from work due to sickness or injury?
- Why is this information important?
- Quality and methodology
1. Main points
An estimated 137.3 million working days were lost due to sickness or injury in the UK in 2016. This is equivalent to 4.3 days per worker (the lowest recorded since the series began in 1993, when it was at 7.2 days per worker, the highest level over the reference period).
Since 2003, there has been a general decline in the number of days lost to sickness absence, particularly during the economic downturn. Sickness absence fell to a low of 131.7 million days in 2013 but there were increases in 2014 and 2015.
Minor illnesses (such as coughs and colds) were the most common reason for sickness absence in 2016, accounting for approximately 34.0 million days lost (24.8% of the total days lost). This was followed by musculoskeletal problems (including back pain, neck and upper limb problems) at 30.8 million days (22.4%). After ‘other’ conditions, mental health issues (including stress, depression, anxiety and serious conditions) were the next most common reason for sickness absence, resulting in 15.8 million days lost (11.5%).
In 2016, the groups who experienced the highest rates of sickness absence were women, older workers, those with long-term health conditions, smokers, public health sector workers and those working in the largest organisations (those with 500 or more employees).
The groups that have seen the greatest reduction in sickness absence rates over the last 2 decades are workers with long-term health conditions, workers aged 50 to 64, and those in the public sector.
Back to table of contents2. Things you need to know about this release
The estimates included in this release have been produced using the Labour Force Survey (LFS) and Annual Population Survey (APS). They relate to people aged 16 and over in employment and are for the whole of the UK. Estimates are available from 1993 onwards for most tables and are based on annual averages for each calendar year (unless otherwise stated).
A working day is defined as 7 hours and 30 minutes.
Sickness absence rates are calculated as follows:

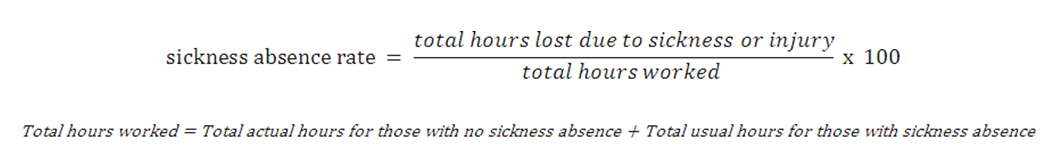
Further information about the methodology used in this bulletin can be found in the previously published Sickness absence in the labour market: February 2014 article.
Back to table of contents3. How many days are lost to sickness absence?
An estimated 137.3 million working days were lost due to sickness or injury in the UK in 2016. This is equivalent to 4.3 days per worker (the lowest recorded since the series began in 1993, when the number peaked at 7.2 days per worker).
The number of working days lost due to sickness or injury was at the highest point in the series during the 1990’s (around 185.0 million in 1995 and 1999) and then generally declined through the 2000’s.
Since 2003, there has been a fall in the number of days lost to sickness absence, particularly during the economic downturn. Sickness absence fell to a low of 131.7 million days in 2013 but there were increases in 2014 and 2015. Despite these, the average days lost per worker and the overall sickness absence rate (Figure 2) have remained largely flat due to an increasing number of people entering the labour market.
Figure 1. Number of days lost due to sickness absence, UK, 1993 to 2016
Source: Labour Force Survey – Office for National Statistics
Download this chart Figure 1. Number of days lost due to sickness absence, UK, 1993 to 2016
Image .csv .xls
Figure 2. Sickness absence rate, UK, 1993 to 2016
Source: Labour Force Survey – Office for National Statistics
Download this chart Figure 2. Sickness absence rate, UK, 1993 to 2016
Image .csv .xls4. What are the reasons for sickness absence?
Minor illnesses (such as coughs and colds) were the most common reason for sickness absence in 2016, accounting for approximately 34.0 million days lost (24.8% of the total days lost to sickness). This was followed by musculoskeletal problems (including back pain, neck and upper limb problems) at 30.8 million days (22.4%). After ‘other’ conditions, mental health issues (including stress, depression, anxiety and more serious conditions such as manic depression and schizophrenia) were the next most common reason for sickness absence, resulting in 15.8 million days lost (11.5%).
These categories were also the most common reasons given by people for a sickness absence. Minor illnesses were given as a reason for sick absence 33.1% of the time with musculoskeletal problems being reported 18.6% of the time.
Figure 3. Reasons for sickness absence1, UK, 2016

Source: Labour Force Survey – Office for National Statistic
Notes:
- 'Musculoskeletal problems' includes back pain, neck and upper limb problems and other musculoskeletal problems. 'Other' includes the total number of days lost to diabetes as well as days lost to accidents, poisonings, infectious diseases, skin disorders and anything else not covered. ‘Respiratory conditions’ include asthma, Chronic Obstructive Pulmonary Disease [OPD], bronchitis and pneumonia. ‘Genito-urinary problems’ include urine infections, menstrual problems and pregnancy problems.
Download this image Figure 3. Reasons for sickness absence^1^, UK, 2016
.png (36.9 kB) .xlsx (14.2 kB)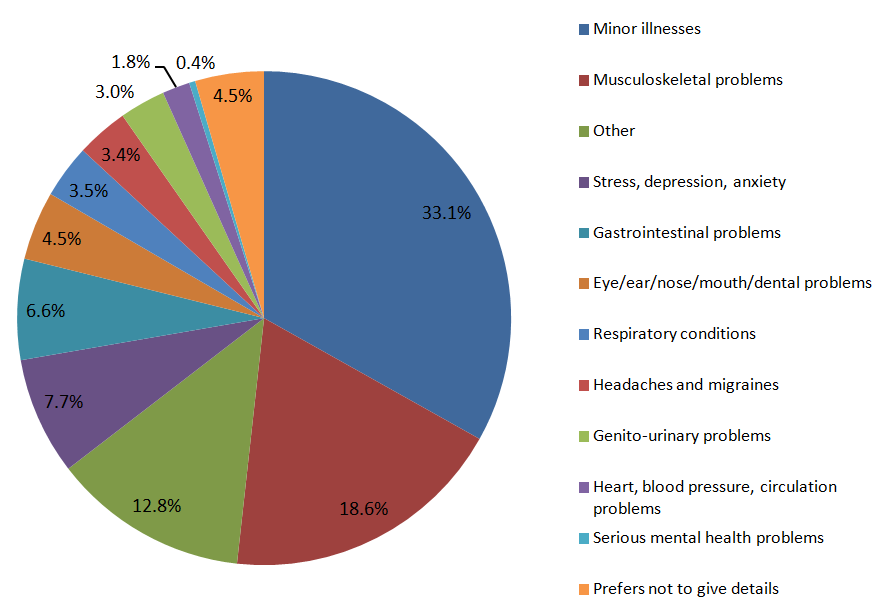
The main reasons for sickness absence given by men and women in 2016 were:
Men
- Minor illnesses (32.8%)
- Musculoskeletal problems (23.7%)
- Other (12.5%)
Women
- Minor illnesses (33.4%)
- Musculoskeletal problems (14.5%)
- Other (13.0%)
For women, genito-urinary problems (including urine infections and pregnancy related problems) were the reason for 4.7% of sickness absences.
Back to table of contents5. Which groups have the highest sickness absence rates?
In 2016, the overall sickness absence rate (which can be interpreted as the proportion of working hours lost due to sickness or injury) in the UK was 1.9%.
The groups who experienced the highest rates of sickness absence were:
Demographics and geography
- women (2.5% versus 1.6% for men)
- older workers (2.9% for ages 65 and over versus 1.5% for ages 16 to 24 and 25 to 34)
- workers living in Wales and Scotland (2.6% and 2.5% respectively versus 1.4% in London)
Health status
- workers with long-term health conditions (4.4% versus 1.2% for those without)
- smokers (2.5% versus 1.6% for those who have never smoked1)
Employment type
- public sector workers (2.9% versus 1.7% for private sector workers)
- employees (2.1% versus 1.4% for self-employed)
- workers in organisations with 500 and over employees (2.5% versus 1.6% for organisations with fewer than 25 employees)
- workers in caring, leisure, other service, and elementary occupations (2.7% versus 1.1% for managers and professionals)
- part-time workers (2.6% versus 1.9% for full-time workers)
Demographics and geography
Since 1993, sickness absence rates have been consistently lower for men than women, although rates for both sexes have generally fallen over the 1993 to 2016 period. In 2016, women lost 2.5% of their working hours due to sickness or injury, a fall of 1.3 percentage points since 1993. In contrast, men lost 1.6% of hours, which represents a fall of 1.1 percentage points since 1993.
Figure 4. Sickness absence rate: by sex, UK, 1993 to 2016
Source: Labour Force Survey – Office for National Statistics
Download this chart Figure 4. Sickness absence rate: by sex, UK, 1993 to 2016
Image .csv .xlsSickness absence rates are higher among older workers than younger workers as they are more likely to develop health problems. All age groups experienced a fall in sickness absence rates in 2016 compared with 1993, with the exception of those aged 65 and over. In 2016, the rate was higher for workers aged 65 and over than those aged 50 to 64 for the first time.
Many older workers are now remaining in the labour market beyond State Pension Age. The employment rate of those aged 65 and over has more than doubled from 4.9% (422,000 people) in October to December 1993 to 10.4% (1.2 million people) in October to December 2016. During this period, the sickness absence rate for this group has been variable and stood at 2.9% in 2016.
Workers aged 50 to 64 experienced the largest decrease in their sickness absence rate between 1993 and 2016, falling from 4.4% to 2.7%.
Figure 5. Sickness absence rate: by age group, UK, 1993 and 2016
Source: Labour Force Survey – Office for National Statistics
Download this chart Figure 5. Sickness absence rate: by age group, UK, 1993 and 2016
Image .csv .xlsWorkers living in Wales and Scotland had the highest sickness absence rates for the October 2015 to September 2016 period at 2.6% and 2.5% respectively. Northern Ireland had a sickness absence rate of 2.3%. In England, workers living in the North East had the highest rate at 2.3% while those in London had the lowest rate at 1.4%. This can be largely explained by the younger age profile of people and workers living in London and the types of occupations that they do (there is a large concentration of high-skilled jobs in London, which tend to have lower rates of sickness absence – see Figure 12 for sickness absence rates by occupation).
Figure 6. Sickness absence rate: by region, UK, Oct 2015 to Sep 2016
Source: Annual Population Survey (APS) – Office for National Statistics
Download this chart Figure 6. Sickness absence rate: by region, UK, Oct 2015 to Sep 2016
Image .csv .xlsHealth status
Workers who report having a long-term health condition (lasting 12 months or more) have the highest sickness absence rate across all groups. In 2016, the sickness absence rate for those with a long-term health condition was 4.4% compared with 1.2% for those without.
However, workers with long-term health conditions have experienced a notable reduction in their sickness absence rate over the past 2 decades. Since the series began in 1997, the rate has fallen by 2.6 percentage points from 7.0% to 4.4% in 2016.
Figure 7. Sickness absence rate: by long-term health condition, UK, 1997 to 20161
Source: Labour Force Survey – Office for National Statistics
Notes:
- The long-term health condition reported by respondents may not be related to the reason for sickness absence.
Download this chart Figure 7. Sickness absence rate: by long-term health condition, UK, 1997 to 2016^1^
Image .csv .xlsIn relation to smoking status, during the January to December 2015 period, current smokers had a sickness absence rate of 2.5%. This was followed by ex-smokers at 2.3%, and those who have never smoked at 1.6%.
Figure 8. Sickness absence rate: by smoking status, UK, Jan to Dec 2015
Source: Annual Population Survey – Office for National Statistics
Download this chart Figure 8. Sickness absence rate: by smoking status, UK, Jan to Dec 2015
Image .csv .xlsEmployment type
Figure 9. Sickness absence rate: by public and private sector, UK, 1994 to 2016
Source: Labour Force Survey – Office for National Statistics
Download this chart Figure 9. Sickness absence rate: by public and private sector, UK, 1994 to 2016
Image .csv .xlsIn 2016, sickness absence rates for workers within the public and private sectors stood at 2.9% and 1.7% respectively. Since 1994 (the earliest data available), the rate for those employed in the public sector has been consistently higher than the rate for those employed in the private sector, although both sectors have seen an overall decrease.
The main reasons given for sickness absence among public and private sector workers in 2016 were:
Private sector
- Minor illnesses (34.8%)
- Musculoskeletal problems (19.8%)
- Other (12.5%)
Public sector
- Minor illnesses (28.7%,)
- Musculoskeletal problems (15.8%)
- Other (13.3%)
There is variation in the sickness absence rate across different organisations within the public sector. The sickness absence rate for workers in the health sector was 3.5% in 2016, down from 4.3% in 2004. Although this represents a decrease of 0.8 percentage points, the current rate is still 0.6 percentage points above the public sector average. It is possible that the exposure of health workers to infections and diseases contributes to their higher sickness absence rate.
Across central and local government, sickness absence rates reduced between 2004 and 2016 by 0.9 percentage points and 0.8 percentage points respectively, although the current rates are still above the UK average of 1.9%.
Figure 10. Sickness absence rate: by larger public sector organisation, UK, 2004 and 2016
Source: Labour Force Survey – Office for National Statistics
Download this chart Figure 10. Sickness absence rate: by larger public sector organisation, UK, 2004 and 2016
Image .csv .xlsThere are a number of factors to consider when examining the differences between the public and private sectors, including:
- there are differences in the types of jobs between the 2 sectors and some jobs have higher likelihoods of sickness than others
- workers in the private sector are more likely to not be paid for a spell of sickness than those in the public sector
- the analysis only counts someone as sick if they work fewer hours than they are contracted for, it would exclude someone who makes up lost hours at a later point in the week; it may be possible that individuals in smaller workforces are under more pressure to make up any lost hours and these workforces are more prominent in the private sector, however, no data is collected on hours made up following sick absence
Employees have a higher rate of sickness absence than self-employed workers, although the rates have generally fallen for both groups and the gap has narrowed over the 1993 to 2016 period. In 2016, sickness absence rates for employees and the self-employed stood at 2.1% and 1.4% respectively.
Figure 11. Sickness absence rate: by employment status, UK, 1993 to 2016
Source: Labour Force Survey – Office for National Statistics
Download this chart Figure 11. Sickness absence rate: by employment status, UK, 1993 to 2016
Image .csv .xlsIn terms of workforce size, workers in large organisations employing 500 people or more report the highest rate of sickness absence. In 2016, this stood at 2.5% compared with a rate of 1.6% for workers in organisations that employ fewer than 25 people.
In terms of occupation, workers in caring, leisure and other service occupations and those in elementary occupations (for example, bar staff, hospital porters, shelf fillers) have the highest sickness absence rates. In 2016, these stood at 2.7%.
In contrast, those working in managerial and senior roles (for example, chief executives and financial managers and directors) have the lowest rate at 1.1%, followed by those in professional roles (for example, civil engineers, medical practitioners and legal professionals) at 1.7%.
Figure 12. Sickness absence rate: by occupation group, UK, 2016
Source: Labour Force Survey – Office for National Statistics
Download this chart Figure 12. Sickness absence rate: by occupation group, UK, 2016
Image .csv .xlsThe sickness absence rate for part-time workers has been consistently higher than the rate for full-time workers. This can be explained in part by higher numbers of women working part-time, as they also tend to have higher rates of sickness absence.
Although both part-time and full-time workers have experienced a decline in their sickness absence rates over the 1993 to 2016 period, the gap between them has increased, from 0.3 to 0.7 percentage points. In 2016, the sickness absence rate for part-time workers was 2.6% compared with 1.9% for full-time workers.
Figure 13. Sickness absence rate: by part-time and full-time status, UK, 1993 to 2016
Source: Labour Force Survey – Office for National Statistics
Download this chart Figure 13. Sickness absence rate: by part-time and full-time status, UK, 1993 to 2016
Image .csv .xlsNotes for: Which groups have the highest sickness absence rates?
- Figures relate to 2015 data.
6. What is the likelihood of being absent from work due to sickness or injury?
The likelihood of an individual being absent from work due to sickness or injury varies according to different factors. Logistic regression is a statistical technique that can be used to examine these and calculate the ‘odds’ of a worker in a particular group reporting sickness absence relative to a reference group. It should be noted that the groups assessed are not mutually exclusive. For more information about this technique, please see the Sickness absence in the labour market: February 2014 article.
For the October 2015 to September 2016 period, the “odds” of reporting sickness absence (when controlling for different factors that may influence sickness) for different groups were:
- 32.0% higher for women relative to men
- 42.0% lower for workers aged 16 to 24, 31.0% lower for workers aged 25 to 34 and 24.0% lower for workers aged 35 to 49, all relative to those aged 50 to State Pension age1
- 27.0% higher for workers in the public sector relative to workers in the private sector
- 36.0% higher for workers in organisations with 500 and over employees relative to workers in organisations with less than 25 employees
- 14.0% lower for managers and senior officials relative to those working in professional roles, but 80.0% higher for process plant and machine operative workers relative to professionals
Further results can be found in the dataset that accompanies this release.
Notes for: What is the likelihood of being absent from work due to sickness or injury?
1.This takes account of the incremental changes to women’s State Pension age, which began in April 2010.
Back to table of contents7. Why is this information important?
The information provided in this release can be used by central and local governments as well as employers across all sectors to identify the groups and types of employment that have higher rates of sickness absence. This could help them to develop and target policies that aim to provide effective support for workers and help to reduce the number of days lost to sickness and injury.
In the Improving Lives: the work, health and disability green paper, the government sets out a focus on supporting people with disabilities and health conditions to enter and remain in the workplace, as well as supporting employers to create and promote healthy work environments. Presenting historical trends in sickness absence for different groups will help the government to understand where reductions have already been made and the disparities that still exist between different groups.
The statistics in this release may also be of interest to the general public and they could be used to inform debate.
Back to table of contents8. Quality and methodology
The Labour Force Survey and Annual Population Survey Quality and Methodology Information documents contain important information on:
- the strengths and limitations of the data and how it compares with related data
- uses and users of the data
- how the output was created
- the quality of the output including the accuracy of the data
The methodology used in this release is the same as that used and explained in the previously published Sickness absence in the labour market: February 2014 article.
Since the estimates in the above release were published, the Labour Force Survey has been re-weighted. This means that figures previously presented for 2001 to 2013 have been revised (using 2014 person weights for 2001 to 2011 and 2016 person weights for 2012 onwards).
We would welcome feedback on any aspect of this release – please send your comments to labour.market.analysis@ons.gov.uk
Back to table of contents