1. Main points
The number of paid employees in the UK in December 2019 grew by 1.1%, compared with the same period of the previous year.
Median monthly pay grew by 3.8% in December 2019, compared with the same period of the previous year.
Growth in median pay for employees in the three months to December 2019 was highest in Scotland (3.9%) and lowest in Wales (2.7%).
Pay growth in the UK for employees was highest at the 25th percentile (4.2%) and lowest at the 10th percentile (2.5%) in the three months to December 2019, for the percentiles we have analysed.
2. Individuals receiving pay
In December 2019, 29.1 million people were paid employees (Figure 1). This represents a 1.1% rise in paid employees when compared with the same period of the previous year.
Figure 1: The number of employees has been growing over the past five years
Paid employees, UK, July 2014 to December 2019, seasonally adjusted
Source: HM Revenue and Customs – Pay As You Earn Real Time Information
Download this chart Figure 1: The number of employees has been growing over the past five years
Image .csv .xlsAnnual growth in the number of employees has remained broadly within a range of 0.9% to 1.4% over the past three years, following higher rates of growth prior to mid-2016 (Figure 2).
Figure 2: Growth in the number of paid employees has been fairly steady over the past three years
Annual percentage change, UK, July 2015 to December 2019, seasonally adjusted
Source: HM Revenue and Customs – Pay As You Earn Real Time Information
Notes:
- Percentage change has been calculated using unrounded figures
Download this chart Figure 2: Growth in the number of paid employees has been fairly steady over the past three years
Image .csv .xls3. Median monthly pay
Median monthly pay for employees in December 2019 was £1,842 (Figure 3). This represents a 3.8% rise when compared with the same period of the previous year.
Figure 3: Median pay has grown over the past five years
Median pay per month, UK, July 2014 to December 2019, seasonally adjusted
Source: HM Revenue and Customs – Pay As You Earn Real Time Information
Download this chart Figure 3: Median pay has grown over the past five years
Image .csv .xlsGrowth in median pay has generally increased over the past four years, although there have been periods of deviation from this trend (Figure 4). Following a relatively stable period at around 2.3% between mid-2016 and mid-2017, pay growth generally increased. While pay growth has fallen from its peak of 4.6% in April 2019, it is not yet clear whether this marks a break from its previous upwards, but volatile, trend.
Figure 4: The rate of growth in median pay has generally increased over the past five years
Percentage change on same month in previous year, UK, July 2015 to December 2019, seasonally adjusted
Source: HM Revenue and Customs – Pay As You Earn Real Time Information
Notes:
- Percentage change has been calculated using unrounded figures
Download this chart Figure 4: The rate of growth in median pay has generally increased over the past five years
Image .csv .xlsThe regional figures in this bulletin are based on where employees live and not the location of their place of work. They are also based on three-month moving averages. Median pay across regions and nations of the UK in the three months to December ranged from £1,691 in Northern Ireland to £2,228 in London (Figure 5).
Figure 5: Median pay varies across the UK
Pounds per month, UK, three months to December 2019, seasonally adjusted

Source: HM Revenue and Customs – Pay As You Earn Real Time Information
Download this image Figure 5: Median pay varies across the UK
.png (103.4 kB) .xlsx (17.6 kB)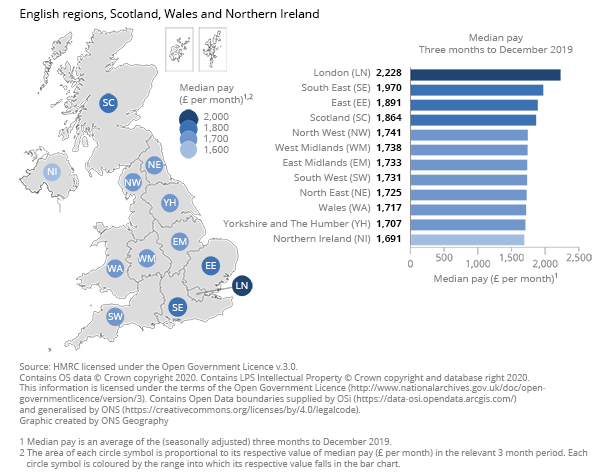
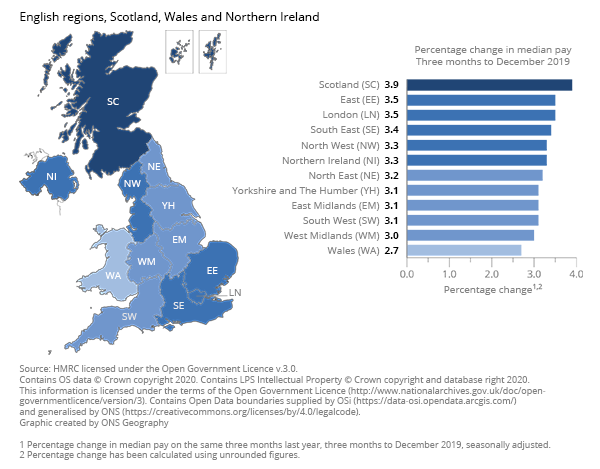
Compared with the same time last year, pay grew fastest in Scotland (3.9%) and slowest in Wales (2.7%) (Figure 6). Over the longer term, on average over the past five years, pay growth was highest in London (at an annualised rate of 2.8%) and slowest in the North East (2.3%).
Figure 6: Median pay increased most in Scotland and least in Wales
Percentage change on same three months last year, UK, three months to December 2019, seasonally adjusted
Source: HM Revenue and Customs – Pay As You Earn Real Time Information
Notes:
- Percentage change has been calculated using unrounded figures.
Download this image Figure 6: Median pay increased most in Scotland and least in Wales
.png (94.4 kB)
4. Pay distribution
In the three months to December 2019, the 10th percentile of the monthly pay distribution was £614, the 90th percentile was £4,413, and the 99th percentile was £12,536 (Figure 7). This means that 10% of paid employees earnt equal to or less than £614 per month, 90% earnt equal to or less than £4,413, and 99% earnt equal to or less than £12,536.
Figure 7: 10% of employees earn less than £614 per month and 90% earn less than £4,413 per month
£ per month, UK, three months to September 2014 to three months to December 2019, seasonally adjusted
Source: HM Revenue and Customs – Pay As You Earn Real Time Information
Download this chart Figure 7: 10% of employees earn less than £614 per month and 90% earn less than £4,413 per month
Image .csv .xlsCompared with the same time a year ago, of the percentiles we have analysed, pay growth was highest at the 25th percentile (4.2%) and lowest at the 10th percentile (2.5%).
When interpreting changes in the distribution over time, it can be useful to compare the level of percentiles relative to the median (that is, the amount of earnings in the middle of the distribution so that half of employees earn more and half earn less).
Figure 8 divides each percentile by the median, and then indexes these to 100 at the start of the series to better focus on their movements over time. Growth in these series reflects a percentile growing faster than median pay, while a fall in these series reflects a percentile growing slower than median pay.
Figure 8: Since 2014, employees’ pay has generally grown fastest at the low end of the pay distribution
Ratio of selected percentiles relative to the median, rolling three-month average, UK, three months to September 2014 to three months to December 2019 seasonally adjusted
Source: HM Revenue and Customs – Pay As You Earn Real Time Information
Download this chart Figure 8: Since 2014, employees’ pay has generally grown fastest at the low end of the pay distribution
Image .csv .xlsThe 10th and 25th percentiles of employees’ pay have generally grown faster than median pay over the past five years, coinciding with the introduction of and increases to the National Living Wage (NLW). However, since mid-2018, the 10th percentile and the median have grown at broadly the same pace, so their ratio has remained broadly constant. In line with the rest of this bulletin, Figure 8 includes only employees’ pay and not other income such as from self-employment.
The ratio of the 90th percentile to the median has generally fallen, reflecting pay towards this high end of the distribution growing slightly slower than median pay. When focusing even further towards the high end of the distribution, pay at the 99th percentile has grown at a broadly similar pace to median pay.
Back to table of contents5. Earnings and employment data
Real Time Information statistics reference table, seasonally adjusted
Dataset | Released 18 February 2020
Employee counts and earnings data, including geographic and distributional breakdowns, from Pay As You Earn (PAYE) Real Time Information (RTI), seasonally adjusted.
Real Time Information statistics reference table, non-seasonally adjusted
Dataset | Released 18 February 2020
Employee counts and earnings data, including geographic and distributional breakdowns, from PAYE RTI, non-seasonally adjusted.
6. Glossary
Median monthly pay
Median monthly pay shows what a person in the middle of all employees would earn each month. The median pay is generally considered to be a more accurate reflection of the “average wage” because it discounts the extremes at either end of the scale.
National Minimum Wage and National Living Wage
The National Minimum Wage (NMW) is a minimum amount per hour that most workers in the UK are entitled to be paid. There are different rates of minimum wage depending on a worker’s age and whether they are an apprentice. The NMW applies to employees aged between 16 and 24 years. The government’s National Living Wage (NLW) was introduced on 1 April 2016 and applies to employees aged 25 years and over.
On the Annual Survey of Hours and Earnings (ASHE) reference date in April 2019, the NMW and NLW rates were:
£8.21 for employees aged 25 years and over
£7.70 for employees aged 21 to 24 years
£6.15 for employees aged 18 to 20 years
£4.35 for employees aged 16 to 17 years
£3.90 for apprentices aged 16 to 18 years and those aged 19 years or over who are in the first year of their apprenticeship
Pay As You Earn (PAYE)
PAYE is the system employers and pension providers use to take Income Tax and National Insurance contributions before they pay wages or pensions to employees and pensioners. This publication relates to employees only and not pensioners. It was introduced in 1944 and is now the way most employees pay Income Tax in the UK.
Back to table of contents7. Measuring the data
Data source and collection
The data for this release come from HM Revenue and Customs’ (HMRC’s) Pay As You Earn (PAYE) Real Time Information (RTI) system. It covers the whole population rather than a sample of people or companies, and it will allow for more detailed estimates of the population. The release is classed as Experimental Statistics as the methodologies used to produce the statistics are still in their development phase. As a result, the series are subject to revisions.
Coverage
This publication covers employees paid by employers only. It does not cover self-employment income or income from other sources such as pensions, property rental and investments. Where individuals have multiple sources of income, only income from employers is included.
The figures in this release are for the period July 2014 to December 2019 and are seasonally adjusted.
Upcoming changes
Future bulletins are planned to include additional statistics, such as more detailed geographic breakdowns. The focus and timing of these will be informed by user feedback. Please email rtistatistics.enquiries@hmrc.gov.uk if you would like to offer feedback on how the contents can be improved in the future.
Methodology
An accompanying article contains more information on the calendarisation and imputation methodologies used in this bulletin, alongside comparisons with other earnings and employment statistics and possible quality improvements in the future.
Back to table of contents8. Strengths and limitations
HM Revenue and Customs (HMRC) grants pre-release access to official statistics publications. As this is a joint release, and in accordance with the HMRC policy, pre-release access has been granted to a number of people to enable the preparation of a ministerial briefing. Further details, including a list of those granted access, can be found on HMRC’s website.
Experimental Statistics status
This is a joint experimental release between HMRC and the Office for National Statistics (ONS). The existing monthly publications produced by the ONS remain the primary National Statistics for the labour market. The intention is that these new statistics will also be updated on a monthly basis.
The release is classed as Experimental Statistics as the methodologies used to produce the statistics are still in their development phase. This does not mean that the statistics are of low quality, but it does signify that the statistics are new and still being developed. As the methodologies are refined and improved, there may be revisions to these statistics.
Rather than waiting until the development work has been completed, the statistics are being published now to involve potential users in developing the statistics. We hope that this encourages users to provide us with their thoughts and suggestions of how useful the statistics are and what can be done to improve them. Comments can be sent by email to rtistatistics.enquiries@hmrc.gov.uk.
More information about Experimental Statistics, including when they should be used and the differences between them and National Statistics, is available.
Strengths of the data
As Pay As You Earn (PAYE) Real Time Information (RTI) data cover the whole population, rather than a sample of people or companies, we will be able to use this to produce estimates for geographic areas and other more detailed breakdowns of the population. At the moment, the methods for producing such breakdowns are under development and we expect to include further statistics in a future release. These statistics can help inform decision-making across the country. They also have the potential to provide more timely estimates than existing measures.
These statistics also have the potential to replace some of those based on surveys, which could reduce the burden on businesses needing to fill in statistical surveys.
Imputation and revisions
A disadvantage of the calendarisation used is that the figures for pay and numbers of employees in month t depend on payments made in month t plus 1. This means only around 80% of the data used in the calculation on month t statistics are available at the end of each month.
Rather than wait until all those remaining payment returns have been received, we have decided to produce more timely measures of pay and numbers of employees by imputing the values for missing returns. The data on which the statistics are based were extracted at the end of January, which means around 1% to 2% of the pay in the latest month of these statistics is imputed. As a result, the figures in future releases will be updated as new payment returns are received, and the imputation payments can be replaced with actual data.
Differences compared with the Labour Force Survey and Average Weekly Earnings statistics
Further information about the methodology used and comparisons with the ONS’s Labour Force Survey and average weekly earnings can be found in an accompanying article.
Back to table of contentsContact details for this Statistical bulletin
labour.market@ons.gov.uk rtistatistics.enquiries@hmrc.gov.uk
Telephone: +44 (0)1633 455400 +44 (0)3000 593779