1. Introduction
Since 2015, we have been developing our use of data from Value Added Tax (VAT) returns. This is an important step in transforming the data sources used to produce economic statistics. The use of such administrative data can deliver improvements in our statistical outputs whilst significantly reducing respondent burden.
This article describes our progress to date and the opportunities that exist in maximising this comprehensive data source for use within the production of economic statistics. We will focus on the impact of this change to the short-term indicators: construction output, Index of Production (IoP), Index of Services (IoS) and retail sales.
VAT turnover covering 735,000 businesses is now already used in the calculation of gross domestic product (GDP). But we will describe an ambitious strategy to use more VAT turnover data, fewer surveys, and deliver improvements – both in data quality and the capability to comprehend industrial and geographic detail.
Back to table of contents2. What is the VAT data source?
Each month we receive a fresh supply of turnover and expenditure data from HM Revenue and Customs (HMRC), sourced from Value Added Tax (VAT) returns. These are stored in a secure and confidential environment and only accessed by individuals with a business need to analyse the data. VAT returns are submitted on a monthly, quarterly or annual basis. Many large businesses submit monthly, most very small businesses (less than 1% of businesses that submit returns) submit annually, while 90% of businesses submit on a rolling quarterly basis. Our focus has been on how VAT turnover data can be used as an administrative data source for producing economic statistics.
There are currently some 8 million VAT returns completed in a year, covering 2 million registrations, available for use. This includes all businesses liable for VAT above the current threshold of £85,000 at April 2018 and for those businesses below the threshold who choose to register.
We maintain and use a business register, which is an important first step in ensuring all enterprises we know about are represented and their economic story can be told. This is known as the Inter-Departmental Business Register (IDBR). We have developed approaches that can link the VAT data to the IDBR.
The linked dataset allows us to assign the VAT turnover of corporate VAT returns to IDBR enterprises involving the same principles and practices that create the IDBR. An enterprise is an organisational unit producing goods or services that has a certain degree of independence in decision-making. An enterprise can carry out more than one economic activity and it can be situated at more than one location. An enterprise may consist of one or more reporting units and these may consist of multiple local units.
Figure 1: Types of IDBR units

Source: Office for National Statistics
Download this image Figure 1: Types of IDBR units
.png (23.6 kB)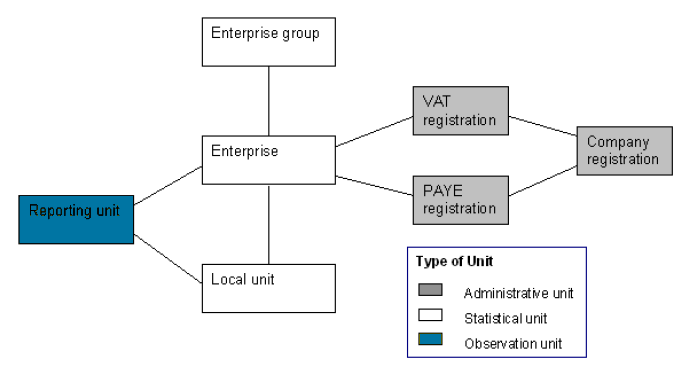
We can then access the low-level industrial and geographic data connected to each reporting unit from the appropriate VAT turnover return. The scale of this dataset delivers a level of detail that is not attainable from either the 46,000 surveys despatched by us each month, or the variety of administrative data that support the short-term indicators. For example, in November 2016, construction output estimates were based upon 8,000 survey forms while VAT data, linked to the IDBR, was available for 200,000 reporting units.
Back to table of contents3. Progress and current use of VAT turnover in short-term indicators
Our efforts to maximise the Value Added Tax (VAT) turnover data source have featured in the Independent review of UK economic statistics by Professor Sir Charles Bean and are closely aligned to the UK Statistics Authority strategy for UK statistics – Better Statistics, Better Decisions.
VAT has been a successful pathfinder in the use of big administrative data in the processing and calculation of official statistics within the UK. VAT turnover data from January 2012 to the present can be linked to every business on the IDBR with a matching success rate of over 99% of VAT returns.To fully use such large datasets, we have developed our processing systems and technologies for use in a cloud computing environment, which is a pre-requisite for exploiting the potential of large administrative datasets.
Initial strategic use for short-term indicators
In December 2017, VAT turnover from our new data source and method was used for the first time in gross domestic product (GDP) through the short-term indicators, as a quarterly benchmark for elements of construction output, Index of Production (IoP) and Index of Services (IoS). This was the first successful use of large administrative datasets as part of our transformation programme.
The survey for these outputs is split into sampling strata based on the registered employment of each business on the IDBR. Band 1 represents the smallest businesses in an industry and the sample is selected at random from the universe of businesses contained on the IDBR for the sampling period. Bands 2 and 3 similarly represent small- and medium-sized businesses that are selected at random, although for a few industries Band 3 can also be a comprehensive survey of activity. Band 4 represents the largest businesses in an industry, and the selection constitutes a census of businesses above the employment cut-off for that industry.
Bands 1 to 3 were in scope for being augmented with a VAT turnover benchmark. All industries at Band 4 level, normally representing 50 to 70% of the entire turnover of an industry, were excluded as the survey data are captured more quickly than through VAT returns. In December 2017, VAT turnover was used as a benchmark for the first time for 240 sampling strata following detailed analysis of impact, revisions and fit, or correlation, on growth. A further 21 strata were added for the Index of Services, April 2018 bulletin.
Short-term indicators now use VAT turnover as a benchmark across 261 of the 488 sampling strata within construction output, IoP and IoS, which are measured using 10,100 surveys. This is based upon VAT turnover data covering 735,000 businesses or reporting units:
in construction output 2,400 surveys are now supplemented by 86,500 VAT returns
in IoP 1,800 surveys are supplemented by 76,500 VAT returns
in IoS 5,900 surveys are supplemented by 572,000 VAT returns
The benchmark process entails using data over a quarter in arrears to align with the national accounts revision policy. For example, Quarter 1 (Jan to Mar) 2018 VAT turnover data was first published with the relevant short-term indicators for July 2018.
Back to table of contents4. A new strategy for short-term indicators
The use of administrative data has a long history within the compilation of economic outputs, stretching back to their formation. Administrative data other than Value Added Tax (VAT) turnover is already used widely within short-term indicators, particularly for Index of Services (IoS) but also in some Index of Production (IoP) elements. Our new strategy will clearly combine survey and administrative data for the first time.
In future, we will move towards a model where surveys are retained for larger businesses while smaller businesses will largely be covered using VAT turnover data. The combination of both survey and administrative data will provide benefits of both types of data sources. Retaining surveys will deliver quick, monthly data and allow us to talk to businesses to discover the reasoning behind fluctuations. But at present some of our survey data, particularly for small businesses, are impacted by sampling noise and variability. VAT turnover will allow us to overcome these occasional issues rather than relying upon quality adjustments. However, we will need to develop robust forecasting methods to overcome the slow accumulation of an appropriate number of VAT returns, as returns received in the first two to three months can be unrepresentative.
The use of VAT data gives us opportunities to achieve cost savings. The number of surveys needed to obtain the same information is expected to reduce, while the business burden will also decrease as there will be a reduced requirement to respond to the survey questionnaires. We may reinvest some of these savings in expanding the coverage of our surveys to the larger businesses in new industries within IoS, which are currently measured through other limited administrative sources.
Distributive trades
In 2019 it is hoped to use the new model for measuring the retail, wholesale and motor trades industries, or distributive trades. The three industries currently derive their estimates from 12,000 surveys but it is planned that these will be reduced by around a half, which is a significant reduction of burden for existing businesses within our surveys. These would then be replaced by data from 200,000 VAT returns. VAT turnover benchmarks are not currently used for any of these industries. As this work progresses articles will be released to show the progress and explain the methodology.
Extending the model
By the end of 2021 it is planned that the use of VAT data will be expanded to construction output, IoP and IoS. It is envisaged that the 46,000 surveys currently sent out per month will also be cut by around a half.
Based on detailed analysis, we will also consider extending the use of VAT turnover data to new industries currently measured largely by other administrative data such as:
agriculture
forestry
fishing
transport (rail, air, water)
commercial property
social care
gambling
membership organisations
We will also investigate whether improvements in data quality could be delivered through VAT turnover data alone. The industries listed above account for some 7.8% of gross value added in 2016.
Back to table of contents5. VAT turnover data – what can it do now?
One of the main advantages of the Value Added Tax (VAT) turnover dataset is that it can allow us to consider more detailed breakdowns of industries at a level and detail that has not previously been easy to achieve or have regularly available.
We use the UK standard industrial classification 2007 (UKSIC07) and generally sample at the two- and three-digit level. Annex 1 shows some of the new industrial detail that we can potentially measure – at a lower level of detail. It also demonstrates that we can consider activity by business size with increased confidence.
The data in Annex 1 reflect early results and are subject to change based on further detailed analysis and methodological changes. These are provided to help demonstrate the potential future uses of this data source within the production of economic statistics:
full quality assurance has not been completed, so there has not been any comparison with other sources of data, and there are periods where closer analysis of the returns may lead us to identify additional issues such as misreporting by businesses
VAT turnover data are commonly at a higher level than surveys in part due to issues surrounding distribution of turnover for more complicated businesses
industrial classification will be closely monitored and reviewed, particularly due to the historically low level of sampling of these industries and this may impact the quality of estimates with a low level of business activity where more accurate classifications could have a significant impact
For the analysis in this article, we have also included VAT turnover data for larger businesses where appropriate. This is not necessarily part of our future model for VAT turnover data usage in producing our estimates. We have yet to finalise our processes on how we will publish data combined from both survey and administrative data sources as nominal outputs.
In addition, the data are shown at current prices and it is not seasonally adjusted so some caution is required in analysing the results.
Alcohol
Figure 2 shows the growth in distilling of spirits and the comparatively stronger performance for smaller businesses in recent periods, which may be attributed to craft distilleries.
Figure 2: Non-Seasonally Adjusted indexed turnover data: Distilling of Spirits
Source: HM Revenue and Customs
Download this chart Figure 2: Non-Seasonally Adjusted indexed turnover data: Distilling of Spirits
Image .csv .xlsFigure 3 details the manufacture of beer that similarly has stronger growth for smaller businesses though to a lesser extent than distilling. A similar seasonality appears to be evident.
Figure 3: Non-Seasonally Adjusted indexed turnover data: Manufacture of Beer
Source: HM Revenue and Customs
Download this chart Figure 3: Non-Seasonally Adjusted indexed turnover data: Manufacture of Beer
Image .csv .xlsFilm industry
Figure 4 shows low-level detail surrounding the film industry, which has displayed strong growth in recent years. This is evident in the growth of film production (industry 59.111) at the five-digit level of UK SIC07 and is probably a contributory factor to growth in post-production (industry 59.12) at the four-digit level in 2015 and 2016. The expansion of film distribution activities (industry 59.131), again at the five-digit level, through confirmed new activity since 2015, is also evident with its erratic nature attributed to the release of global films.
Figure 4: Non-Seasonally Adjusted Turnover: Film industry
Source: HM Revenue and Customs
Download this chart Figure 4: Non-Seasonally Adjusted Turnover: Film industry
Image .csv .xlsThese industries are dominated by large global corporations that may be impacted by a complex relationship between VAT units and reporting units, so caution should be used.
Challenges
Although significant progress has been made, some methodological challenges remain. When an enterprise consists of more than one reporting unit the VAT turnover must be apportioned to each reporting unit. We currently use the proportion of registered employment of each unit to apportion or distribute the turnover. However, this assumes a direct relationship between VAT turnover and employment that is not appropriate for all industries.
VAT turnover data are primarily quarterly in profile while short-term indicators require monthly data. Methods, referred to as calenderisation, have been developed to use seasonal and trading day data from short-term indicator surveys.
In a survey, where fluctuations or changes in data occur with smaller-sized businesses, a dialogue can be formed to obtain respondent feedback. However, contact with smaller businesses will no longer be possible due to the changes from survey to VAT data. Although the level of cleaning is small, an improvement in automated cleaning of returns would manage this issue, while also overcoming the need for occasional human intervention in the VAT turnover data cleaning process.
Back to table of contents6. Beyond short-term indicators
In addition to Value Added Tax (VAT) turnover use in short-term indicators, we have also embarked on realising the potential of VAT turnover and expenditure data in two areas that may positively impact the quality and detail available of economic statistics.
Improving regional data
In December 2017, we published Balanced Regional Gross Value Added (GVA(B)) at level 1 and level 2 of the Nomenclature of Units for Territorial Statistics (NUTS), or NUTS1 and NUTS2, for the first time. This was achieved by using VAT turnover data to accelerate the production based measure of GVA, which was previously produced with a two-year lag due to the unavailability of survey data.
In December 2018, we will extend our publication of GVA(B) to include nominal and real estimates for NUTS3 areas and local authorities at a detailed industry level. The fine industry detail in the VAT data will allow us to do this.
In the future, we intend to use both VAT turnover and expenditure data to produce GVA(B) for "flexible geographies". This will use the detail of the VAT data to calculate GVA(B) for extremely small levels of geography which can then be built up into any area required by the user.
Improving intermediate consumption
The monthly dataset available from HM Revenue and Customs (HMRC) to ONS includes data for VAT expenditure in addition to VAT turnover. Feasibility work is underway to explore how these data could be used as a proxy for purchases or intermediate consumption, although it is accepted that there are significant conceptual challenges to overcome.
If successful this could deliver a sub-annual supply of intermediate consumption to national accounts to potentially aid the balancing process. This could also be used to improve the supply of regional intermediate consumption in the production approach to GDP, improving the conceptual quality of the estimates.
Back to table of contents7. Next steps
We will publish articles on the progress, including methodology and statistical tools, at key points in the development of the strategic model.
An article on regional short-term indicators will similarly update users on progress in 2019.
Back to table of contents