Table of contents
- Abstract
- Main messages from this article
- Introduction
- Understanding the size and composition of the UK sector balance sheets
- The importance of a detailed instrument breakdown
- Flow of funds experimental counterparty statistics
- Visualising flow of funds statistics
- Assessing sectoral interconnectedness from the interactive diagrams
- Improved international comparisons: A case study with the Euro Area and Austria
- Conclusion
- Authors
- Background notes
- References
- Annex 1
- Annex 2
- Further Information
1. Abstract
The recent financial crisis re-emphasised the importance of monitoring the build-up of financial risks in the economy. Since then, there have been renewed calls for identifying balance sheet exposures between different institutional sectors.
Building on recently published flow of funds experimental statistics by Office for National Statistics, in partnership with the Bank of England, this article takes a further step in exploring sectoral interconnectedness within the UK economy and analyses these lender-borrower relationships in the context of risk exposures. Using data visualisation techniques, we illustrate how financial counterparty relationships have changed over time and infer what this tells us about the transmission of financial risks.
Back to table of contents2. Main messages from this article
Assessing sector-to-sector interconnectedness and the composition of balance sheet positions reveals potential vulnerabilities that cannot be observed from headline aggregates alone. It is therefore important to use flow of funds experimental statistics to inform our understanding of the build-up of financial risks and how these risks spread through the economy.
For the first time, ONS illustrates recently published sector-to-sector counterparty matrices for the financial account using interactive diagrams, Sankey diagram 1 and Sankey diagram 2. Amongst other trends, these show a large exposure of the UK banking sector to the Rest of the World, an emerging prominence of non-bank financial institutions trading in financial derivatives, and an increased exposure of Private Non-Financial Corporation’s liabilities to foreign markets.
ONS are continuing to work with key stakeholders to improve the coverage, quality and granularity of flow of funds experimental statistics. These improvements will better facilitate analysis of the potential transmission of financial shocks.
Back to table of contents3. Introduction
Following the global financial market shock in 2008 and the resulting global economic downturn, policymakers questioned the impact of expanding UK balance sheets on financial stability. In particular, the recent growth in financial corporation’s balance sheets highlighted concern about the distribution of assets and liabilities across sectors and what this means for the UK economy.
Official statistics should play an important role in helping policymakers assess these financial stability risks. Since December 2014, Office for National Statistics and the Bank of England have been working in partnership to improve flow of funds statistics for the UK, building on existing statistics that ONS already publish in the United Kingdom Economic Accounts (UKEA).
This project was initiated as statistics published in the UKEA, which show the aggregate level of assets and liabilities across sectors, do not currently provide sufficient detail for assessing financial risks. By using recently published flow of funds experimental statistics, this article illustrates how sectors are linked to one another through borrowing and lending and whether these sector-to-sector counterparty relationships (referred to as “interconnectedness”) have changed since the global financial crisis (Sections 6 and 7). Notably, this analysis highlights the exposure of UK Monetary Financial Institutions (MFIs) to the Rest of the World (RoW), as well as a recent expansion in the size of the Other Financial Institutions (OFIs) sector.
Building on this, we examine sector-to-sector counterparty relationships by financial instrument, illustrating this interconnectedness using new interactive diagrams (Section 8). Not only does this emphasise the importance of monitoring the composition of each sector’s asset and liability positions, but it also reveals the extent to which one sector’s liabilities are spread across the UK economy and the RoW sector. In particular, our analysis shows that UK bank assets which have a RoW counterparty are concentrated in deposits and financial derivatives and that Private Non-Financial Corporation’s (PNFC) exposure to the RoW sector through issued equity (as a PNFC liability) has grown in recent years.
We also compare these experimental statistics against Euro Area aggregate statistics from the European Central Bank, as well as against the only Euro Area country to currently publish their underlying counterparty statistics – Austria (Section 9).
While ONS existing datasets and recent experimental statistics can help draw insights into the financial system, improved granularity of sectors and instruments are needed to further assist financial stability policy, as set out by Burrows, Low and Cumming (2015). ONS are continuing to work with key stakeholders to improve the coverage, quality and granularity of flow of funds statistics. Further information can be found on the ONS website.
Back to table of contents4. Understanding the size and composition of the UK sector balance sheets
A natural starting point to understanding the UK financial system and its counterparties is to assess each sector’s size. To some extent, existing statistics already published by Office for National Statistics can help to monitor this by showing trend movements in the wealth and indebtedness of institutional sectors1. For example, the UKEA can be used to examine stock-flow relationships, with changes in flows (such as income, spending and saving) equating to the acquisition of both assets and liabilities (stocks) that could be considered a reasonable proxy for a sector’s “size”.
According to current international convention, the UKEA groups the economy into a number of institutional sectors, split by type of activity, ownership and control. This sectorisation provides a wealth of information on the UK’s economic performance and financial balance sheet positions relative to other countries. A further explanation of the headline sectors, instruments and other concepts pertinent to the financial accounts can be found in the Annexes.
In a similar style to company accounting, the ONS financial balance sheet in the UKEA sets out the total level and composition of assets (the amount that a sector owns) as well as liabilities (the amount that an entity owes to other domestic sectors, the Rest of the World, or others in its own sector).
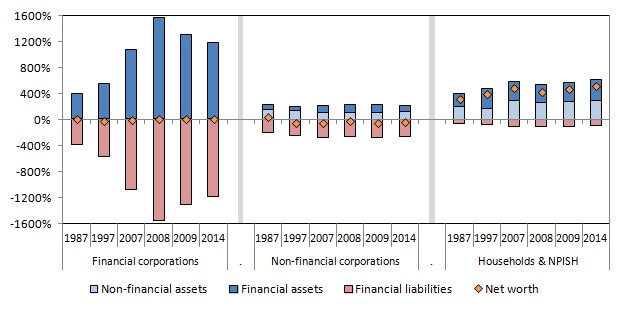
Figure 1 shows the total value of financial liabilities in the household, financial and non-financial corporate sectors in the UK, represented as a proportion of whole economy nominal Gross Domestic Product (GDP). On this measure, the UK “non-government” sector was shown to have built up a large amount of debt, at a rate that far surpassed economic growth, throughout the 1980s and 1990s, but especially just preceding the financial crisis (2003-2008). In addition, the rate at which this occurred was generally accepted to have been faster than most other economies (McKinsey Global Institute, 2015).
Figure 1 also highlights that most of the build-up came from the financial corporation sector, where debt rose from 383% of GDP in Q4 1987 to 1552% in Q4 2008. The rise in household debt was also sustained, but at a slower rate (from 62% of GDP in Q4 1987 to 106% in Q4 2008). In contrast, the Private Non-Financial Corporations (PNFC) sector has not shown a marked rise in liabilities as a proportion of GDP for over 20 years (liabilities rose to 304% of GDP in Q3 2000, but fell slightly and then remained under 300% for subsequent periods).
Figure 1: Non-government sector financial liabilities, % nominal GDP, 1987-2015
Source: Office for National Statistics
Download this chart Figure 1: Non-government sector financial liabilities, % nominal GDP, 1987-2015
Image .csv .xlsWhile the build-up of financial corporation debt appears to be a large change, Figure 2 shows that the level of financial assets held by this sector also rose at roughly the same pace. This meant that net worth (the total value of financial and non-financial assets less financial liabilities) has been broadly equal to zero, and stable, over the last 30 years for the corporate sectors. Therefore, although the size of the financial sector balance sheet has rapidly increased, concentrating on this measure alone fails to clearly identify whether the financial sector has become more vulnerable to particular shocks (e.g. the impact a sharp increase in interest rates would have on broad solvency metrics).
Figure 2 also highlights that the balance sheet is not just comprised of financial assets and liabilities; for example Non-Financial Corporations also hold non-financial assets (e.g. in machinery and buildings). Households are shown to have experienced a rise in financial assets along with a rise in the value of non-financial assets (primarily in dwellings) to help Households achieve an increasing net worth position, from 320% nominal GDP in 1987 to 520% in 2014.
Figure 2 - UK financial and non-financial assets and liabilities, % nominal GDP
UK
Source: Office for National Statistics
Notes:
- NPISH = Non-Profit Institutions Serving Households
Download this image Figure 2 - UK financial and non-financial assets and liabilities, % nominal GDP
.png (14.3 kB) .xlsx (11.3 kB)
Thomas and Nolan (2016) recently presented reconstructed historical financial balance sheet statistics, which show that this trend began earlier than the 1980s (ONS financial account statistics consistent with current international guidelines are only available from 1987). These historical statistics show that most sectors were expanding the size of their balance sheets, on both the asset and liability sides, at a faster rate than economic growth between the 1950s to the 1970s2 . For example, data tables from Roe (1971) show that “financial institution[s]” liabilities grew on average by 9.7% per annum between 1958 and 1966. However, the more recent expansion of the balance sheet has clearly been faster and more prevalent in the financial sector. This covers the period in which the UK financial sector was liberalised following reforms in the 1970s and 1980s.
A large financial system relative to national income levels is not unique to the UK. Figure 3 shows the level of financial assets and liabilities incurred by the non-government sectors across a range of major economies, divided into subsectors. In all instances, the Financial Corporation sector is shown to be substantially larger than the Household and Non-Financial Corporation sectors. However net financial worth has remained at, or around, zero for most countries.
Across most countries and time periods, this equilibrium has been preserved. But in the period before the 2008 financial market shock, some fault lines could be observed in a small number of countries. An example of relative sector fragility was shown by Iceland, which experienced radical change in MFI financial assets, liabilities and net worth during the financial crisis in 2008. This had wide reaching impacts on other sectors, primarily the Icelandic government sector, but also on the real economy3 and other countries.
Figure 3 - Financial assets and liabilities, % nominal GDP, 2013
UK

Source: Office for National Statistics
Notes:
- NPISH = Non-Profit Institutions Serving Households
Download this image Figure 3 - Financial assets and liabilities, % nominal GDP, 2013
.png (18.2 kB) .xlsx (12.3 kB)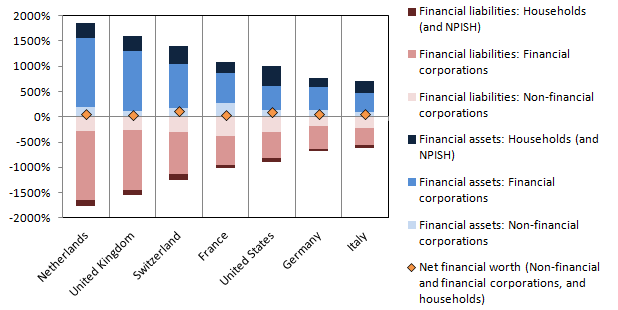
Figure 4 shows that in 2003, the level of financial assets and liabilities held by Icelandic banks (other than the Central Bank) stood at 169% and 170% of GDP respectively, resulting in a net worth position of just -1% of nominal GDP for the sector. In the years running up to the banking crisis, the level of financial assets and liabilities rose, the latter rising marginally faster each year. The intensity of this rise on both sides of the balance sheet was stark; just four years later in 2007, financial assets and liabilities stood at 634% and 753% of GDP, with a net worth position of -119% of GDP. Subsequent events are well understood; by the middle of 2008, three Icelandic banks were effectively declared insolvent, requiring emergency assistance from the Icelandic government and the International Monetary Fund (IMF).
The position gradually moved back toward a more stable equilibrium, where the spread between the total value of assets and liabilities (net worth) stood at 3% of Icelandic GDP in 2014.
Figure 4 - Icelandic financial assets, financial liabilities & financial net wealth, MFI sector excluding central bank (%nominal GDP, 2003 to 2014)
UK
Source: Office for National Statistics
Download this chart Figure 4 - Icelandic financial assets, financial liabilities & financial net wealth, MFI sector excluding central bank (%nominal GDP, 2003 to 2014)
Image .csv .xlsNotes:
For a description of what institutional sectors are and the different classifications, please refer to Annex 1.
ONS regularly updates the financial accounts time series from 1987, but does not update earlier estimates. There are therefore some methodological and classification differences between the reconstructed historical financial accounts produced by Thomas and Nolan (2016) and the current financial accounts published by the ONS. Nonetheless, both series highlight the same themes.
The real economy is the part of the economy that produces non-financial goods and services, rather than the part that consists of financial services, such as banks and stock markets.
5. The importance of a detailed instrument breakdown
In a recent article, Bush, Knott and Peacock (2014) state “it is plausible that the UK banking system will continue to grow rapidly”. They conclude that the size of the banking system influences financial stability in several ways. For example, a large financial system relative to GDP is more likely to have higher level of credit and market risk than a smaller financial system, a large financial system tends to be more connected to other sectors (accelerating the transmission of shocks through an economy) and a large financial system can carry higher implicit fiscal costs vis-à-vis government bailouts.
However, they also contend that the composition of assets and liabilities is important for financial stability. For example, liabilities held in equity tend to be spread across a wider distribution of sectors than liabilities held in debt (further illustrated in Figure 7). Exposure to different sectors is equally important; the risks associated with lending to households are different to the risks associated with lending to banks because of the type of financial instruments they hold (both on the asset and liability sides of the balance sheet). For example, a sector which has borrowed in foreign currency to finance the acquisition of assets denominated in domestic currency is vulnerable to a sudden depreciation in the exchange rate. Not only could this trigger losses in the sector, but these losses could also materialise in other sectors, transmitted through, and accelerated by, sectoral interconnectedness.
Figure 5 - Composition of financial assets and liabilities across the headline sectors, 2014
Source: Office for National Statistics
Notes:
- (a) NFC = Non-Financial Corporations; FC = Financial Corporations; GG = General Government; HH = Households; NPISH = Non-Profit Institutions Serving Households
Download this image Figure 5 - Composition of financial assets and liabilities across the headline sectors, 2014
.png (30.1 kB) .xlsx (10.7 kB)
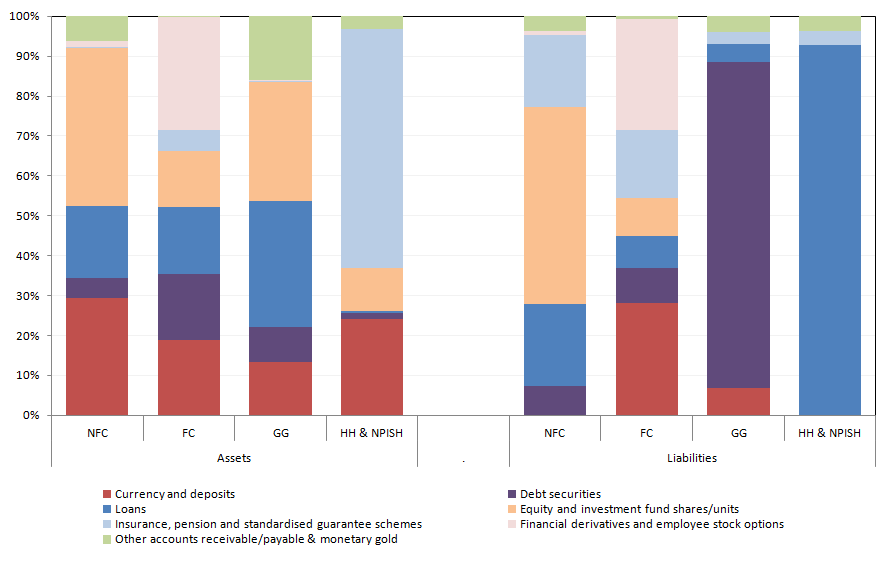
Figure 5 illustrates the instrument composition of financial assets and liabilities for the headline sectors of the economy in 2014, represented as a percentage of total assets and liabilities. To a large extent, these charts confirm the type of activities and sources of finance one would expect to see for each sector. For example, the Central Government sector is shown to hold most of its liabilities in “debt securities”. This reflects the fact that governments tend to raise funds through issuing government bonds. In contrast, the Households and Non-Profit Institutions Serving Households (NPISH) sector acquire most of their liabilities in loans; of the £1,688 billion of total Household liabilities, over 90% came from loans. This can largely be attributed to mortgage debt incurred as a consequence of residential dwelling purchases.
On the financial asset side, the Household and NPISH sectors hold the majority (60%) of their assets in “insurance, pension and standardised guarantee schemes” (which can be attributed to pensions and insurance products owned by Households), but also hold some “currency”, “deposits” and “equity and investment fund shares/units”. The latter is often associated with market risk; those associated with, or arising from, fluctuations in the price of the underlying assets.
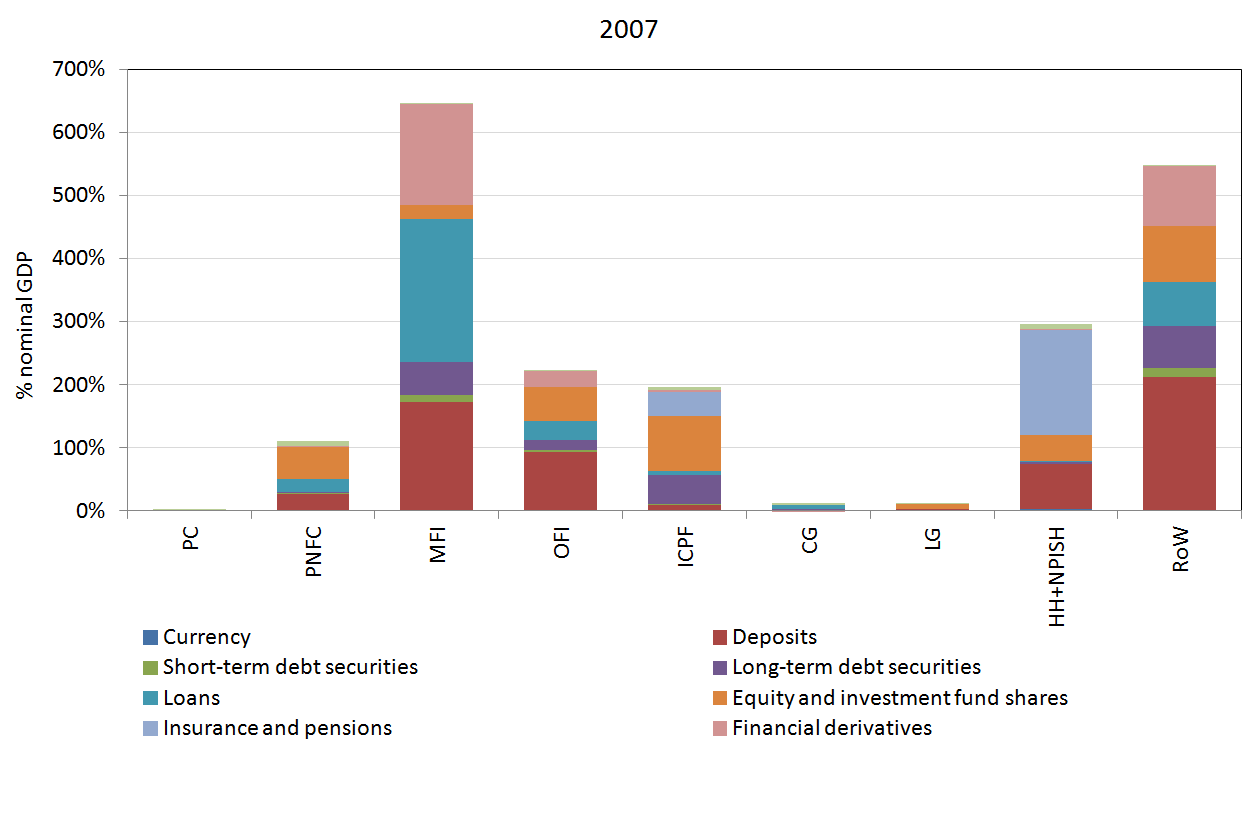
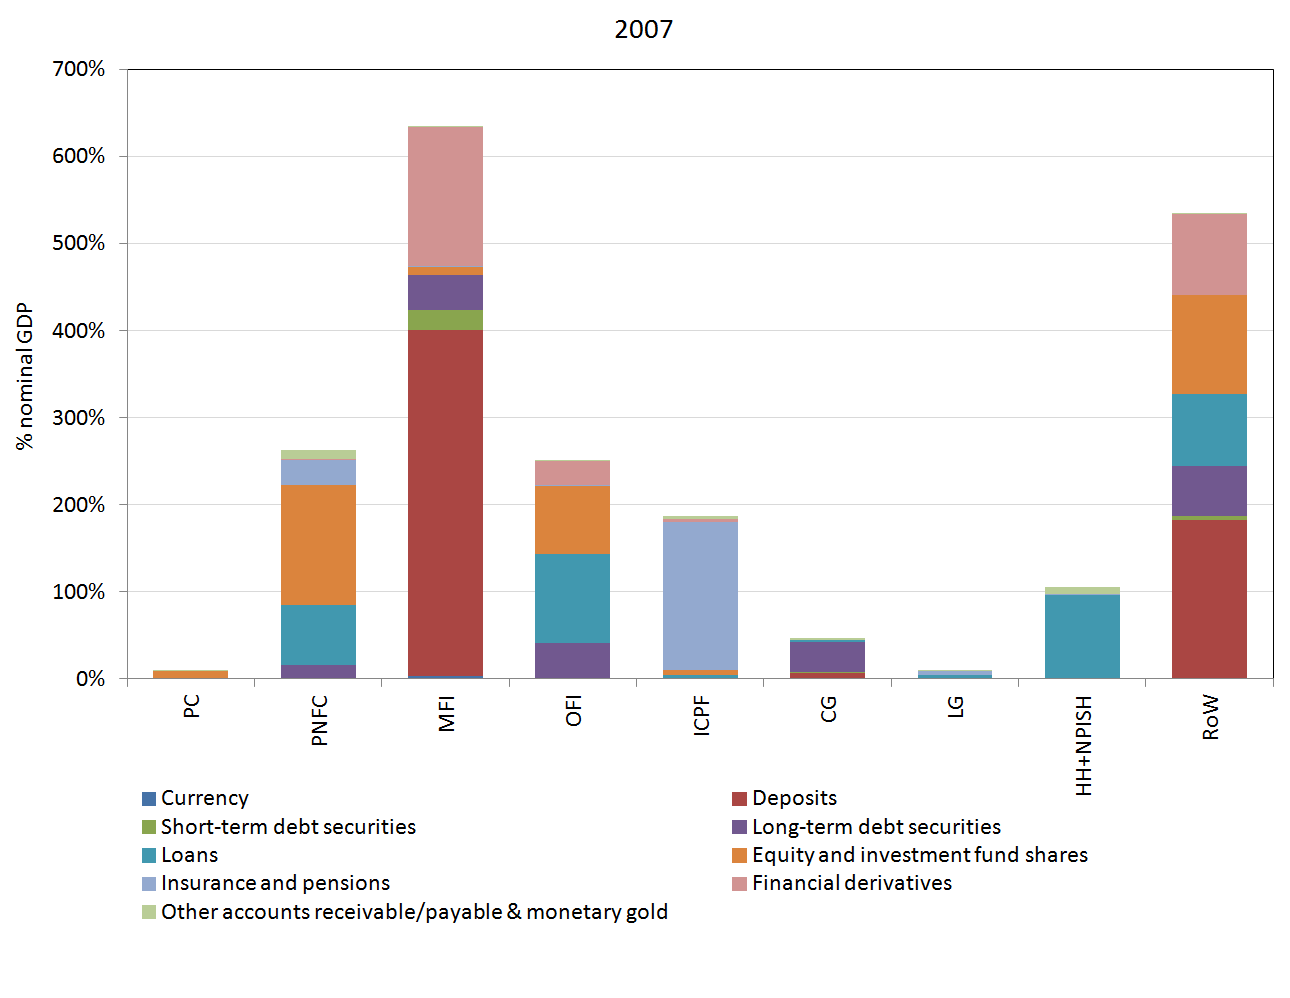
To provide more granular detail, Figures 6 and 7 show financial asset and liability breakdowns across all sectors of the economy for 2007 and 2014. These years have been chosen because they highlight structural changes in the economy which have emerged since the global financial crisis. In particular, the more detailed charts emphasise the emergence of the Other Financial Institutions (OFI) sector (which includes all Financial Corporations except MFIs and Insurance Corporations and Pension Funds (ICPF)), of which the balance sheet has nearly doubled in levels terms in the last 7 years.
The expansion in the OFI sector may reflect a recent increase in the number of holding companies (often brass-plate organisations that hold shares in more active subsidiaries) and “special purpose vehicles” (SPVs). The emerging use of SPV structures to facilitate securitisation, financing and risk sharing, among other things, can be traced back to the early 1980s Gosrani and Gray, 2011. The rise in OFIs may also allude to bank restructuring in the aftermath of the financial crisis, with many banks separating their retail and investment arms, increasing the number of corporations classified to the OFI sector.
There has also been an expansion in both the holding (asset) and issuance (liability) of financial derivatives by both MFIs and OFIs, a trend that was also observed in earlier years. Similar growth can be seen in the market for debt securities, which has seen a shift away from short-term debt towards long-term debt. Long-term debt securities are often associated with government bonds, comprising the majority (86%) of central government liability in 2014, while short-term debt securities tend to be associated with corporate bonds. However, as Figure 7 illustrates, the corporate sectors also issue sizable amount of long-term debt, increasing between 2007 and 2014.
This shift could be explained by other offsetting factors, such as investors turning to safer securities in response to the downturn (as well as commodities such as gold). Holdings of safer securities are often associated with ICPFs, which is supported by Figure 6 which illustrates an elevated holding of long-term debt securities compared to short-term debt securities.
Arguably, ICPFs illustrate the most notable difference in distribution (across sectors) of financial assets compared to financial liabilities; where almost all liabilities are concentrated in “insurance, pension and standardised guarantee schemes”, while assets are spread through a range of instruments (a trend which has been observed since the 1980s). However, this is consistent with activity in the sector; for example pension funds typically invest schemes in a broad portfolio of bonds, shares and other instruments, to different extents across the life length of an individual’s scheme. Principally, this is intended to diversify and protect schemes against market volatility.
Figure 6a - Breakdown of financial assets by instrument, % nominal GDP (2007)
UK
Source: Office for National Statistics
Download this image Figure 6a - Breakdown of financial assets by instrument, % nominal GDP (2007)
.png (29.7 kB) .xlsx (21.0 kB)
Figure 6b - Breakdown of financial assets by instrument, % nominal GDP (2014)
UK

Source: Office for National Statistics
Notes:
- PC = Public Corporations; PNFC = Private Non-Financial Corporations; MFI = Monetary Financial Institutions; OFI = financial institutions other than MFIs and Insurance Corporations and Pension Funds; ICPF = Insurance Corporations and Pension Funds; CG = central government; LG = local government; HH+NPISH = Households and Non-Profit Institutions Serving Households; RoW = Rest of the World
- The UKEA currently includes statistics on OFI liabilities in the form of “currency and deposits”, which have been merged into “deposits” for the purposes of Figure 6. In theory, OFIs cannot accept deposits or currency as a liability. However, these statistics are residuals left following classification adjustments.
Download this image Figure 6b - Breakdown of financial assets by instrument, % nominal GDP (2014)
.png (33.5 kB) .xlsx (21.0 kB)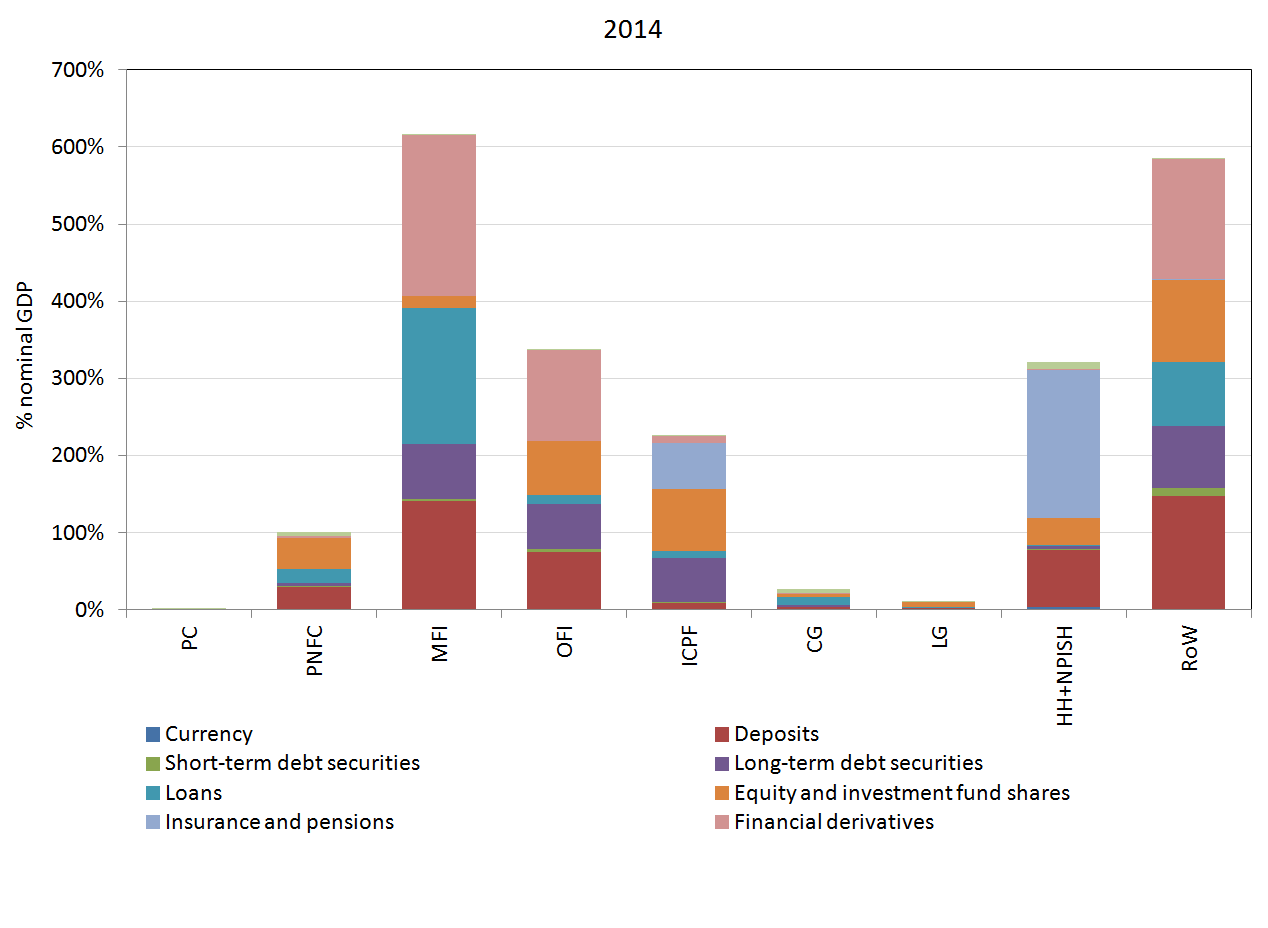
Figure 7a - Breakdown of financial liabilities by instrument, % nominal GDP (2007)
UK
Source: Office for National Statistics
Download this image Figure 7a - Breakdown of financial liabilities by instrument, % nominal GDP (2007)
.png (36.9 kB) .xlsx (19.2 kB)
Figure 7b - Breakdown of financial liabilities by instrument, % nominal GDP (2014)
UK

Source: Office for National Statistics
Notes:
- Private Non-Financial Corporations; MFI = Monetary Financial Institutions; OFI = financial institutions other than MFIs and Insurance Corporations and Pension Funds; ICPF = Insurance Corporations and Pension Funds; CG = central government; LG = local government; HH+NPISH = Households and Non-Profit Institutions Serving Households; RoW = Rest of the World
- The UKEA currently includes statistics on OFI liabilities in the form of “currency and deposits”, which have been merged into “deposits” for the purposes of Figure 6. In theory, OFIs cannot accept deposits or currency as a liability. However, these statistics are residuals left following classification adjustments.
Download this image Figure 7b - Breakdown of financial liabilities by instrument, % nominal GDP (2014)
.png (39.9 kB) .xlsx (19.2 kB)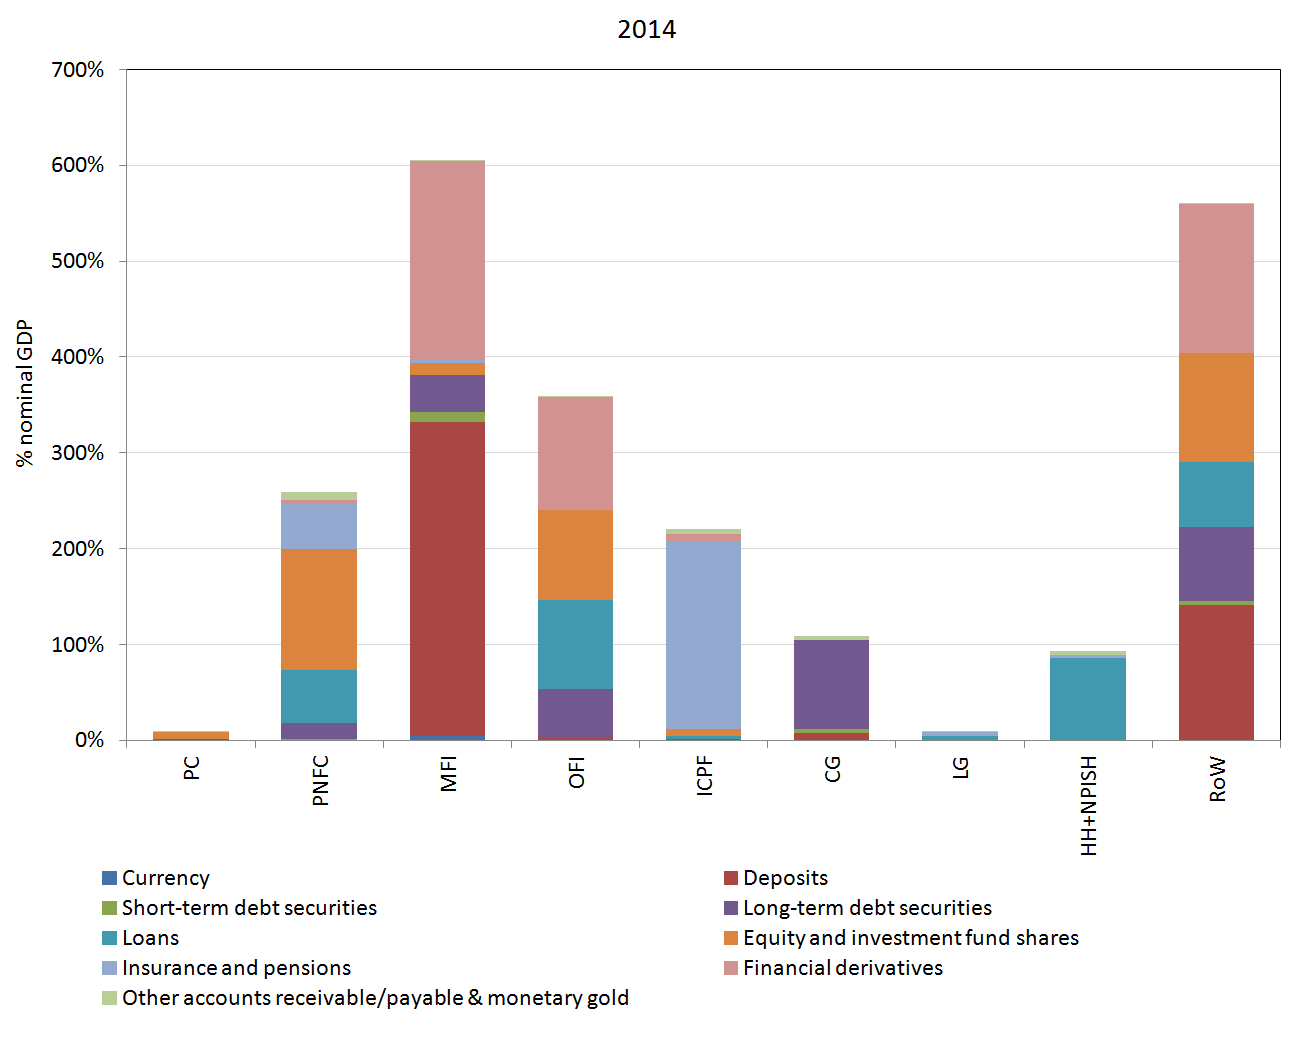
6. Flow of funds experimental counterparty statistics
The term flow of funds is used in several different ways and can often be used to describe the financial account in general. However, in the context of the Office for National Statistics - Bank of England UK Flow of Funds Project, the term is used to refer to the development of from-whom-to-whom statistics for both financial transactions and balance sheets levels. As Bowers and Foster (2015 explain, these experimental statistics provide counterparty information for financial assets and liabilities, thereby highlighting interconnections between different institutional sectors within the economy.
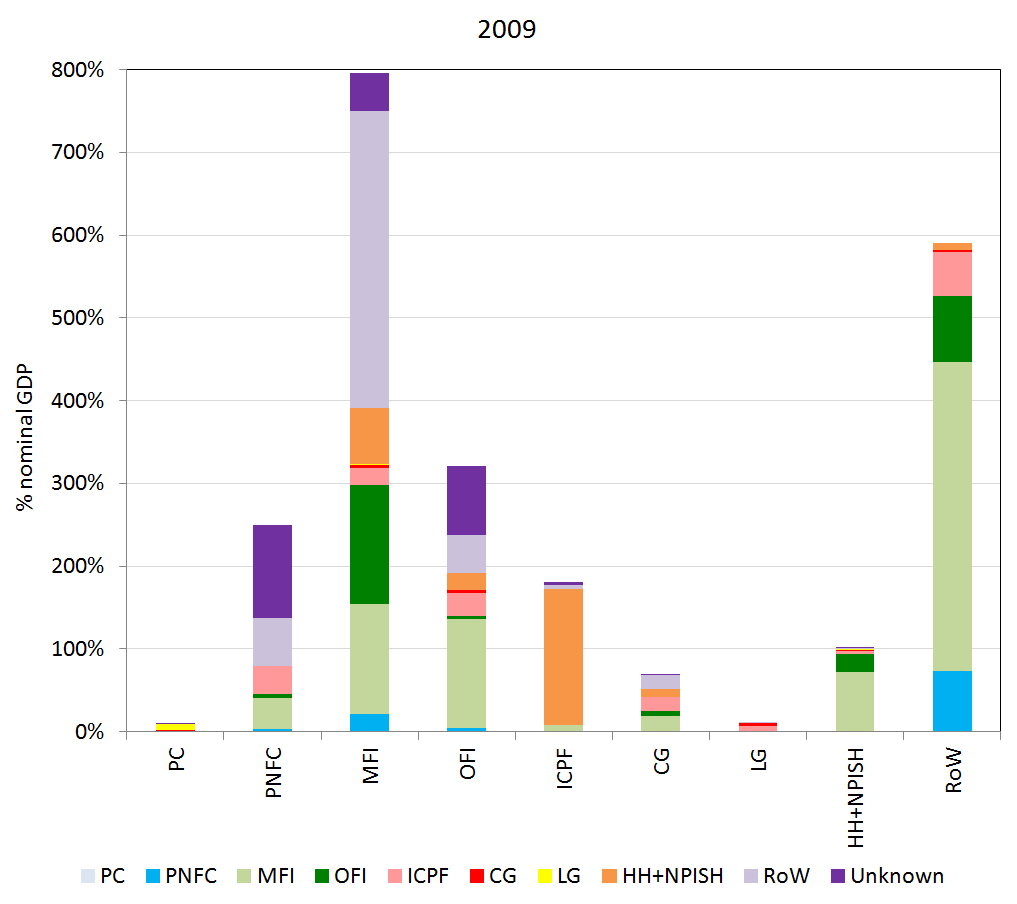
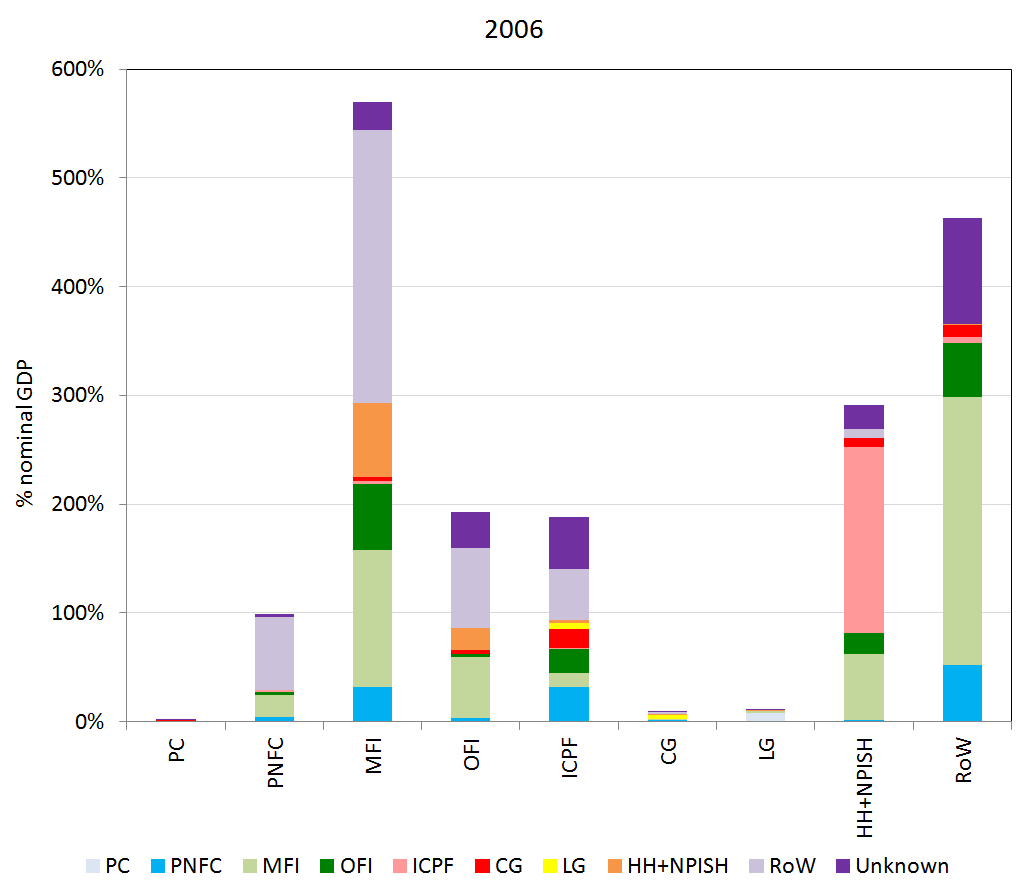
Figure 8 represents the counterparty relationships (on the asset side) for each sector’s financial liabilities, presented as a percentage of nominal GDP. By contrast, the corresponding counterparty relationships (on the liability side) for each sector’s financial assets are represented in Figure 9. These charts illustrate changes in counterparty relationships across 2006, 2009 and 2014; a period in which the UK economy fluctuated between relative prosperity, a recession and a recovery. The sources and methods behind the experimental statistics were outlined in a recent publication by Adams, Bowers and Foster (2015), which also identified areas for future work. It is important to highlight two points; firstly, that counterparty information for all financial instruments is only published from 2006 onwards; and secondly, that these statistics contain an “unknown counterpart” for some sectoral assets and liabilities. These gaps represent areas where there is no known counterparty information.
Across all the charts, the interconnectivity between UK Financial Corporations and the RoW sector is clear. The Rest of the World (RoW) sector was the counterparty (on the asset side) to 44% and 33% of total Monetary Financial Institutions (MFI) and Other Financial Institutions (OFI) liabilities in 2014 respectively (where MFI and OFI total financial liabilities include the “unknown” counterparty statistics). Although MFI counterparty exposure to foreign markets (as a RoW asset) remained stable between 2006 and 2014, there was a large increase in the RoW acting as the counterparty to OFI assets, more than tripling between 2009 and 2014.
This partly reflects expansion in balance sheet levels for OFIs, but also deeper financial integration in the type of instruments held. As the earlier charts illustrated, financial derivatives held as assets by the OFI sector increased more than fourfold between 2009 and 2014. Financial derivatives include options, futures/forwards and swaps, which tend to be traded on global markets and are linked to an underlying financial instrument, indicator or commodity.
As Liu, Quiet and Roth (2015) note, global financial interconnectedness has both pros and cons. On the one hand, it enables domestic sectors to access funds from, and transfer risks to, foreign markets; but on the other hand, it highlights how easily cross-border risks can cascade through the economy. A potential geographical risk was recently highlighted in the Financial Stability Report (December 2015), which stated:
“The UK financial system has substantial exposures to emerging market economies, reflecting the large build-up in private sector debt in many of these countries in recent years”.
In contrast to Financial Corporations, UK Households hold very few assets overseas and the level has fallen over the period (2006-2014). Historically, retail banking transactions (e.g. applying for new accounts and transferring deposits between accounts) have been conducted in local bank branches, making it difficult for Households to open, and subsequently deposit assets in, foreign bank accounts. However, recent technological innovations such as online banking, contactless payments and the prevalence of cash machines could make investing savings in overseas banks more convenient, reducing the geographical barriers. The fact that this has not materialised, however, may be attributable to the relative resilience of overseas institutions and government-backed deposit guarantee schemes (for example, UK resident’s deposits were not protected during the Icelandic banking crisis).
Figure 8a - Breakdown of financial liabilities by counterparty sector, % nominal GDP (2006)
UK

Source: Office for National Statistics
Download this image Figure 8a - Breakdown of financial liabilities by counterparty sector, % nominal GDP (2006)
.png (29.7 kB) .xlsx (14.6 kB)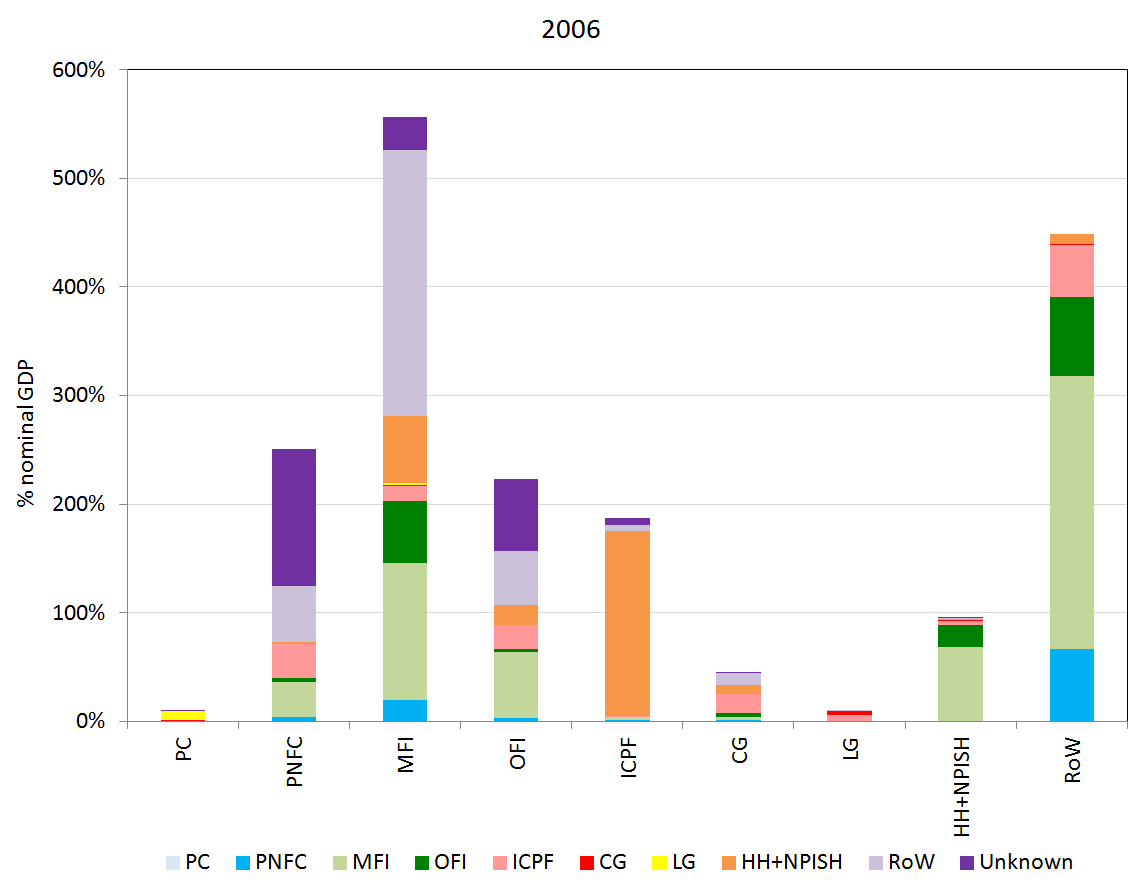
Figure 8b - Breakdown of financial liabilities by counterparty sector, % nominal GDP (2009)
UK
Source: Office for National Statistics
Download this image Figure 8b - Breakdown of financial liabilities by counterparty sector, % nominal GDP (2009)
.png (29.8 kB) .xlsx (14.6 kB)
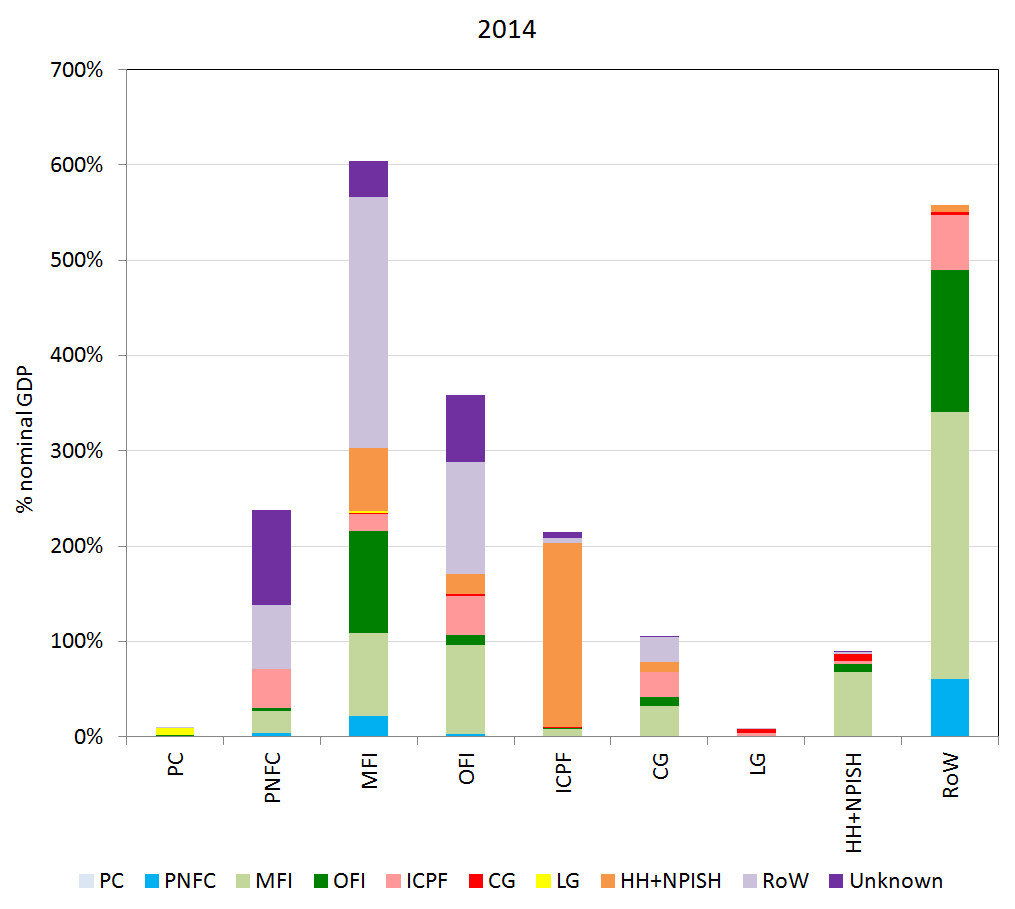
Figure 8c - Breakdown of financial liabilities by counterparty sector, % nominal GDP (2014)
UK
Source: Office for National Statistics
Notes:
- PC = Public Corporations; PNFC = Private Non-Financial Corporations; MFI = Monetary Financial Institutions; OFI = Financial Institutions Other than MFIs and Insurance Corporations and Pension Funds; ICPF = Insurance Corporations and Pension Funds; CG = Central Government; LG = Local Government; HH+NPISH = Households and Non-Profit Institutions Serving Households; RoW = Rest of the World; unknown = the unknown sector represents series in the experimental statistics where there is currently no known counterparty information and no assumptions have been made.
Download this image Figure 8c - Breakdown of financial liabilities by counterparty sector, % nominal GDP (2014)
.png (30.0 kB) .xlsx (14.6 kB)
Figure 9a - Breakdown of financial assets by counterparty sector, % nominal GDP (2006)
UK
Source: Office for National Statistics
Download this image Figure 9a - Breakdown of financial assets by counterparty sector, % nominal GDP (2006)
.png (29.4 kB) .xlsx (15.9 kB)
Figure 9b - Breakdown of financial assets by counterparty sector, % nominal GDP (2009)
UK

Source: Office for National Statistics
Download this image Figure 9b - Breakdown of financial assets by counterparty sector, % nominal GDP (2009)
.png (28.5 kB) .xlsx (15.9 kB)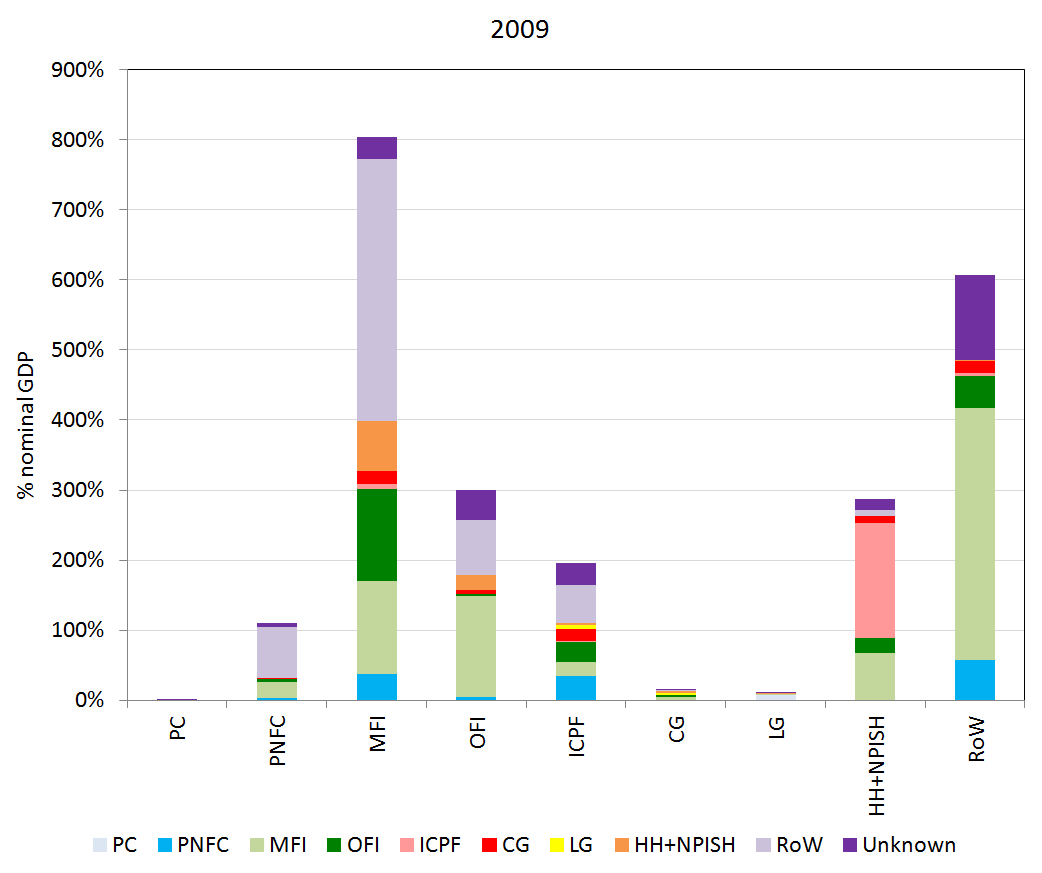
Figure 9c - Breakdown of financial assets by counterparty sector, % nominal GDP (2014)
UK

Source: Office for National Statistics
Notes:
- PC = Public Corporations; PNFC = Private Non-Financial Corporations; MFI = Monetary Financial Institutions; OFI = Financial Institutions Other than MFIs and Insurance Corporations and Pension Funds; ICPF = Insurance Corporations and Pension Funds; CG = Central Government; LG = Local Government; HH+NPISH = Households and Non-Profit Institutions Serving Households; RoW = Rest of the World; unknown = the unknown sector represents series in the experimental statistics where there is currently no known counterparty information and no assumptions have been made.
Download this image Figure 9c - Breakdown of financial assets by counterparty sector, % nominal GDP (2014)
.png (29.6 kB) .xlsx (15.9 kB)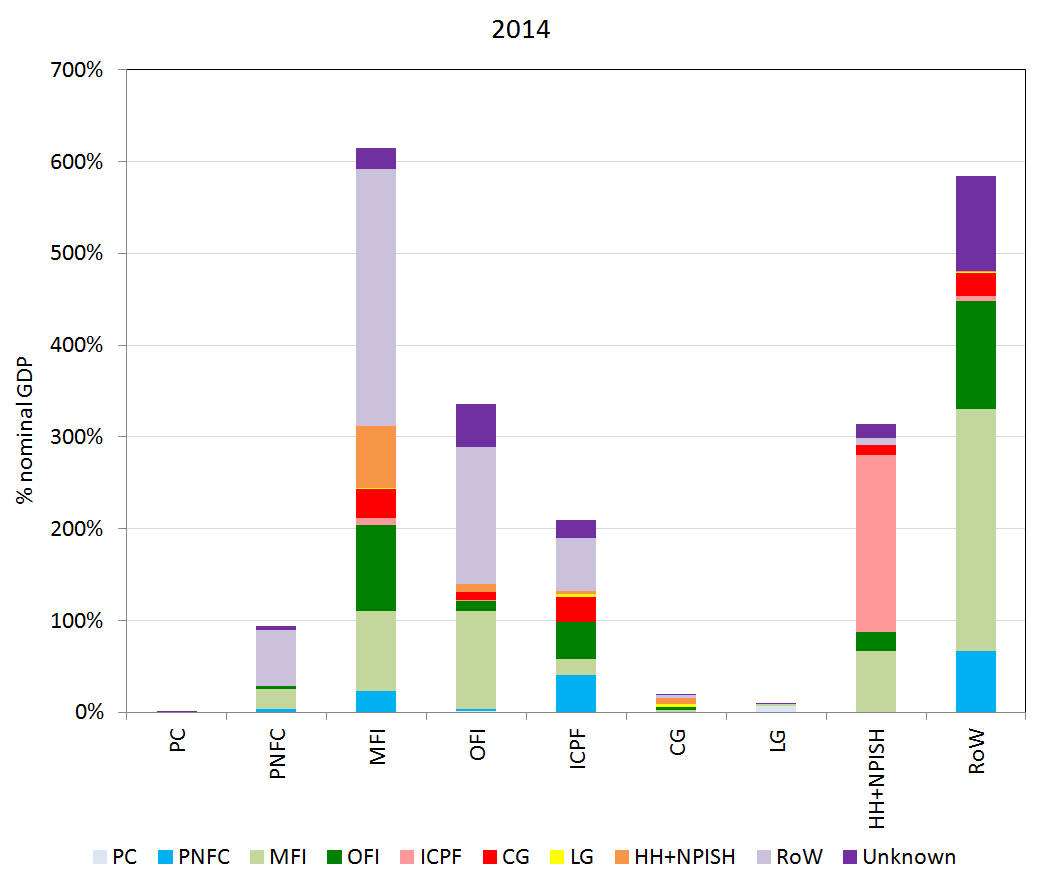
7. Visualising flow of funds statistics
Sector-to-sector counterparty relationships
Building on statistics presented in Figures 8 and 9 in Section 6, it is possible to visualise the counterparty relationships using Sankey diagrams (also referred to as Ribbon diagrams). An interactive version of this Diagram is available and has been replicated for the years 2006 to 2014. For tips on interpreting this Sankey diagram, please refer to interpreting Sankey.
UK Flow of Funds - Sector-to-sector interactions for financial balance sheets
Embed code
Interpreting Sankey Diagram 1
Each sector’s total financial liabilities are represented on the left hand side, where the coloured bars (indicating each sector) represent the relative level of total financial liabilities (for example, Monetary Financial Institutions have more financial liabilities than Households, hence the bar being taller).
The counterparty sectors (on the asset side) are presented in the right hand bars, where the size of the bars reflects the relative level of one sector’s financial assets to another. The “thread” from left hand bar (liability) to right hand bar (asset) reflects the counterparty relationship between each sector. The static diagram is therefore designed to be read from left (liability) to right (asset).
By hovering over each thread on the interactive diagram, it is possible to see the liability levels in the box at the top of the diagram. For example, in Diagram 1, it can be observed that for 2014, the Rest of the World is the counterparty to £4,779 billion of total Monetary Financial Institutions liabilities.
Sector-to-sector counterparty relationships by instrument
Diagram 2 combines both financial instrument and counterparty relationships (i.e. Figures 6 to 9, across both Sections 5 and 6). Not only does this illustrate what instrument each sector holds their financial liabilities in, but it also shows to whom they owe that instrument liability. These more complex Sankey diagrams represent a more comprehensive picture of sectoral interconnectedness. Like the previous diagram, these are represented in level terms. An interactive version of Diagram is available and has been replicated for the years 2006 to 2014.
UK Flow of Funds: Sector-to-sector interactions for financial balance sheets by financial instrument
Embed code
Interpreting Sankey Diagram 2
Similar to Diagram 1, the left hand bars represents each sector (on the financial liability side), the middle bars represents the instruments in which financial liabilities are held, and the right hand bars represent the counterparty sector (on the asset side).
The thread between sector liability (left hand bar) and instrument (centre bar) represents the level of financial liabilities in a specific instrument. The thread between instrument (centre bar) and counterparty sector (right hand bar) represents the holding (in level terms) of a particular financial liability instrument by the counterparty sector (as an asset).
By hovering over each thread on the interactive diagram, it is possible to see the liability/instrument/asset levels in the box at the top of the diagram. For example, in Diagram 2 the turquoise thread between “MFI liability” and “deposits” illustrates the level of MFI liabilities held in deposits, which for 2014 was £5,961 billion. The turquoise highlighted thread between “Deposits” and “MFI asset” illustrates the counterparty level of that deposit liability (as an asset) for other UK MFIs. So, of total MFI deposit liabilities of £5,960 billion, £917 billion is held by other UK MFIs.
Back to table of contents8. Assessing sectoral interconnectedness from the interactive diagrams
The sector-to-sector counterparty information, combined with the granular instrument breakdown (as set out in Diagram 2), provides us with a new way of assessing financial risk across the UK sectors. Not only does this allow us to better assess potential risks arising from instruments (set out in Section 5), but it also highlights the degree of sectoral interconnectedness (Section 6).
This immediately furnishes additional information to trends identified in the earlier sections. For example, Section 6 showed that UK Monetary Financial Institutions (MFIs) are highly interconnected with the Rest of the World (RoW) sector, on both sides of the balance sheet. Diagram 2 now shows that MFI assets which have a RoW counterparty are spread across a range of instruments, but are especially concentrated in deposits and derivatives.
Put simply, relative to the total assets held with a RoW counterparty (as a liability) (£5.1 trillion), UK banks are shown to hold a sizable amount of deposits (as assets) (£1.6 trillion or 31%) in overseas institutions. The composition is similar for RoW assets; of the £4.8 trillion assets that the RoW hold with a UK MFI counterparty liability, £2.7 trillion (56%) is held in deposits in UK banks.
The size of the financial derivative positions between the two sectors (RoW and UK MFI) is also striking, at £1.9 trillion for each sector. However, without further granularity on the type of financial derivative exposures in these cases, it is difficult to assess the direct implications of these large positions. For example, additional granular statistics could uncover a higher proportion of options, futures/forwards and swaps that are linked to an underlying financial instrument, indicator or commodity, which could show whether the sector is relatively more exposed to market, interest rate or other risks.
Other Financial Institutions (OFIs) also interact with the RoW, but in a different manner. For example it is OFIs, and not MFIs, that borrow the majority of loans lent by the RoW sector. Their financing (i.e. issuance) also tends to be more highly concentrated in equity issuance and debt securities, which tend to be held as assets by a broader mix of sectors.
Non-Financial Corporations (both private (PNFC) and public (PC)) are also interdependent with the RoW sector. In Section 5, it was shown that UK NFCs raise a significant amount of finance through equity issuance. Of the £2.3 trillion stock of equity issued by PNFC in 2014 (which accounts for over 50% of the sectors liabilities), over 30% was held by the RoW (where PNFC total financial liabilities includes the “unknown” counterparty statistics). Furthermore, the ONS “Ownership of UK Quoted shares” publication suggests that this trend has been a growing phenomenon, with higher RoW shareholdings offsetting declining proportions of ownership from UK ICPF ICPF and Households. This is unsurprising, given the globalised nature of the stock market and technological innovations, such as electronic trading.
Other parts of Diagram 2 again confirm some of the behaviour and financial activities expected of these sectors. For example, household assets with an ICPF counterparty liability are concentrated in insurance and pension schemes. However, further granularity regarding the split between the schemes (and even splits between different types of fund), along with how these relationships have changed over time would be desirable.
Similarly, the stocks of Household loans are mainly held by MFIs, although there has been a notable shift towards OFIs also holding loan stock. This may be due to the fact that OFIs capture financial leasing (including consumer and motor leasing), credit unions and brokers, which have recently been cited as having gained in popularity (Carn and Tierney, 2015).
Back to table of contents9. Improved international comparisons: A case study with the Euro Area and Austria
Following the 2008 financial market shock, the Financial Stability Board (FSB) provided a set of key recommendations regarding the enhancement of economic and financial statistics, referred to as the G20 Data Gaps Initiative. One set of recommendations called for the improved monitoring of global network connections.
A number of countries have begun to implement changes in response to this, and the compilation and dissemination of whom-to-whom matrices across countries is clearly a key part of adhering to these recommendations. This, combined with improved information and granularity regarding cross border exposures, would ultimately improve the monitoring of geographical risk, and any resultant contagion that could spread to other countries.
For example, the European Central Bank (ECB) produces a set of whom-to-whom flow of funds matrices, in a similar format to that published by ONS. This aggregates whom-to-whom statistics from individual Euro Area economies; but to date, only one Euro Area economy (Austria) publishes their own individual set of matrices. Table 1 illustrates one example of how the new counterparty matrices published by ONS can be compared internationally. Following on from previous sections (those that highlighted sectoral links between domestic banks and the Rest of the World (RoW), it shows the level of assets held by Monetary Financial Institutions (MFIs) in 2014, for which the counterparty (liability side) is the RoW sector.
Table 1 shows that across the instruments shown, UK’s MFI hold a higher level of assets in overseas issued liabilities compared to Austria. However, while the relative size of the exposures are far higher, the relative proportions are not too dissimilar; indeed UK MFIs hold a lower proportion of foreign issued debt-securities relative to Austria. The Euro area accounts show far lower rates of exposure to the RoW, but it is important to note that in this case the RoW sector refers to all non-Euro Area economies. This, paired with the statistics regarding Austria, may signal that the Euro Area banking system is closely connected (i.e. to other Euro Area countries), and is relatively less exposed to non-Euro Area economies.
Table 1: Assets held by MFIs in instruments that are issued by the Rest of the World sector (2014 and 2014 Q1)
| Austria (in EUR million, 2014) | Total MFI assets held in various instruments (2014) | Total RoW liabilities held by MFIs (counterparty asset, 2014) | Relative exposure of MFI balance sheet (asset side) to RoW liabilities, 2014 |
| Deposits | 193,712 | 113,854 | 59% |
| Loans | 430,960 | 94,412 | 22% |
| Debt securities | 162,420 | 88,179 | 54% |
| United Kingdom (£, billions, 2014) | |||
| Deposits | 2,537 | 1,621 | 64% |
| Loans | 3,208 | 935 | 29% |
| Debt securities | 1,341 | 460 | 34% |
| Of which: short-term | 56 | 44 | 78% |
| long-term | 1,286 | 417 | 32% |
| Euro area (EUR, billions, 2014Q1) | Total MFI assets held in various instruments (2014Q1) | Total RoW[1] liabilities held by MFIs (2014Q1) | Relative exposure of MFI balance sheet (asset side) to RoW liabilities, 2014Q1 |
| Deposits | 9,295 | 1,961 | 21% |
| Loans | 12,749 | 963 | 8% |
| Of which: short-term | 2,652 | 596 | 22% |
| long-term | 10,097 | 366 | 3% |
| Table source: Oesterreichische Nationalbank (OENB), European Central Bank (ECB) and ONS experimental statistics (consistent with UKEA 2015 Q2) | |||
| Table notes: | |||
| 1. In the case of the Euro Area accounts, “Rest of the World” is considered to be non-Euro area economies. | |||
Download this table Table 1: Assets held by MFIs in instruments that are issued by the Rest of the World sector (2014 and 2014 Q1)
.xls (28.7 kB)10. Conclusion
In this article we have emphasised the importance of both sectoral interconnectedness and asset and liability composition in the assessment of financial stability. By developing counterparty statistics and using new interactive visualisations, we have identified sector-to-sector counterparty relationships that cannot be observed by focusing on headline assets and liability levels alone. Notably, we have highlighted the exposure of UK Monetary Financial Institutions (MFIs) to the Rest of the World (RoW) sector, especially through deposits and financial derivative instruments. We have also shown how developing counterparty statistics enables better international comparisons, with countries that are considered leaders in the production of Flow of Funds statistics.
ONS is continuing to work in partnership with the Bank of England to improve the coverage, quality and granularity of flow of funds statistics for the UK. This work follows international recommendations and some of the immediate goals are to:
- Improve the breakdown of, and information regarding, the OFIs sector
- Identify new data sources to help fill unknown counterparty data gaps
- Improve underlying data sources
Over the next year, the main focus of the project will be on the further investigation of improvements to the comprehensive review of UK financial accounts and initial work on identifying potential new data sources. ONS and the Bank will continue to review and prioritise these goals, publishing future updates on the ONS web page. We invite feedback on the Flow of Funds Project, and can be contacted by emailing: flowoffundsdevelopment@ons.gov.uk.
Back to table of contentsContact details for this Article
Related publications
- Economic Statistics Transformation Programme: UK flow of funds experimental balance sheet statistics, 1997 to 2015
- Economic Statistics Transformation Programme: Flow of funds - the international context
- Economic Statistics Transformation Programme: Developing the enhanced financial accounts (UK Flow of Funds)
- Economic Statistics Transformation Programme: The UK Flow of Funds Project: Improvements to the Sector and Financial Accounts
- Economic Statistics Transformation Programme: Historical estimates of financial accounts and balance sheets
- Economic Statistics Transformation Programme: The UK Flow of Funds Project - comprehensive review of the UK financial accounts
- Economic Statistics Transformation Programme: The UK Flow of Funds Project: introduction, progress and future work