Table of contents
- Summary
- Improvements to the financial sector in Blue Book 2017
- Main points
- Annex A: Integration of the redeveloped securities dealers’ survey
- Methods
- Annex B: Expansion of financial sub-sector detail: separate identification of non-money market investment funds in the financial account and balance sheet
- Data sources and methods
- References
1. Summary
This article and its annexes explain two of the improvements we are making to the estimates in the financial account: the introduction of the new securities dealers survey and the expansion of financial sub-sector detail.
The quality and comprehensiveness of the data collected in the redeveloped securities dealers’ survey are significantly better than before, in particular the fact that the level of detail now available is consistent with what is required for the UK National Accounts. In order to ensure consistent time series across the old and redeveloped surveys, a number of linking methods have been employed, using as much of the existing data as possible. The estimates in the financial account that include the activities of securities dealers will therefore be significantly improved.
We will be publishing extra detail in the financial account, with separate estimates for the financial sub-sector “non-money market funds” (NMMF) available for the first time. This sub-sector is part of the existing “other financial institutions” (OFI) sub-sector. Non-money market funds are funds that invest in long-term or a mixture of long and short-term financial instruments on behalf of their shareholders or unitholders.
Summary impacts are covered in the separate article Detailed assessment of changes to sector and financial accounts 1997 to 2012.
Back to table of contents2. Improvements to the financial sector in Blue Book 2017
As part of our ambitious plans to transform economic statistics over the coming years, we are introducing significant improvements to the UK financial accounts. We are working in partnership with the Bank of England on a joint ”Flow of Funds” (FoF) initiative, which will lead to the publication of a set of experimental “from whom to whom” accounts in 2019, with the intention of incorporating these statistics into the UK National Accounts in 2021. The estimates will be consistent with the concepts and definitions in the European System of Accounts 2010: ESA 2010, which is the mandatory framework within the European Statistical System.
Before then, we are introducing improvements to the quality, coverage and detail of financial statistics as soon as they are ready. All of this work will help to improve our understanding of the UK’s financial sector and how it has been evolving over time.
A number of these improvements will be introduced in Blue Book 2017, with the data first available in September 2017. Previous articles have set out improvements to the measurement of pensions and to corporate bond interest. This article describes two further enhancements to the UK financial account:
improvements to the measurement of the activities of securities dealers due to the introduction of a redeveloped survey
separate publication of an extra financial sub-sector “non-money market funds” (NMMF), providing new information on funds that invest in long-term or a mixture of long and short-term financial instruments on behalf of their shareholders or unitholders
The impact on the financial account from the introduction of the redeveloped securities dealers survey is limited, in that their overall asset and liabilities levels in the survey have not changed. However, the mix of financial instruments that securities dealers are estimated to hold and trade in, has changed, especially where financial instruments have involved counterparties in the rest of the world. The interest and dividends received on assets held by securities dealers has been revised down, but this is somewhat offset by the interest and dividends paid by securities dealers on their liabilities.
There is no impact on the national accounts from the separate publication of the NMMF sub-sector, as the estimates for this sub-sector have been discerned from the existing, estimates for the parent sub-sector “other financial intermediaries”.
This article provides a high-level summary of the main points to describe each of these enhancements, and its two annexes provide more detail on the technical aspects of the new and improved methods. Neither the article nor its annexes set out the impacts from the changes on national accounts aggregates. The article Detailed assessment of changes to sector and financial accounts 1997 to 2012 sets out indications of these impacts.
Throughout this article and its annexes, a number of terms describing financial instruments are used synonymously. The net difference between acquisitions (of financial instruments) and disposals over a period of time (either a year or a quarter in this paper) is also termed the “flow”. The value of the holding of an asset or liability at a particular point in time can also be referred to as the “balance” or the “level”.
Back to table of contents3. Main points
The main points from the two improvements explained in this article are:
For the introduction of the new securities dealers survey:
- the survey that collects information on the activities of securities dealers has been substantially redeveloped, with improved information collected from Quarter 1 (Jan to Mar) 2015
- the redeveloped survey has been designed to collect the information needed for the latest National Accounts concepts, so as a result, data collected in the redeveloped survey relating to 2015 onwards feed directly into the accounts
- in order to ensure consistent time series across the old and redeveloped surveys, a number of linking methods have been employed, using as much of the existing data as possible
- while the overall levels of assets and liabilities held by securities dealers have not changed, the mix of the different financial instruments has been revised, especially where the counterparty is not based in the UK
For the expansion of financial sub-sector detail:
- from Blue Book 2017, the UK financial account and balance sheet will be presented separately for five groupings of financial institution, with the existing other financial institutions (OFIs) sub-sector being split into two further sub-sectors; non-money market funds (NMMF) and other financial institutions (OFIs) excluding NMMF
- new estimates for the NMMF sub-sector are predominantly based on data from our unit trusts, investment trusts and property unit trusts surveys
- modelling approaches are used to fill gaps within the dataset; specifically for historic periods and flows data (where missing) and for financial instruments for which data are not captured on the trusts surveys mentioned above
- time series for the combined “other financial institutions excluding NMMF” sub-sector are estimated as the difference between the existing published other financial institutions (OFI) sub-sector and the new NMMF sub-sector
- there are no changes to the existing estimates of OFIs because of this work
4. Annex A: Integration of the redeveloped securities dealers’ survey
Background
4.1. What are securities and what are securities dealers?
Securities consist of a range of financial instruments including bills, bonds, certificates of deposit, commercial paper, debentures and shares. Those corporations that specialise in trading in these securities are labeled securities dealers. Such dealers may assist other firms in issuing new securities through the underwriting and market placement of new security issues, or may also trade in new or outstanding securities on their own account.
4.2. The old and redeveloped surveys
The old securities dealers survey collected, and the redeveloped survey continues to collect, information on securities dealers’ assets, liabilities, income and expenditure. This section gives information on the old and redeveloped surveys, pointing out the important differences.
Both surveys collect quarterly information, so that infra-annual changes in activity can be monitored. The old survey used to have both a quarterly questionnaire, which collected mostly flows information, and an annual supplementary questionnaire, which collected information on asset and liability levels as at 31 December. The redeveloped survey has a pair of quarterly questionnaires. The first questionnaire collects information mainly on asset and liability levels, but with some broad information on flows; the second questionnaire collects information on income and expenditure.
The last questionnaires for the old survey were sent out and collected in Quarter 4 (Oct to Dec) 2014, and the first questionnaires for the redeveloped survey were sent out and collected in Quarter 1 (Jan to Mar) 2015. Although it would have been ideal to have some overlap in the surveys with, for example, the old survey questionnaires being sent out in 2015 alongside the redeveloped surveys and the new questionnaires being sent out in 2014 alongside the old surveys, this was decided against at an early stage in the development process. The reasons for this were twofold: (i) sending both questionnaires to some or all respondents was considered too heavy a burden on business; and (ii) as survey respondents needed to change their systems over from one reporting set-up to another, it was considered that either one or the other questionnaire would elicit responses that were appropriate for the wrong questionnaire and the quality of the data would be compromised. This lack of overlap has meant that the key methodological question to be addressed has been how to link the information from two distinct surveys.
Building on the improvements that were introduced in Quarter 1 2015, further improvements, of a much more minor nature, were introduced in Quarter 1 2016. These improvements did not involve changing the survey in any substantial way, but instead the opportunity was taken to acquire further breakdowns – for example distinguishing between sterling and foreign currency for some financial instruments whereas the 2015 survey conflated all currencies into a single question.
Respondents to both the old and new surveys were identified from a bespoke list of securities dealers who deal on their own account, that was provided by the Financial Conduct Authority. The market structure of securities dealers is such that the very largest securities dealers account for the vast majority of the assets held overall. To minimise burdens on business, it was decided to sample only the top companies, which together manage around 97% of assets. Given this very high coverage rate, alongside the fact that each of the companies engages in quite different sets of financial instruments, no estimate is made for the other companies that manage the remaining 3% of assets.
One of the purposes of both surveys has been to ensure that all assets and liabilities of securities dealers are comprehensively identified. One of the main methods of ensuring comprehensiveness is to ensure that all the different types of instruments listed in the questionnaire have an “other” or “not elsewhere identified” box. Because both old and redeveloped surveys have this type of “other” box, both surveys are considered to collect comprehensive information on securities dealers’ assets and liabilities. This is borne out in practice, as the results presented later in this article show.
The other main method of ensuring comprehensiveness of coverage of the different types of financial instrument is to capture this information at as detailed a level as possible. The redeveloped survey has been designed to do exactly this. In so doing, it has also distinguished more cleanly between the different types of instrument, whereas the old survey occasionally conflated different instruments together. Table 1 sets out the different groupings of financial instruments collected in the redeveloped and old surveys and it illustrates the better distinction in the new survey. Table 1 describes how the old and redeveloped surveys relate to one another, but it does not convey the exact detail of how the questions in each of the survey map to one another.
The redeveloped surveys were designed in line with ESA 2010 categories of financial assets and liabilities. These categories are:
- currency and deposits (AF.2),
- debt securities (AF.3),
- loans (AF.4),
- equity and investments fund shares and units (AF.5)
- insurance, pensions and standard guarantees schemes (AF.6)
- financial derivatives and employee stock options (AF.7)
- other accounts receivable/payable (AF.8)
Table 1: Financial instruments collected on the redeveloped and old surveys
| Assets | ||
| Redeveloped survey | Old survey | |
| Deposits (AF.2) | Cash, money at short notice, debtors etc | |
| (parts of: AF.2, AF.31, AF.41 & AF.8) | ||
| Money market instruments and other short term assets | ||
| (parts of: AF.2, AF.31) | ||
| Debt securities with a maturity of less than one year (AF.31) | Cash, money at short notice, debtors etc (parts of: AF.2, AF.31, AF.41 & AF.8) | |
| Money market instruments and other short term assets (parts of: AF.2, AF.31) | ||
| Other assets (parts of: AF.4, AF.3, AF.5, AF.7) | ||
| Other short term assets (parts of: AF.31, AF.41) | ||
| Debt securities with a maturity of more than one year (AF.32) | Other assets (parts of: AF.4, AF.3, AF.5, AF.7) | |
| Short term loans (AF.41) | Other short term assets (parts of: AF.31, AF.41) | |
| Long term loans (AF.42) | Other assets (parts of: AF.4, AF.3, AF.5, AF.7) | |
| Equity shares and units (AF.5) | Other assets (parts of: AF.4, AF.3, AF.5, AF.7) | |
| Derivative contracts (AF.7) | Other assets (parts of: AF.4, AF.3, AF.5, AF.7) | |
| Other accounts receivable (AF.8) | Cash, money at short notice, debtors etc (parts of: AF.2, AF.31, AF.41 & AF.8) | |
| Non financial assets. | Other assets (parts of: AF.4, AF.3, AF.5, AF.7) | |
| Liabilities | ||
| Redeveloped survey | Old survey | |
| Debt securities (AF.3) | Borrowing (parts of: AF.3, AF.4, AF.5, AF.7, AF.8) | |
| Short term loans (AF.41) | Borrowing (parts of: AF.3, AF.4, AF.5, AF.7, AF.8) | |
| Long term loans (AF.42) | Borrowing (parts of: AF.3, AF.4, AF.5, AF.7, AF.8) | |
| Equity shares and units (AF.5) | Borrowing (parts of: AF.3, AF.4, AF.5, AF.7, AF.8) | |
| Capital and reserves (parts of: AF.5) | ||
| Derivative contracts (AF.7) | Borrowing (parts of: AF.3, AF.4, AF.5, AF.7, AF.8) | |
| Other accounts payable (AF.8) | Borrowing (parts of: AF.3, AF.4, AF.5, AF.7, AF.8) | |
| Other Liabilities | Capital and reserves (parts of: AF.5) | |
| Source: Office for National Statistics | ||
Download this table Table 1: Financial instruments collected on the redeveloped and old surveys
.xls (29.7 kB)Whereas the old survey collected detailed quarterly transactions complemented by annual balances, the redeveloped survey has been designed to collect detailed quarterly balances and only a few high level transaction estimates which is consistent with what survey respondents have advised they can report with the greatest accuracy. This means that for many variables, the detailed quarterly flows need to be calculated based on the changes in asset and liability levels.
Both the old and the redeveloped surveys also collect data on derivatives, but the new survey also collects information on securities dealers’ net holding gains/losses which allows for the introduction of a better method for estimating derivatives flows. The redeveloped survey collects more detailed counterparty information for these derivatives. This includes the split of household and non-profit institutions serving households (NPISH) sectors. Monetary financial institutions (MFI) have been split into UK banks and building societies and UK money market funds sub-sectors. Other financial institutions (OFIs) have been split into UK non-money market trusts and funds, UK financial auxiliaries and UK financial intermediaries except insurance corporations and pension funds sub-sectors. This is illustrated below in Table 2.
Table 2: comparison of subsector detail in the old and redeveloped surveys for financial derivatives
| Redeveloped Survey | Old survey |
| 1. UK banks and building societies | Monetary Financial Institutions |
| 2. UK money market trusts and funds | |
| 3. UK non-money market trusts and funds | Other Financial Institutions |
| 4. UK financial auxiliaries, captive financial institutions and money lenders. | |
| 5. UK Financial intermediaries, except insurance corporations and pension funds | |
| i. Of which Other securities dealers | |
| 6. UK insurance corporations and pension funds | Insurance Companies and pension funds. |
| 7. UK private and public non-financial corporations | Private and Public non-financial corporations |
| 8. UK central government and UK local authorities | Central Government and local authorities |
| 9. UK households and Individuals | Households and non-profit institutions serving households |
| 10. UK non-profit institutions serving households. | |
| 11. Non-UK residents. | No-residents |
| Source: Office for National Statistics | |
Download this table Table 2: comparison of subsector detail in the old and redeveloped surveys for financial derivatives
.xls (27.1 kB)Both the old and redeveloped surveys also collect data on spread earnings. Spread earnings are the margin between the purchase or offered price and the market value of a security and they apply to bills, bonds, equities, investment fund shares and foreign currencies. These margins are implicit charges for the provision of financial services. Service charge is an output of securities dealers, which is bought by counterparty sectors. The counterparty sectors include financial corporations, non-financial corporations and rest of the world. The redeveloped survey goes further to collect data on spread earnings from derivative contracts. This is used in the estimation of net derivative flows as will be discussed further in section 5.3.
Finally, while the redeveloped survey has been designed to capture information on all securities dealers’ activity, only the information from the redeveloped survey that replaces what is already in the National Accounts is actually being taken on for Blue Book 2017. The intention is that the remainder of the data from the redeveloped survey will be taken on in the experimental Enhanced Financial Accounts statistics in 2019.
4.3. National accounts requirements
The concepts, definitions and some broad methods for the UK National Accounts are set out in the European System of Accounts 2010: ESA 2010, which is the legally-binding set of international standards for the compilation of national accounts in the European Union. The redeveloped securities dealers’ survey has been designed to collect information that is consistent with the concepts and definitions that are set out in ESA 2010.
As one of the key functions of the national accounts is to measure how the economy is changing and evolving over time, one of the most important requirements of the data inputs into the accounts is that the time series are consistent and that breaks in the time series are minimised. The comprehensive overhaul of a survey therefore presents a challenge, especially where there is no dual running period that would allow any statistical effects to be more clearly distinguished from financial and economic reality. Much of the methodology described in this paper is concerned with ensuring that the time series that appear in the financial account and balance sheets demonstrate the least amount of statistical disruption, therefore ensuring the entire time series benefits from the improvement in data quality introduced by the new survey.
A further national accounts requirement is that the information is internally congruous and consistent. This means for example that changes in, say, levels of holdings of an asset are consistent with any acquisitions and disposals of those assets plus any revaluation or other change in volume effects, for example, write-offs or population changes.
Back to table of contents5. Methods
The quality and comprehensiveness of the data collected in the redeveloped securities dealers’ survey are significantly better than that previously collected, in particular the fact that the level of detail now available is consistent with what is required for the UK National Accounts. This means that the data collected in the redeveloped survey can be fed directly into the national accounts, financial account and balance sheets as is, with no further calculation or adjustment necessary.
There are a number of requirements for methodological solutions, as follows:
Time series continuity: the need for consistent time series means that the estimates from the old and redeveloped surveys need to be linked;
Estimating flows and revaluations: quarterly acquisitions and disposals of financial instruments, along with quarterly revaluations, needs to be estimated based on, for example, the asset and liability levels and changes in their prices;
Improving the calculation of derivatives: better data has meant that it is possible to improve the method for calculating the acquisition and disposal of derivatives; and
Improving the allocation of securities dealers’ spread earnings: Better data has meant that it is also possible to improve the method for establishing who is paying securities dealers for their services.
For all of these methods, the basic strategy adopted has been to use as much of the raw data as possible, and to only introduce methodological solutions as a secondary solution. Even where some modeling has been required, these modeled solutions have been based at least in part on the data that have been collected, either in the old survey or in the redeveloped survey.
5.1. Time series continuity
As previously stated, the breakdown of data returned on the new questionnaire is significantly different from that returned on the old questionnaire, meaning that time series continuity at a detailed level of financial instrument is not always present. Table 1 has already illustrated how the redeveloped survey collects information on financial instruments in a very different way from the old survey. However, because the old and redeveloped surveys are considered to be comprehensive at the total asset and liabilities level, this means that we have time series continuity at this level.
There are actually more granular levels of detail that are also considered to be consistent over time. This is because the definitions and concepts, as well as the detailed instructions for respondents when completing the surveys, are also consistent over time. Table 3 sets out the instruments which have been considered to be consistent across the old and redeveloped surveys, and those which have not been.
Table 3: Financial instruments that are considered to be consistent or inconsistent across the old and redeveloped surveys
| Consistent higher level series | Inconsistent higher level series |
| Assets | |
| Total assets Deposits+Loans+Other accounts receivable | Deposits Short-term debt securities Long-term debt securities Short-term loans Long-term loans Equity and investments fund shares and units Financial derivatives Other accounts receivable Other financial assets Non-Financial assets |
| Liabilities | |
| Total liabilities Equity Financial derivatives | Short-term debt securities Long-term debt securities Short-term loans Long-term loans Other accounts payable Other Liabilities |
| Source: Office for National Statistics | |
Download this table Table 3: Financial instruments that are considered to be consistent or inconsistent across the old and redeveloped surveys
.xls (26.6 kB)For all financial instruments at all levels of aggregation other than total assets and liabilities, the data for Quarter 1 (Jan to Mar) 2015 and onwards come directly from the redeveloped survey, and the data for previous quarters needs to be constructed using as much of the raw data from the old survey as possible.
Once the back series have been constructed from the old survey data, for those time series not considered consistent between Quarter 4 (Oct to Dec) 2014 and Quarter 1 2015, the level of the financial instruments reported in the redeveloped survey provide the benchmark levels, and the back history is adjusted to achieve consistency. This is because the redeveloped survey provides better estimates throughout, and therefore acts as the benchmark.
In order to make the most of the data collected in the old survey, the method maintains the growth rates demonstrated by the old survey data as closely as possible, but establishes the level such that there is no step change at the point in time of the introduction of the new survey. To do this a systematic methods process has been adopted to model the back series. The process was an iterative one, which consisted of three steps (the first of which has been described already in the paragraphs immediately above), and which started at the total assets and liabilities level and worked down towards the granular level of detail:
- Mapping each of the individual new survey questions to the old survey
- Adjusting the link between old and new data
- Constraining up the financial instrument hierarchy
In summary, the first step involves taking each of the questions on the redeveloped survey and creating an initial back series for the pre-2015 period (for which the new survey does not provide estimates). This was done by mapping the questions asked on the old survey to the new and is described further in the next section. Once the initial mapping was complete, steps 2 and 3 listed above were carried out in a step-by-step fashion, moving down through each level in the classification hierarchy, starting at the total asset and total liability level. At each level in the hierarchy, all component series which had been judged to be inconsistent between the two surveys were adjusted (step 2) and then constrained so that sum of the adjusted series was equal to the equivalent total (step 3).
This process is further illustrated by figure 1.
Figure 1: process for creating consistent back series for redeveloped Securities Dealers survey questions

Source: Office for National Statistics
Download this image Figure 1: process for creating consistent back series for redeveloped Securities Dealers survey questions
.png (30.8 kB)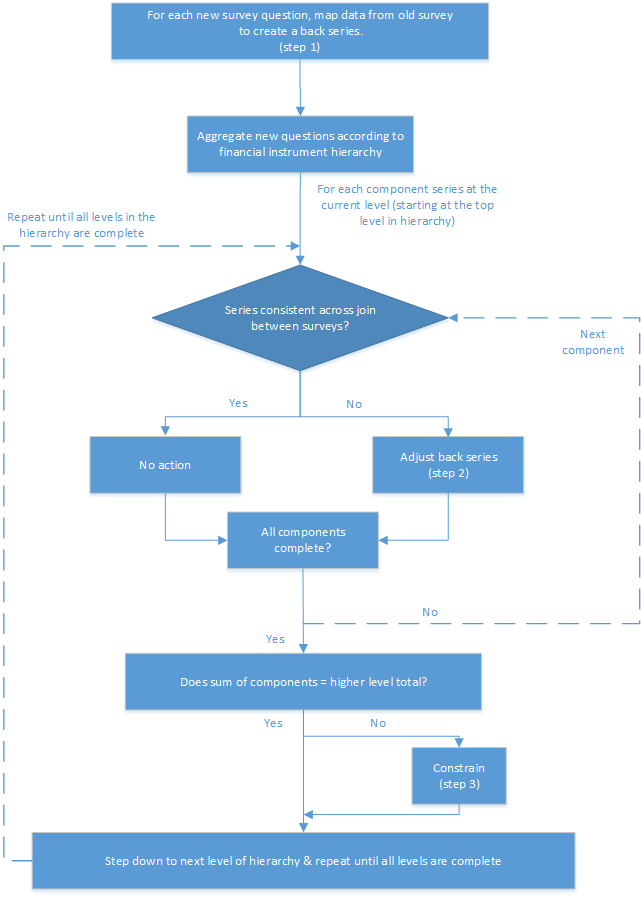
5.1.1. Step 1: mapping each of the individual new survey questions to the old survey
The first step in the process was a “conceptual” one, based on identifying which consistent time series can be constructed by investigating in a theoretical sense the concepts and definitions of each of the questions in the old and redeveloped surveys, and “mapping” questions together. This mapping stage maximises the use, both directly and indirectly, of the old survey data in the new method. The types of relationships that exist are:
- one-to-one relationship: a new question maps to an old question
- many-to-one relationship: a number of old questions together are summed up which then map to a new survey question
- one-to-many relationship: a single old survey question is distributed across a number of new questions.
- many-to-many relationship: several old survey questions are distributed across a number of new questions
5.1.2. Step 2: adjusting the link between old and new data
The next step is a practical one to examine the time series consistency at the point in time of the changeover in survey, and adjust the link between the old and redeveloped survey data where necessary. The adjustment takes the form of substituting the “mapped” growth from step 1 in a series between Quarter 4 2014 and Quarter 1 2015 with the growth in the parent series for that period only; that is, if a series had a step change it would use the growth rate from an aggregate series which sits above it in the financial instrument hierarchy. For all prior periods, the underlying growth rates from the original mapped version of the series are used. This is the closest we can get to removing what is the statistical effect and leaving behind only the financial or economic effect.
5.1.3. Step 3: Constraining up the financial instrument hierarchy
In some cases, the result of carrying out step 2 is to remove the additivity of the instruments up the hierarchy: the sum of the individual detailed instruments differs from total assets and total liabilities. A check was therefore undertaken at each hierarchical level to ensure that the sum of all relevant components were equal to the parent. Where the sum was different from the total, the difference was distributed proportionately across the lower level series. This was an iterative process, which was repeated until both of two requirements were satisfied: that the time series appeared consistent (as a set) and the individual components summed to the parent.
5.2. Estimating flows and revaluations
The redeveloped survey predominantly collects levels data. The difference between the value of holding (or level) of any asset or liability between any two points in time is made up of four components:
- new acquisitions (purchases) of the asset or liability
- disposals (or sales) of the assets or liability held
- changes in the price or valuation of the assets or liability held (in the national nccounts, this is termed “revaluation”
- any other changes in volume (which would include, for example, changes in the way the asset or liability is classified and some types of write-off)
This relationship between the levels, flows (which is the difference between acquisitions and disposals), revaluations and other changes in volume can be expressed through the accounting identity in Box 1.
Box 1: the accounting identity linking stocks, flows, revaluations and other changes in volume

Source: Office for National Statistics
Download this image Box 1: the accounting identity linking stocks, flows, revaluations and other changes in volume
.png (5.6 kB)
Due to the limited information available for other changes in volume, and as these changes are by definition exceptional, and unanticipated and not economic in nature, these have been set to zero. This leaves only two components to be estimated: net flows (acquisitions less disposals) and revaluations. To derive these, the approach taken was to estimate the revaluations using a price index or indices (depending on whether the instrument was reported in a foreign currency), leaving the flow as the residual (of the change in stock).
There is very limited information about how the specific price of the various different detailed assets and liabilities change over time. However, there are a number of price indices available which relate to a whole group of financial assets or liabilities, and there are also a number of proxies that can be used in the absence of any specific financial information.
Price indices were used to account for, separately, market revaluations to debt securities issued by government, debt securities issued by others, listed and unlisted shares, and investment fund shares and units. For those instruments held in a foreign currency, an aggregate price index was used to account for exchange rate changes over time.
The price indices were used to revalue the previous level of the relevant asset (that is, the level at the end of the previous time period) – this could include a price revaluation, a currency revaluation, both, or neither – and then estimate the flow as the difference between the revalued level for the previous time period and the level in the current period.
5.3. Improving the calculation of derivative flows
Financial derivatives are financial instruments linked to another financial instrument, indicator or commodity through which financial risks can be traded in the financial markets in their own right. Data on trading in derivatives for UK banks was introduced into the financial accounts and balance sheets for the 2010 Blue Book and Balance of Payments Pink Book. The method used to calculate derivative flows is shown in Box 2.
Box 2: formula used for calculating net flows for derivatives

Source: Office for National Statistics
Download this image Box 2: formula used for calculating net flows for derivatives
.png (3.4 kB)
Net holding gains or losses, here synonymous with revaluations, are approximated as dealing profits less net spread earnings. Spread earnings are the margin between the purchase or offered price and the market value of a security and they apply to foreign exchange, securities and derivatives.
The improvement to this method relates to the data used in the calculation of net holding gains/losses: the redeveloped securities dealers survey collects data on securities dealers’ net holding gains/losses whereas the old survey did not. Instead, securities dealers’ net holding gains/losses were estimated based on information supplied by the Bank of England. In order to construct a consistent back series for 2014 and before, the method involves using a combination of the redeveloped survey data and the old survey data. The old survey included questions on securities dealers’ profit or loss and spread earnings, but only at the total level, whereas the redeveloped survey has these totals questions as well as “of which”-type questions to separately identify the profits or losses and spread earnings associated with derivatives. The method to construct the consistent back series relies on using the average proportion of the totals that is constituted by the “of which” derivatives from the new survey in 2015, and applying this average proportion to the totals from the old survey. This provides estimates of the equivalent of the “of which” derivatives series for 2014 and before.
5.4. Improving the allocation of securities dealers’ spread earnings
Spread earnings in the national accounts are considered to be a charge paid by consumers for the services provided by securities dealers, and the current method allocates a proportion of the total spread earnings to each sector, including households. However, households are not considered to consume the services of securities dealers directly but by way of an intermediary, and it is the intermediary who would be considered the consumer in the national accounts. From Blue Book 2017, households are removed from the allocation, making their consumption of spread earnings zero for all time periods.
For estimates relating to 2016 onwards, the allocation of spread earnings to consuming sectors has been improved, based on information that has become available from the Financial Conduct Authority (FCA). In a survey undertaken by the FCA in 2013, securities dealers reported their “fixed income” revenue by client type. Fixed Income is the income security dealers earn from spreads, as opposed to fees and commissions which are earned in equity, investment banking and corporate banking and transaction banking. This provides the information required on the allocation of total spread earnings to the consuming sectors. The proposed FCA proportions therefore provide a good proxy for approximating the allocation for spread earnings.
Back to table of contents6. Annex B: Expansion of financial sub-sector detail: separate identification of non-money market investment funds in the financial account and balance sheet
Background
Since the recent global economic downturn of 2008, there have been increased calls for greater transparency within the financial sector to help pre-empt and possibly prevent such occurrences in future. National and international organisations, through initiatives such as the International Monetary Fund’s Special Data Dissemination Standards (SDDS/SDDS plus), Eurostat’s Flow of Funds requirements and the expanded sector requirements of Financial Corporations proposed in the revised System of National Accounts 2008 (SNA08) and the European System of Accounts (ESA 2010) all aim to increase such transparency.
ESA 2010 sets out the framework within the EU and the wider European Statistical System for the compilation of economic statistics, in particular the National Accounts including the financial account and the balance sheets. This framework is invaluable for the analysis and evaluation of (a) the structure of the economy, specifically in terms of the composition of stocks and flows of financial assets by sector; and (b) specific parts or aspects of banking and finance in the national economy.
ESA 2010 sets out nine distinct types of institution (termed sub-sectors in this article) of the financial sector. These are:
- central bank (S.121)
- deposit-taking corporations except the central bank (S.122)
- money market funds (MMFs) (S.123)
- non-money market investment funds (NMMF) (S.124)
- other financial intermediaries, except insurance corporations and pension funds (S.125)
- financial auxiliaries (S.126)
- captive financial institutions and money lenders (S.127)
- insurance corporations (S.128)
- pension funds (S.129)
Currently, the UK financial account and balance sheet is presented separately for three groupings of these financial institutions:
- monetary financial institutions (MFIs) (S.121-S.123)
- other financial institutions (OFIs) (S.124-S.127)
- insurance corporations and pension funds (ICPFs) (S.128-S.129)
From Blue Book 2017, these accounts will be presented separately for five groupings of financial institution, with the existing OFIs sub-sector being split into two further sub-sectors:
- non-money market funds (NMMF) (S.124)
- other financial institutions (OFIs) excluding NMMF (S.125-S.127)
This section describes the new methods for estimating the activity of the NMMF sub-sector in the financial account and balance sheets. The activity of the other sector, other financial institutions (OFIs) excluding NMMF, is calculated as the difference between the parent OFI sub-sector and the new NMMF sub-sector.
Figure 2: Comparison of existing ESA 1995 and forthcoming ESA 2010 financial sub-sector groupings

Source: Office for National Statistics
Download this image Figure 2: Comparison of existing ESA 1995 and forthcoming ESA 2010 financial sub-sector groupings
.png (23.5 kB)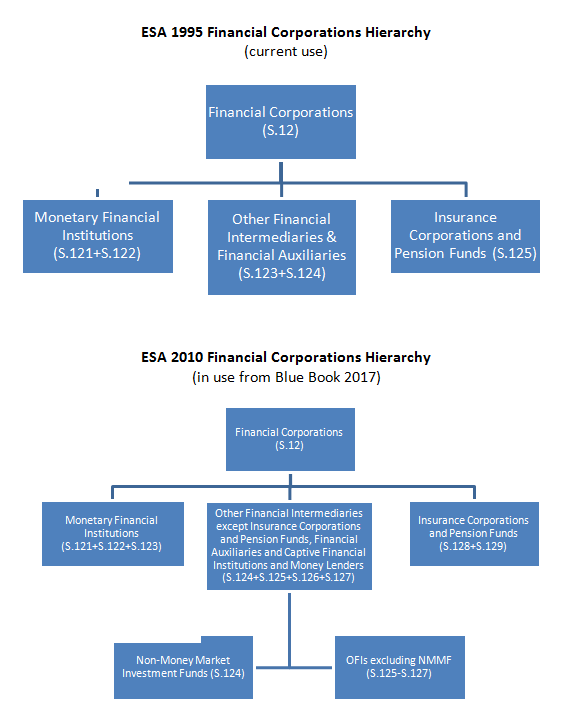
ESA 2010 defines NMMF as follows:
“‘The non-MMF investment funds subsector (S.124) consists of all collective investment schemes, except those classified in the MMF subsector, which are principally engaged in financial intermediation. Their business is to issue investment fund shares or units which are not close substitutes for deposits, and, on their own account, to make investments primarily in financial assets other than short-term financial assets and in non-financial assets (usually real estate).” (para 2.82, p.40)
Typically, NMMFs, along with securities dealers (one of the financial intermediaries in the OFI sub-sector), account for the majority of financial activity in the entire OFI sub-sector. NMMFs principally engage in the issuance of investment fund shares.
Further background to our classification system and, in particular, definitions of each of the institutional sectors can be found in this recently published article on the Economic Statistics Transformation Programme: Enhanced financial accounts (UK flow of funds) improving the economic sector breakdown.
Back to table of contents7. Data sources and methods
7.1. Strategy for data sources and methods
As with the development of methods for the introduction of the redeveloped Securities Dealers survey, the basic strategy adopted has been to use as much of the raw data as possible, and to only introduce methodological solutions as a secondary solution. Even where some modelling has been required, these modelled solutions have been based at least in part on the data that are available. Where modelling has been used, a “toolkit” approach was used to identify all possibilities for compiling NMMFs’ financial account and balance sheet, ranking them from the most to least favourable solutions. While the exact level of quality of results depends on the individual circumstances of each case, in general, those tools higher up on the toolkit list are expected to yield better quality estimates. The toolkit consists of:
Solution 1: Use the same data source as is used for the higher sector level (OFIs) total, where it includes the appropriate level of data for the disaggregate sector
Solution 2: Use an alternative data source
Solution 3: Apply a ratio, which could come from a variety of sources; for example, similar instruments in the same sector; the same instrument in another or similar sector; similar instruments in another or similar sector; counterparty information; same (or similar) instruments in the same (or similar) sectors in another country; other proxies such as turnover, employment etc.
At present, the only information that is available on the value of financial transactions that NMMFs are engaging in, and on their holdings of the different financial assets and liabilities, is from our Trusts surveys. Therefore, where the Trusts surveys do not provide data or the data that are provided are limited, a methodological solution has instead been adopted.
7.2. Data sources
We conduct six “Trusts” surveys that collect data from unit trusts, investment trusts and property unit trusts; each of which are a type of institutional unit that are categorised within the NMMF sector. The surveys consist of three annual questionnaires (one for each of these three types of trust) which collect data on their assets and liabilities at the end of each year. There are a further three questionnaires (one for each of the three types of trust) which collect (i) quarterly data about their investment in various financial products over a calendar quarter and (ii) their holdings of these products (including some assets and liabilities not captured on the annual forms) at the end of the quarter. The surveys were first introduced in 1963, but have since seen changes to turn them into their current form. More information (including quality and methodology information (QMI), purpose, sample and distribution dates) on each of our Trusts surveys can be found on our website, with links in the reference section at the end of this article.
These surveys are considered to cover the NMMF sub-sector comprehensively. Our Flow of Funds initiative aims to identify new data sources and increase the level of detail available on the types of financial corporation and on their financial transactions. This initiative will therefore either confirm that the current sources are indeed comprehensive, or will lead to improved estimates in the financial account and balance sheets. Typically, where the survey data are available, they are used directly in the financial account and balance sheets without modification: the questions have been designed to provide the information required. Any other data sources that may be available and that could provide information on the financial transactions that NMMFs engage in, will be investigated by the Flow of Funds initiative.
The Trusts survey data are used to make up the majority of the NMMFs assets data, accounting for approximately 99% of NMMFs total assets (as at 2015). Conversely, it only provides approximately 2% of NMMFs total liabilities (as at 2015) as the majority of their liabilities (specifically NMMFs issuance of mutual fund shares) are estimated using the same (alternate) data source that is used to calculate the majority of the higher-level sector, OFIs. A further methodological explanation of this can be found later on in this article (see section 7.3.4 – special cases, specifically F.52N1 Mutual Fund Shares).
7.3. Methods
While our Trusts surveys provide the vast majority of the data needed for the financial account and the balance sheets, this is not always the case.
A number of methods have been used to produce a complete dataset that is consistent with national accounts concepts. These are due to the need for:
Splitting aggregate survey data into more detail: for the most part, data collected on the Trusts surveys are consistent with what is required for the UK National Accounts. This means that the majority of data collected on the surveys can be fed directly into the national accounts, financial account and balance sheets as is, with no data manipulation required. However, there are some data on the trusts surveys that are only collected at an aggregate level and for which greater detail is required.
Time series duration or periodicity: the need for historic, quarterly time series means that quarterly and/or historic periods must be modelled for certain instruments;
Estimating flows and revaluations: quarterly acquisitions and disposals of financial instruments, along with quarterly revaluations, needs to be estimated based on, for example, the asset and liability levels and changes in their prices;
Special cases: alternate methods for estimating entire lines (from one of the options mentioned in the toolkit) are used where appropriate data are not collected in the Trusts surveys
Quality adjustments: quality adjustments are applied to series where data for NMMFs are not consistent with their higher sector total, OFIs
Methods for each of these requirements will be explained in the sections that follow below.
7.3.1. Splitting aggregate survey data into more detailed level financial instruments
Some of the information collected in the surveys is collected at an aggregate level and not at the level of detail required to estimate individual instruments. The affected instruments are preference shares (assets), F.3 debt securities (liabilities) and F.4 loans (liabilities).
Data for preference shares (assets) are collected on the Trusts surveys as listed and unlisted preference shares, but there is currently no distinction made between participating (classified as F.5 shares) and non-participating (classified as F.3 debt securities) preference shares. Hence, these data must be split across the appropriate F.3 and F.5 series to account for non-participating and participating preference shares respectively.
Similarly, data relating to F.3/F.4 (liabilities) are collected on the surveys according to asset holding counterparts (that is banks, other UK residents and so on), but there is no distinction made between their short-term or long-term maturities. Hence, these data must be split across the relevant short-term and long-term instruments that are recorded in the financial accounts.
Data from these series are split across multiple instruments using ratios derived from data for an associated sector (total OFIs) at the same level, or, where the impact of how the data is split is negligible, the estimates have been equally shared across the lower level components.
Example: Preference shares (assets)
The value of the listed and unlisted preference shares assets reported in the Trusts surveys has to be allocated to the appropriate financial instruments; F.32N56 long-term debt securities issued by UK MFIs and other UK residents and F.511N1 listed UK shares or F.512N1 unlisted UK shares. At present, there is no evidence that indicates what NMMFs holdings of assets would be in participating or non-participating preference shares. This is also the case for the higher sector total, OFIs, and even the total economy; owing to the fact that data for preference shares are not collected or calculated according to whether they are participating or non-participating.
The value of preference shares from the Trusts data is approximately £1.4bn for corporate bonds, £1.4bn for listed shares and £1mn for unlisted shares in recent quarters. These values are relatively tiny compared to the totals of which these should form part: the value of transaction lines F.32N56, F.511N1 and F.512N1 (excluding preference shares data) for NMMFs are upwards of £64bn, £250bn and £2bn respectively in recent quarters. During the methodological process, an impact analysis of using different ratios (50%, 100% and 25% as participating) to allocate preference shares data across the affected instruments showed that the effects were immaterial. Therefore, allocation of the preference share data has been distributed equally between bonds and listed or unlisted shares.
7.3.2. Modelling historic and/or quarterly periods
All of the time series must include quarterly data back to 1987 in order to align with the time span of the rest of the financial account. While flows data for NMMF are available from the Trusts surveys back to 1987, this is not the case for levels. In order to produce a full historic dataset, modelling of the back series for the majority of the level series collected on the surveys is required.
Specifically, data for the majority of level series collected on the annual surveys go back (for the most-part) to 1997. Whilst data for all but one of the level series collected on the property unit trusts quarterly forms go as far back as 1991. Hence modelling of the back series in these cases is required. In addition to this, modelling of quarterly periods for each of the annual series is necessary in order to meet the periodicity requirement.
Two different methodological approaches have been used to model historic NMMF estimates.
Option 1: Where quarterly flows data are available from the surveys, these are used alongside price and foreign exchange indices (appropriate to the instrument in question to account for any revaluations) to revalue each previous quarter.
Option 2: Where flow/index data are unavailable, growth rates are derived from the same instrument in an associated sector, OFIs, and used to model NMMF historic periods for that particular instrument.
The methodology assumes all “other changes in volume” are zero. Other changes in volume represent the financial flows that arise from assets and liability changes other than those arising from transactions and revaluations. Included are write-offs of claims, re-classification of assets, monetisation or demonetisation of gold, population changes and other events, all of which are deemed unforeseeable and could therefore only be accounted for in future on a case by case basis.
Example of Flow/Index Method – F.32N9 long-term bonds issued by rest of the world (assets)
Long-term bonds issued by rest of the world (F.32N9 - assets) is made up of numerous source level series from the annual Trusts surveys, some of which only have data as far back as Quarter 4 (Oct to Dec) 1997. The rest of the series have data back to (at least) 1987. As each of the annual series relating to F.32N9 have equivalent acquisitions and disposals data collected on the quarterly forms, the missing historic data for each of the relevant series is modelled using the flow/index approach, which produces estimates in the back series (for example, Quarter 1 1987 to Quarter 3 1997 ) that have a consistent join with the “real” data that is reported on the Trusts surveys in later years.
These series are then aggregated with other rest of world-issued corporate bond series (from the Trusts surveys) that already have existing historic data (if any) to create a total series for NMMFs long-term bonds issued by rest of the world. In addition to this, all series relating to this line are collected on the annual forms, meaning that quarterly periods need to be estimated across the full time series. This was also done at source level, rather than at the aggregate level.
Example of OFI Growth Rate Method – F.22N11 sterling deposits with UK banks (assets)
Sterling deposits with UK banks (F.22N11 – assets) is made up of numerous source levels series from the quarterly Trusts surveys, some of which (specifically from the PUT survey) only go as far back as Quarter 1 1992. There are no equivalent transactions data collected on either the annual or the quarterly surveys; hence the growth rate of the higher sector total OFIs is used to model historic estimates for NMMFs; this approach produces a consistent time series with a suitable linking period between the modelled and real Trusts survey data.
The source level series are then aggregated with the series that already have existing historic data to create a total series for NMMFs). In the case of sterling deposits with UK banks, the Property Unit Trust data are negligible relative to the rest of the data which makes up this financial instrument. As a result, the majority of the data that makes up the aggregate series is based on real survey data, rather than modelled data.
A summary of the instruments for which one or many of the source level series required modelling, as well as the method approach used for doing so, is shown in table 4. To reinforce what was said previously, the majority of series employ the flow/index method, owing to the fact that they are annual level series which have an equivalent flow reported on the quarterly surveys. Whilst F.2 (assets), F.4 (assets) and F.7 (liabilities) data are collected on the quarterly surveys there is no equivalent flow data available, hence we use the growth rate method instead.
Table 4: Summary of financial instruments for modelling and proposed use of method options
| Asset/Liability | Financial instrument | Option 1 (Flow/index method | Option 2 (growth proxy method) | |
| Assets | F.22N11 Sterling deposits with UK banks | X | ||
| F.22N12 Foreign currency deposits with UK banks | X | |||
| F.32N11 UK Central Government Securities | X | |||
| F.32N56 Long-term debt securities issued by UK MFIs and other UK residents | X | |||
| F.32N9 Long-term bonds issued by rest of the world | X | |||
| F.511N1 UK Listed Shares | X | |||
| F.512N1 UK Unlisted Shares | X | X | ||
| F.519N92 Rest of world shares and other equity | X | |||
| F.52N9 Rest of world mutual funds' shares | X | |||
| F.71N5 Financial Derivatives | X | |||
| Liabilities | F.32N56 Long-term debt securities issued by UK MFIs and other UK residents | X | ||
| F.41N11/F.424N1 Short-term loans by RoW MFI's/F.424N1 Other long-term loans by UK residents | X | |||
| F.41N92/F.424N9 Short-term loans by RoW MFI's/F.424N9 Long-term loans by RoW | X | |||
| F.71N5 Financial Derivatives | X | |||
| Source: Office for National Statistics | ||||
Download this table Table 4: Summary of financial instruments for modelling and proposed use of method options
.xls (28.7 kB)7.3.3. Estimating flows and revaluations
Similarly to securities dealers, methods are required for estimating flows for NMMFs where these data are not collected on the Trusts surveys. Therefore, much of the background information and methods concepts described in this section of the paper will mirror what has already been said in Annex A of this article.
The quarterly surveys largely collect levels data. This means that for certain instruments, flows need to be estimated using the levels data, whilst taking into account revaluations and other changes in volume such that the identity shown in Box 3 holds.
Box 3: The accounting identity linking stocks, flows, revaluations and other changes in volume

Source: Office for National Statistics
Download this image Box 3: The accounting identity linking stocks, flows, revaluations and other changes in volume
.png (5.6 kB)
The use of price and foreign exchange indices is conceptually the best option for calculating both foreign currency and market revaluations as suitable revaluations data are not yet available at the NMMF sub-sector level. Hence, flows are derived as the residual difference between the change in levels and revaluations (derived using appropriate indices). As mentioned previously, other changes in volume are assumed to be zero. The Trusts survey level questions that are missing equivalent flows questions relate to F.2, F.31, F.519 (specifically other equity) and F.89 (assets) and F.31, F.32, F.41 and F.42 (liabilities).
Foreign currency revaluations
All of the instruments mentioned above could include an element of foreign currency revaluation. In the majority of cases, data for these instruments are collected separately for sterling and foreign currency; where the sterling data has no asset exchange rate change (and hence there is no element of foreign currency revaluation) flows are calculated simply as the difference in levels.
Sterling or foreign currency split of ambiguous series
There are a handful of series on the Trusts surveys which are neither explicitly sterling nor foreign currency but could include an element of both (according to the surveys’ user guidance notes), meaning that revaluations needs to be accounted for here as well as in the explicit foreign currency series.
We therefore use a similar approach to that described above for foreign currency revaluations, but with the modification that only a proportion of the data (assumed to be foreign currency) is re-valued. A proportion is therefore required to split aggregate series between sterling and foreign currency. In the absence of any specific information on the sterling and foreign currency composition, it has been assumed that there is an equal split between the two.
Market revaluations
There is only one instrument type from those mentioned above (F.32N56 long-term debt securities) that should include a market price change element in addition to a foreign currency element, due it being tradable on the securities market. Therefore, the calculation of flows in this case uses price and foreign exchange indices in conjunction with one another, where the foreign exchange index is available from the Bank of England and the price index is a standard price index that is used within national accounts estimates.
7.3.4. Special cases
For certain financial instruments, data are not (explicitly or at all) collected on the Trusts surveys meaning that an alternative method for compiling each of these lines is required. For the majority of these instruments, the OFIs total is estimated using an appropriate ratio, on the grounds that data for these instrument types are, at present, unobtainable even at the OFI sector level. Hence similar methodologies are used for NMMFs.
An example of an instrument that uses a ratio to produce OFI estimates is government debt securities (assets); this instrument type is currently calculated as a proportion of Network Rail’s total issuance of bonds, where the ratio used relates to OFIs holdings of corporate bonds relative to that for total Financial Corporations (FINCOs). A similar methodology is therefore used for deriving the NMMF estimate of government debt securities (assets) which is detailed in table 5, along with methodological explanations for all of the other “special cases”.
The total value of these special cases accounts for approximately 1% of NMMFs overall total assets; in other words, the size of these estimates is negligible in comparison to the rest of the NMMF data (which comes from the Trusts surveys). Contrastingly, the special case relating to the financial instrument F.52N1 Mutual Fund Shares accounts for approximately 98% of NMMFs total liabilities (see explanation in Table 5).
Table 5: summary of the “special cases” and the methods used
| Financial instrument | Method | Explanation | ||
| F.21 | Zero | NMMFs’ holdings of currency are expected to be negligible. Indeed, the Trusts survey data reported from 2005 onwards are zero; it is therefore the intention to remove the questions for holdings of cash from the forms in future. | ||
| F.31N14 Other Government short-term securities (assets) | Ratio | NMMFs holdings of other short-term government securities are derived as the proportion of NMMFs’ assets in corporate Money Market Instruments (MMIs) (short-term) to total FINCOs assets in corporate MMIs, multiplied by Network Rail’s total issuance of MMIs. Note: NMMF corporate estimates come from the Trusts surveys. | ||
| F.32N12 Other UK Central Government bonds – denominated in sterling and foreign currency (assets) | Ratio | NMMFs holdings of other government securities are derived as the proportion of NMMFs’ assets in corporate bonds (long-term) to total FINCOs assets in corporate bonds, multiplied by Network Rail’s total issuance of bonds. Note: NMMF corporate estimates come from the Trusts surveys. | ||
| F421N1/2 Inward and Outward Foreign Direct Investment (FDI) Loans | Zero | Under the Balance of Payments and International Investment Position Manual (BPM6) (s 6:28), sectors S121, S122, S123, S124 and S125 are treated as not having foreign direct investment (FDI) loans or debt securities; so these data were reassigned to Other investment and Portfolio investment respectively when ESA10/BPM6 compliant reporting started in 2014. The current OFI data for the FDI loans lines represent sectors S126 and S127 sub-sectors. As S.124 is not currently part of the OFI estimates, these instruments have been set to zero in order to be consistent with the higher sector total. Note: Data collected on the Trusts surveys that relates to FDI loans are predominantly zero anyhow, with occasional (negligible) values reported. | ||
| F.423 Finance leasing (liabilities) | Zero | Data for financial leases as a liability to NMMFs are not collected (explicitly) on the Trusts surveys. However, NMMFs are not expected to have (sizeable) liability holdings for this line; that is, be the lessee of a financial lease; as it is unlikely that they would make use of an asset typically exchanged under a financial lease agreement. | ||
| F.52N1 Mutual Funds Shares (liabilities) | Alternative Data Source | NMMFs are the sole issuers of mutual funds shares within the OFI sector and hence, by definition, should always hold 100 per cent of the liabilities for this instrument type. Therefore, the estimate of NMMFs’ mutual funds shares must equal that for OFIs, such that the residual sectors (S.125-S.127) do not hold any liabilities for this instrument type. Data relating to the issuance of units are collected on the Trusts surveys; however, these data are not currently used to calculate the aggregate sector, OFI. Instead, data from the Investment Association (IA) are used. It is therefore necessary to use the IA data to estimate NMMFs’ liabilities in this line, to ensure that NMMFs’ level and flow estimates are the same as those for OFIs. When comparing the Trusts survey data with that from the IA, the Trusts survey data was just 0.01 per cent different from the IA data in 2012 and no more than 13 per cent away from the IA data in any other year; a positive indication that the coverage of both data sources is very similar. As mentioned earlier, this instrument accounts for approximately 98 per cent of NMMFs total liabilities, owing to the fact that NMMFs are thought to engage principally in the issuance of mutual funds shares. | ||
| F.61 Non-life insurance technical reserves (assets) | Ratio | Level estimates for NMMF are derived from the OFI total using a constant proportion of two per cent; the ratio for which is the average annual Business Register and Employment Survey (BRES) proportion of NMMFs to total OFIs number of employees. According to ESA 2010, “transactions in non-life insurance technical reserves for unearned premiums and claims incurred relate to risks like accidents, sickness, or fire, and also to reinsurance.” NMMFs are expected to take out employment insurance on their employees’ behalf to cover risks such as these; hence an employment ratio is used as a proxy for estimating NMMFs non-life insurance technical reserves. It is likely that NMMFs would have claims on other types of insurance policies such as building and indemnity cover, so this approximation is not assumed to be comprehensive, but is the best data available at present. Note: Flow estimates are derived as the difference between current and previous year’s level to be consistent with the current OFI methodology for this line. | ||
| F.64 Claims of pension funds on pension managers (liabilities) | Ratio | Level and flow estimates for NMMF are derived from the OFI total using a constant proportion of two per cent; the ratio for which is an average Annual Survey of Hours and Earnings (ASHE) proportion of NMMFs to total OFIs wages and salaries (2008-2015). The use of a wages and salaries ratio as a proxy for estimating NMMF F.64 liabilities mirrors the current methodology for its higher sector total, OFI. This method assumes that the amount of wages payable informs the scale of claims of pension funds on pension managers. | ||
| F.72 Employee stock options (liabilities) | Ratio | Similarly to F.64, employee stock options (ESOs) data for OFIs are derived by apportioning a figure for total employee stock options across the relevant sectors (S.11PR, S.12 and S.15) using a pattern of D.11 wages and salaries data. Therefore, level and flow estimates for NMMF are derived from the OFI total using a constant proportion of two per cent; the ratio for which is the average annual ASHE proportion of NMMFs to total OFIs wages and salaries (2008-2015). | ||
| F.89 Other accounts payable/receivable (assets and liabilities) | Ratio | At present, there is a lack of corroborative evidence to suggest what the size of NMMFs assets and liabilities estimates would be for this instrument. It has therefore been assumed that OFIs assets and liabilities are split equally between NMMF and the residual sectors within OFIs (S.125-S.127). | ||
| Source: Office for National Statistics | ||||
Download this table Table 5: summary of the “special cases” and the methods used
.xls (36.4 kB)7.3.5. Quality adjustments
As NMMFs are a sub-sector of OFIs, the size of holdings for NMMFs must usually be between zero and the OFI total. However, for some series in particular time periods, this is not the case. Whilst it is possible for NMMFs to incur negative holdings, specifically of tradable instruments where short-selling can occur, the reason the NMMF estimates exceed the zero and OFI boundaries in some cases is due to a disparity between data sources used for compiling data in the NMMF and OFI datasets. In order to deal with this, quality adjustments are applied to the NMMF estimates (where required) at the final level of aggregation to ensure that the NMMF estimates stay within the boundaries of zero and the OFI total.
The quality adjustments (used to up or downscale NMMF estimates appropriately) are calculated in particular time periods using the relative size of NMMF to total OFIs in surrounding quarters, or where OFIs is immaterially small, zero or negative, negate the figure in the NMMF level series to create a final output of zero.
In the majority of cases, NMMF estimates exceed the boundaries in historic periods (prior to 1997) due to historic OFI data being (a) modelled (prior to 1997) and therefore small relative to the size of the Trusts survey data, or (b) zero.
As adjustments are made to single quarters within a level series rather than to an entire series, the affected flows are also adjusted in order to maintain the original relationship between the size of the change in level estimates and the flow estimates.
Example – F.511N1 listed shares
The current financial account estimates of OFIs' holdings of listed shares are based on a number of different sources, which together are not considered to be comprehensive, and will be improved as part of ONS’ Flow of Funds work. The estimates reported in our Trusts and Funds survey are considered to be of higher quality, as the coverage of that survey is more comprehensive. As a result, the estimates for NMMF are significantly close to OFIs, on average, equating to over 70% of the total published for OFIs, but more than 100% in some quarters across the span of the time series. In light of this, a quality adjustment has been applied (using the method explained above) to the NMMF estimates to produce a time series that is consistent with the OFI sector total.
Back to table of contents8. References
European System of Accounts 2010 (ESA 2010)
ESA 2010 Transmission Programme
Balance of Payments and International Investment Position Manual (BPM6)
Securities dealers survey (part of the Financial Services Survey)
Quality and Methodology Information (QMI): MQ5 Investment by insurance companies, pension funds and trusts
Information on Unit Trusts: Annual return of assets and liabilities
Information on Unit Trusts: Quarterly return of transactions Information
Information on Investment Trusts: Annual return of liabilities and assets and overseas income and interest paid
Information on Investment Trusts: Quarterly return of transactions
Information on Property Unit Trusts: Annual return of liabilities and assets
Information on Property Unit Trusts: Quarterly return of transactions