2. Summary
Recommendation 9 of the National Statistics Quality Review (NSQR) of National Accounts advised that the data sources and methods for estimating costs of ownership transfer that are to be capitalised (that is, those relating to non-financial assets) should be reviewed to ensure they are in line with international standards and that they appropriately enter capital stock estimates. This is identified in NSQR report 2, page 57, Recommendation 9.
This note explains the concepts underpinning costs of ownership transfer, the current UK approach to measuring them and provides recommendations to align the UK approach to international best practice.
A number of improvements to improve compliance with the international concepts in this area are outlined. A new sectorisation method and the removal of negative estimates for expenditure on transfer costs on non-produced non-financial assets are planned for inclusion in UK National Accounts: the Blue Book 2017 with other recommendations forming the basis of potential for future improvements.
Back to table of contents3. Introduction
The concept of costs of ownership transfer, referred to as transfer costs within this note, is needed to fully value non-financial assets in the capital account and non-financial balance sheets. The main references are: Organisation for Economic Co-operation and Development ( OECD) (2009, Section 9.1); multiple references given later in this note, which are within the System of National Accounts (SNA 2008); and also European System of Accounts (ESA 2010, paragraph 3.133).
In July 2014, the Office for National Statistics (ONS) published the National Statistics Quality Review of National Accounts. This review clearly highlighted transfer costs as an area for further investigation. (NSQR, page 57). That is:
“Process Recommendation 9: The data sources and methods for estimating costs of ownership transfer that are to be capitalised should be reviewed to ensure they are in line with international standards and that they appropriately enter the capital stock estimates.”
This note explains the concepts underpinning transfer costs, the current UK approach of measuring them and provides some areas for discussion on how to narrow the gap between the theory and the practice. This includes consideration of:
- the treatment of transfer costs on different types of assets and special cases in their measurement
- the treatment of transfer costs for balance sheet estimates
- implications of transfer costs on estimates of capital services
- the valuation of assets at the appropriate price basis
- an improved approach to allocate transfer costs across different institutional sectors
- new and additional sources of data on transfer costs
- the exhaustiveness of transfer costs estimates
4. Concepts and definitions
3.1 What are transfer costs?
When a single asset is purchased, the value of that asset is likely to relate to transactions in a number of products, each of which has its own price. Part of this price may be the price of a machine, a building, or a piece of transportation equipment, but this is unlikely to represent the full value of the asset to its user. If any services were purchased with the machine, building, or piece of transport equipment in order for it to be in a state from which it can be utilised in production, then these are also part of the value of the asset.
The costs associated with changing the ownership of an asset from one institutional unit to another represent transfer costs, and can include, for example, legal fees, installation and de-installation fees and real estate fees.
Transfer costs don’t necessarily have to be paid for by one institutional unit to another and may rather be conducted on own account. For example, if a factory uses its own staff to install a machine, or a company uses its legal staff to conduct a building sale, then the cost of the labour, intermediate consumption and other costs incurred in this activity should, in principle, be recorded as fixed capital formation. This would form a type of output for own final use.
Transfer costs can be incurred for all types of assets included in the national accounts boundary: financial, non-financial, produced, and non-produced; however, the treatment differs depending upon the type of asset. Transfer costs on financial assets are treated as consumption, while transfer costs on non-financial assets are capitalised.
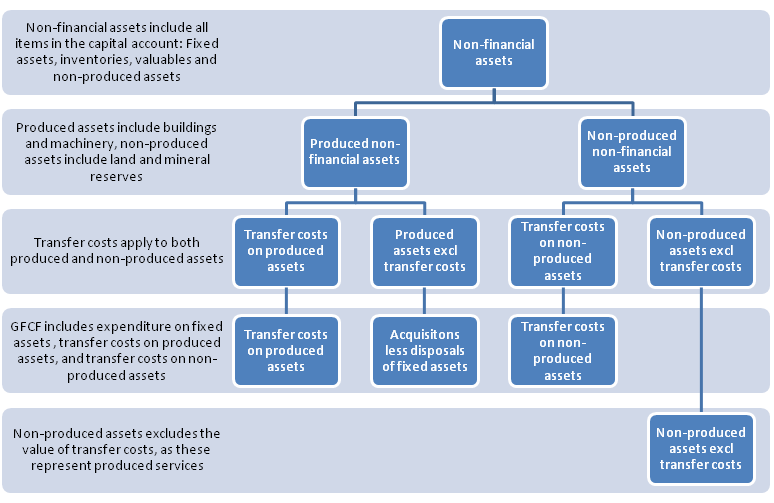
Transfer costs on produced non-financial assets are included in the value of an asset, while transfer costs on non-produced non-financial assets are treated as a category of produced non-financial assets in their own right. Figure 1 presents the differences in treatment as a diagram. An exception to this is transfer costs on land, which are by convention treated as land improvements. This is explained in the quote:
“The costs of ownership transfer on non-produced assets represent produced assets but their value cannot be integrated with the value of another produced asset. They must therefore be shown as a separate category of gross fixed capital formation. An exception is made in the case of land where costs of ownership transfer are treated by convention as land improvements.”
System of National Accounts (SNA) 2008 (paragraph 10.97)
Transfer costs are capitalised for fixed assets, non-produced non-financial assets, inventories and valuables, however, the SNA 2008 raises the question of whether transfer costs on valuables should instead be treated as consumption, as valuables are primarily stores of value and not sources of services into production and therefore have more in common with financial assets than non-financial ones, this is described in the quote: “Valuables are non-financial assets but they are held as stores of value and are not used in production. As such, they have more in common with financial assets than they do with other non-financial assets. Therefore, it is arguable that costs of ownership transfer on valuables should be recorded as intermediate consumption rather than, as at present, fixed capital formation.”
SNA 2008 (paragraph A4.57)
But European System of Accounts (ESA) 2010 confirms the current treatment of including them:
“The production of valuables is valued at basic prices. All other acquisitions of valuables are valued at the purchasers’ prices paid for them, including any agents’ fees or commissions. They include trade margins when bought from dealers. Disposals of valuables are valued at the prices received by sellers, after deducting any fees or commissions paid to agents or other intermediaries. Acquisitions less disposals of valuables between resident sectors cancel out, leaving only agents’ and dealers’ margins.”
ESA 2010 (paragraph 3.157)
Figure 1: Diagram of produced, non-produced and transfer costs on non-financial assets
Source: Office for National Statistics
Download this image Figure 1: Diagram of produced, non-produced and transfer costs on non-financial assets
.png (37.2 kB)
Figure 1 shows the relationships between assets and their transfer costs and shows that gross fixed capital formation (GFCF) includes transfer costs on non-produced assets, as well as expenditure and transfer costs on produced fixed assets. As transfer costs on non-produced assets represent production activity, they are not included in the value of non-produced assets, so in the capital account, these appear excluding these costs.
Transfer costs on non-financial assets are part of the value of the assets in the balance sheet of an economy. This is because when an institutional unit purchases an asset, the price it pays for the asset, plus all connected expenditure in rendering the asset in a state that it can be used in production, is expected to be remunerated over the asset’s life by the income coming from using it in production. There is a clear link between the income generated from using an asset in production and the value of the asset over the course of its life and this link is elaborated in OECD (2009).
As transfer costs are part of an asset’s value, their treatment over the course of an asset’s life is of interest in estimating accurate balance sheets and as will be seen in this note, the treatment of a transfer cost (for example, a machine installation service) is quite different to that of the asset itself (for example, a machine). In particular, while the useable life of an asset is the time over which it is used in production (by any number of owners), the transfer cost should be written off over the time that the current owner holds it, as additional transfer costs will have to be paid by any new owner. In effect, the benefits of paying this transfer cost are used up once the asset is sold on.
The valuation basis is crucial to understanding the circumstances giving rise to transfer costs and describes how for a transaction in a particular entity, whether the value contains or excludes different components from the perspectives of the different transactors. For example, when a manufacturer sells a product to a retailer, the price it receives from the retailer is quite different from that paid by the household who buys the product for their final consumption. This describes the difference between basic and purchasers’ prices, which also applies to assets, but with the addition of transfer costs:
“In the case of fixed assets, the value of an acquisition is the amount paid by the purchaser, or seller, plus the associated costs of ownership transfer incurred by the purchaser. The value of a disposal of an existing fixed asset is the amount received by the seller from the purchaser minus the costs of ownership transfer incurred by the seller.”
ESA 2010 (page 164, paragraph 6.33)
“When the sale takes place between two resident producers, the positive and negative values recorded for gross fixed capital formation cancel out for the economy as a whole except for the costs of ownership transfer.” SNA 2008 (page 199, paragraph 10.40)
“The costs of ownership transfer on the acquisition and disposal of a fixed asset are treated as gross fixed capital formation and included in the value of the asset on acquisition and disposal as recorded in the capital account and in the value of the asset in the balance sheet.”
SNA 2008 (paragraph 10.158)
3.2 Who pays transfer costs?
Transfer costs can be paid by both buyers and sellers of assets. For example, if we consider the sale of a building, both the buyer and seller are likely to have to pay legal fees in order to complete the purchase. However, for the transfer of any particular asset, the transfer costs paid by both the buyer and the seller are capitalised by the buyer. This is because when the buyer purchases the asset, the price they pay to the seller must cover the costs incurred by the seller, as well as including the costs they pay to take ownership themselves. Similarly from the point of view of the seller, the value of the asset must account for the costs incurred to dispose of the asset, such as legal or de-installation costs.
3.3 What is the economic rationale for capitalising transfer costs?
Understanding the economic rationale of capitalising transfer costs requires consideration of the fundamental relationships determining the value and productive potential of non-financial assets, namely, that the value of an asset is equal to the discounted value of the benefits that the user can gain from the asset by using it in the production of their output. The value of these benefits can scarcely be observed directly, but the purchase price of the asset can normally be observed.
The question then becomes which items of expenditure are part of the value of the asset. From the point of view of the purchaser, all expenditure connected with acquiring the asset and preparing for it to enter a state in which it can be used in production are part of the value of the asset, as the user must expect to recover these costs by putting the asset at their disposal. This may include delivery charges, legal fees and installation charges, on top of items normally considered to be part of the purchase price of a good or service, such as distributors’ trading margins, certain taxes or levies and less subsidies and the basic price of the asset.
This rationale applies to both produced and non-produced non-financial assets. The main difference being that transfer costs are integrated into the value of produced assets and cannot be integrated into the value of non-produced ones in the capital or goods and services accounts, as by definition, they are produced and their associated assets are not. This gives rise to the existence of a category of fixed asset representing transfer costs on non-produced non-financial assets.
3.4 Position in the sequence of accounts and supply and use tables
The national accounts are primarily composed of a sequence of sector accounts describing production, the generation, distribution, redistribution and use of income, the accumulation of financial and non-financial assets and the value of those assets at points of time in balance sheets. In addition, requirements for detail on activity by industry and by product are furnished by the goods and services account, also referred to as the supply and use tables.
Transfer costs are composed mainly of produced services such as legal fees and appear in the capital account integrated with the value of produced assets, or if associated with the transfer of non-produced assets, as a separate category of fixed assets. Transactions in non-produced assets themselves are recorded under non-produced assets in the capital account and exclude the value of transfer costs. This exclusion gives rise to the property that transactions in non-produced assets sum to zero across all institutional units in the economy, as they don’t represent any production.
In the opening and closing balance sheets, transfer costs on non-produced non-financial assets should be integrated with the values of the non-produced non-financial assets on which they have been paid. This gives rise to one of a number of reasons that the value of non-produced assets can vary over time, which also includes holding gains or losses, economic appearance or disappearance and catastrophic losses of assets.
The supply and use tables provide a framework for balancing product flows in an economy and observe that all produced goods and services can be sourced from either domestic output or imports and used as final consumption expenditure, gross capital formation, intermediate consumption or exports.
Conceptually and assuming no statistical discrepancy, the differences between the value of supply and the value of use for any product group is explained by the difference between basic and purchasers’ prices and in the supply and use tables. This means distributors’ trading margins, taxes less subsidies on production and transportation costs. In other words, other components of the purchasers’ price of an asset such as installation or legal fees are not included and as such, when a user buys an asset, this must be represented in a supply and use table by them buying a product representing the asset itself and buying the product representing the transfer cost, such as a legal fee or an installation service.
In principle, these transfer costs, where they relate to produced assets, could be integrated into the value of products in an expanded transformation matrix of the supply table. Such an expanded transformation matrix would include a column entitled, for example, “Transfer costs on assets”, which would redistribute the relevant output into the purchasers’ prices of the products in question. This would, however, require a significant change to the internationally agreed practice determining how supply and use tables are compiled as well as the definition of purchasers’ prices.
Regardless of the definition of purchasers’ prices used in the compilation of supply and use tables for produced assets, transfer costs on non-produced non-financial assets, such as land, must be reported as use of the products to which they relate such as legal services, as by definition, there is no produced asset into which their value can be integrated.
3.5 Position in the non-financial balance sheets
The non-financial balance sheets show the value of non-financial assets at the start and end of a period (normally a year). In the balance sheets, the accumulated values of transfer costs are integrated with the value of the assets to which they relate. For produced assets, this is no different to the treatment in the capital account, however, for non-produced assets, this means that no item for transfer costs on non-produced non-financial assets should appear in the balance sheet. This is because the values should be accumulated and included in the value of the non-produced assets to which they relate. An exception is made for transfer costs on land, which by convention are treated as land improvements and therefore should be included in the value of land improvements.
In order to estimate the value of transfer costs in the balance sheet, estimates of price indices are needed to revalue different vintages of transfer costs to the prices of the current period. These indices should reflect that certain services, such as legal or installation services, may change in price over time as they may become more expensive due to increased production costs or fall if new technology is developed to deliver the services. Balance sheets and the consumption of fixed capital are measured at current, rather than historical, prices and as such, prior to applying the consumption of fixed capital to vintages of transfer cost payments, they must be expressed in the prices that would have been paid if they had been provided in the current period.
Estimates of the time that the assets on which the transfer costs have been paid are held by their owner have to be calculated in order to accumulate their value and write their value off as the consumption of fixed capital. This applies equally to produced and non-produced assets and implies that the average life length of a transfer cost for a produced asset may be different to that of the asset itself. For example, a machine, car or aircraft may be held by multiple owners and the benefits the owner gains by paying the transfer costs have been exhausted once the owner sells it to another institutional unit. Therefore, the transfer cost should be fully written off through the consumption of fixed capital by this point.
3.6 Capitalisation relationships for acquirers and disposers of assets
For fixed assets, both the transfer costs of the buyer and the seller are capitalised by the buyer. This can be demonstrated using formulae, but it is helpful to firstly consider the following definitions of different types of price basis that are used within national accounts.
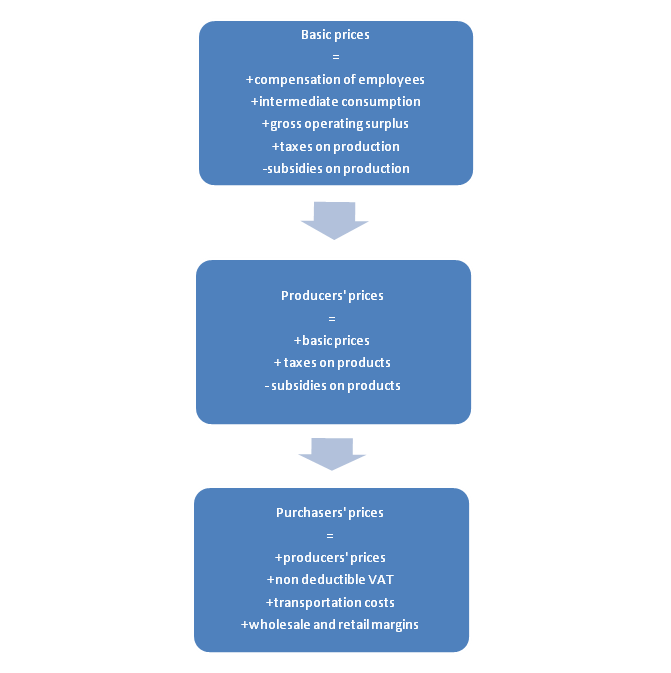
For background, a diagram within SNA 2008 (page 103, paragraph 6.69) provides a summary of the differences between valuation basis, namely by basic, producers’ and purchasers’ prices. Figure 2 provides a summary of how basic prices, for example, of imports of domestically produced products, are converted to purchasers’ prices through the addition (subtraction) of various taxes and subsidies, transportation costs and distributors’ trading margins.
Figure 2: Diagram describing basic, producers’ and purchasers’ prices
Source: Office for National Statistics
Download this image Figure 2: Diagram describing basic, producers’ and purchasers’ prices
.png (21.0 kB)
As noted in section 3.1 of this article, a transaction in a single asset may relate to a transaction in a number of products, such as the asset itself, an installation service, legal fees and other items. For the buyer, these will all be valued at purchasers’ prices and for the seller, the value of the asset being sold is valued at basic prices. In effect, the buyer is paying for the asset and all associated costs to have the asset ready for use in production, including those actually paid by the seller and the value of the asset to the seller is therefore the basic price, as this is what they receive net of all the items they have paid to have the buyer take ownership.
Using these different price definitions and using market prices are the basis reference, the following example shows the effect on gross fixed capital formation (GFCF) of a transaction in an existing fixed asset. In the example, bp represents basic prices, mp market prices and pp purchasers’ prices:
GFCF equals Acquisition value of the existing fixed produced non-financial asset minus Disposal value of the existing fixed produced non-financial asset
equals (Amount paid for fixed asset (pp equals mp) plus Transfer costs of buyer (pp)) minus (Amount received by seller (bp equals mp) minus Transfer costs of seller (pp))
equals Amount paid for fixed asset (pp equals mp) minus Amount received by seller (bp equals mp) plus Transfer costs of buyer (pp) plus Transfer costs of seller (pp))
equals Transfer costs of buyer (pp) plus Transfer costs of seller (pp))
This shows that the transaction is not neutral on the value of the assets on the balance sheet and that both the transfer costs of the buyer and the seller are added to the value of the asset. This is important to establish as it has a direct impact on how this information is collected through the Quarterly Acquisitions and Disposals of Capital Assets Survey (QCAS) based on the collected respondent information. It also means that the total transfer costs for produced non-financial assets cannot be separated out when the value of acquisition and disposals are collected on the given price basis.
From this illustration and using the formal definition of GFCF, it is possible to formulate a comprehensive equation for the calculation of GFCF, which includes price types. Starting with the definition of GFCF, which is:
“Gross fixed capital formation is measured by the total value of a producer’s acquisitions, less disposals, of fixed assets during the accounting period plus certain specified expenditure on services that adds to the value of non-produced assets.” (SNA 2008, 10.32)
or more explicitly:
“The acquisition, less disposals, of fixed assets plus major improvements to, and transfer costs on, land and other non produced assets.” OECD (2009, page 124)
This gives:
GFCF equals plus Value of acquisitions of fixed produced non-financial assets (purchasers’ prices)
minus Value of disposals of fixed produced non-financial assets (basic prices)
plus Non-produced non-financial assets improvements (market prices)
plus Transfer costs for non-produced non-financial assets
This is consistent with SNA 2008 (page 205, paragraph 10.97):
“The costs of ownership transfer on non-produced assets represent produced assets but their value cannot be integrated with the value of another produced asset. They must therefore be shown as a separate category of gross fixed capital formation. An exception is made in the case of land where costs of ownership transfer are treated by convention as land improvements. Costs of ownership transfer are defined in paragraphs 10.48 to 10.52.”
Figure 3 provides a simple example to demonstrate the properties of this relationship. The example demonstrates the relationship in the context of a produced asset, however, the result is exactly the same if the asset being transferred is non-produced. In this case, the transfer cost incurred by the buyer is much higher than that of the seller, but in other cases, such as transactions in dwellings, the balance may be more equal.
Table 1: Numerical example of the capitalisation of transfer costs for a produced asset
| Buyer | Seller | Impact of transaction on GFCF | ||||
| a) | Price agreed upon by transactors: | £100 | - | £100 | = | £0 |
| + | - | |||||
| b) | Transfer cost incurred by transactors: | £20 | + | £5 | = | £25 |
| = | = | |||||
| c) | Values added (removed) from balance sheets: | £120 | - | £95 | = | £25 |
| Source: Office for National Statistics | ||||||
Download this table Table 1: Numerical example of the capitalisation of transfer costs for a produced asset
.xls (26.1 kB)Row a) demonstrates that when an asset is sold from one institutional unit to another at some price that the transactors agreed upon, then this, alone, has no impact on GFCF as no production has taken place as a result: an asset has simply transferred from one producer to another.
Row b) supposes that both the buyer and the seller had to pay transfer costs, such as legal fees, in order to complete the transaction. From this perspective and assuming that these costs represent legal fees, both are using the output of the units producing legal services, either imported or produced by a domestic unit, meaning that the supply table contains a value of production, which is met on the use table by GFCF.
Row c) completes the picture by considering values added to and removed from the transactors’ balance sheets, where the difference between the two is the same as the change in GFCF as a result of the transaction.
This demonstrates that the transfer of assets from one institutional unit to another does not cancel out as the values of the asset are different for the 2 transactors. This also demonstrates that it is conceptually important for the transfer costs that the seller incurred when they initially took ownership of the asset have been fully written off in the national accounts through the consumption of fixed capital, as otherwise a residual value of transfer costs will exist in the value of the asset estimated in the perpetual inventory model (PIM).
SNA 2008, paragraph 10.51 is very clear on what is contained within transfer costs as a concept and it includes costs allocated to both the buyer and the seller. For example:
“All these costs associated with acquiring and disposing of assets may be described as costs of ownership transfer. The costs of ownership transfer consist of the following kinds of items:
- all professional charges or commissions incurred by both units acquiring or disposing of an asset such as fees paid to lawyers, architects, surveyors, engineers and valuers, and commissions paid to estate agents and auctioneers
- any trade and transport costs separately invoiced to the purchaser
- all taxes payable by the unit acquiring the asset on the transfer of ownership of the asset
- any tax payable on the disposal of an asset
- any delivery and installation or disinstallation costs not included in the price of the asset being acquired or disposed of
- any terminal costs incurred at the end of an asset’s life such as those required to render the structure safe or to restore the environment in which it is situated.”
Taking these definitions into account, and the classification structure as defined within the SNA 2008 (page 208, Table 10.2) means that: (in the example, bp represents basic prices and pp purchasers’ prices)
GFCF equals plus Value of acquisitions of fixed produced non-financial assets (pp)
minus Value of disposals of fixed produced non-financial assets (bp)
plus Transfer costs of buyers for produced non-financial assets (pp)
plus Transfer costs of sellers for produced non-financial assets (pp)
plus Non-produced non-financial assets improvements (including transfer costs for land) (pp)
plus Transfer costs of buyers for non-produced non-financial assets
(excluding land) (pp)
plus Transfer costs of sellers for non-produced non-financial assets
(excluding land) (pp)
As an aside, SNA 2008 (page 202, paragraph 10.62) considers the situation in the context of barter; in this example, while the barter may not result in any payment being made, it is likely that the transfer cost would result in a payment being made particularly if any third party were used to complete the sale, or install the asset:
“Fixed assets acquired through barter are valued at their estimated purchasers’ prices plus any costs of ownership transfer. In practice, neither taxes on products nor transportation costs may apply, in which case the purchasers’ prices will not differ from the basic prices of the product. Fixed assets produced for own gross fixed capital or assets transferred in kind are valued at their estimated basic prices, or by their costs of production when satisfactory estimates of their basic prices cannot be made.”
3.7 Prices and volumes of transfer costs
Estimates of expenditure on some components of transfer costs on non-produced non financial assets in current prices are readily available from administrative sources, such as expenditure on Stamp Duty, or can be sourced from business surveys. More difficult conceptual questions arise regarding volume measures of transfer costs, particularly where these are on taxes for which it is conceptually difficult to define a unit value that can be used to decompose value into price and volume.
For some aspects of transfer costs such as legal fees, installation services and decommissioning costs, Service Producer Price Indices may be an adequate way to deflate transfer costs on assets. Difficulties arise where the assets being installed or decommissioned are very specific and where the price index measured may not be representative. This is likely to be the case for the costs of nuclear decommissioning.
3.8 Special case: terminal costs
Terminal costs represent the costs of rendering an asset safe and to return the environment where the asset is situated to the condition it was before the asset was put there. Examples include clean-up costs of nuclear facilities, the decommissioning expenditure for oil rigs, platforms and pipelines, and the clean-up costs of landfill sites. During the final periods of these assets’ useable lives, they may have a negative market value, which represents that another owner would have to be paid to take ownership of them in anticipation for the terminal costs they would have to pay. Terminal costs were explicitly introduced in the 2010 update to the ESA and we have included estimates of them since the Blue Book 2014.
SNA 2008 and ESA 2010 require different treatments of the consumption of fixed capital on terminal costs, however, in both cases, the GFCF expenditure on them is recorded in the period in which the transfer cost is incurred (normally at the end of the asset’s life). In SNA 2008 the consumption of fixed capital is recorded over the life of the asset on which the terminal cost will apply and therefore before the expenditure occurs. This is described in the SNA paragraph 10.161:
“Terminal costs should therefore be written off over the whole life of the asset, regardless of the number of owners during the life of the asset. Immediately before the disposal, the value of the asset will have a negative value which is reduced to zero when the terminal costs incurred are treated as gross fixed capital formation. The apparent oddity of an asset with negative value reflects the fact that the owner not only could not sell it but would have to pay another unit to take over responsibility for the asset.”
In contrast, ESA 2010 requires that the consumption of fixed capital is recorded during the period in which the expenditure occurs. This can be found in the ESA paragraph 3.139:
“Consumption of fixed capital covers anticipated terminal costs, such as the decommissioning costs of nuclear power stations or oil rigs or the cleanup costs of landfill sites. Such terminal costs are recorded as consumption of fixed capital at the end of the service life, when the terminal costs are recorded as gross fixed capital formation.”
The UK is subject to the ESA requirements as members of the European Statistical System, and as a result terminal costs related to nuclear decommissioning are written off as consumption of fixed capital in the period in which they occur. This means that even if the market value of the asset is negative, it won’t be under national accounts definitions.
Conceptually, the SNA (2008) treatment more fully reflects the costs of using assets such as oil rigs or nuclear reactors and the factors that will direct the economic actor into his investment decision; however, the data requirements needed to do this are onerous. The national accounts would need an estimate, in the prices of the current period, of what the terminal costs will be and it is highly likely that this would be revised over the life of the asset as more information and changes in the technology used to deliver the decommissioning service become available.
3.9 Stock and flow measures of transfer costs
Non-financial assets, in particular fixed assets, represent various stocks and flows in the national accounts. This is described in the OECD (2009) manual on measuring capital. These include the flow of expenditure on fixed assets through GFCF, which accumulate in the stock of fixed assets present on the non-financial balance sheet. From this stock there are other flows including other changes in the volume of assets, the consumption of fixed capital and capital services. These are described in turn in this section.
3.9.1 Transfer costs as gross fixed capital formation and capital account
The focus of this note is on capturing transfer costs on produced and non-produced non-financial assets as a flow as part of the purchase price of acquisitions of non-financial assets. As noted elsewhere, when an existing or new asset is transacted, the purchaser capitalises the transfer costs they incur and those incurred by the seller, as value to the seller is the basic price minus transfer costs they have paid. Transfer costs can be incurred and capitalised by any institutional unit and on any produced or non-produced asset. When transfer costs are incurred on produced assets, the capital account includes them in the value of the produced asset on which they were incurred. When they are incurred on non-produced assets, they are recorded separately under the heading “Transfer costs on non-produced non-financial assets”, except in the case of land, where they are recorded as land improvements.
3.9.2 Stock measures of transfer costs and balance sheets
While in the capital account, only expenditure on transfer costs for produced assets are integrated in the value of those assets. In the non-financial balance sheets, this is also the case for non-produced assets. In order to do this, the value of the transfer costs must be accumulated over the time that the owner holds the asset. This requires use of the perpetual inventory model (OECD, 2009), which requires estimates of the average life length, in this case, the time the institutional unit owns the non-produced asset in question. For example, if an institutional unit purchases land and intends to own it for 10 years, then the transfer costs paid on this land will be considered to be part of the stock of transfer costs on the asset for 10 years. This stock of transfer costs is integrated with the value of the non-produced asset on which it is based, as conceptually, it is part of the value of the asset.
3.9.3 The consumption of fixed capital on transfer costs
In the example in section 3.9.2, over the 10 years the institutional unit owns the land, the transfer costs paid on it will be subject to the consumption of fixed capital. This reflects that the value of the benefits to be enjoyed by the user of the asset as a result of paying the transfer costs decline as they approach the time that the asset is disposed of. It is also recommended in SNA2008 for produced assets that have many users over their economic life, such as transport equipment, that transfer costs are depreciated over the time the user expects to use the asset, as the benefits from this payment are used up by the time another owner pays additional transfer costs.
Conceptually this treatment would provide additional coherence between the values of disposals and re-acquisitions, however, the data collection required to implement it is would have a high respondent burden and would likely be based on assumptions on ownership periods. It is worth noting that a similar case could be used for distributors’ trading margins on, for example, cars, which should be fully written off by the time a second owner takes possession. As noted in section 3.8 of this article, transfer costs on terminal costs require a different treatment.
3.9.4 Other changes in the volume of assets on transfer costs and revaluation
Other changes in the volume of assets include catastrophic losses, uncompensated seizures, reclassifications and economic appearance and disappearance of assets, as well as other changes in volume not elsewhere classified. These in general, reflect changes in assets which were not anticipated by the user of the asset and are therefore not included in the consumption of fixed capital. For example, major damage from a natural disaster or a very serious industrial accident will be classified as catastrophic losses. The item of this account most likely to affect transfer costs is the reclassifications item. If an asset, such as land or a building, is reclassified, the remaining value of associated transfer costs should also be reclassified. In the case of a building that is sold due to bankruptcy, then the remaining transfer cost should be written off as a catastrophic loss.
Revaluations reflect that balance sheets are recorded at the current prices of a particular period and that this value may change due to holding gains or losses. These gains or losses reflect changes to the price of a particular unit of a good or service and in the case of transfer costs, can be calculated using price indices of the services purchased.
3.9.5 Capital services from transfer costs
Capital services represent the flow of services into the production of output that come from using the assets on the non-financial balance sheet. The concepts and estimation methods are described in great detail in chapter 20 of the SNA (2008) and in more detail in OECD (2010).
Land and other non-produced assets provide capital services in a way similar to produced assets, the principal difference is that non-produced assets do not have finite lives, at least when they are under good management. This means that the user cost formula used to estimate the price of capital services from non-produced assets doesn’t include a term for the consumption of fixed capital. It is therefore a function of holding gains or losses on the asset, the rate of return the asset is expected to furnish for its user and the price of the asset.
An added complication, however, is transfer costs on the non-produced asset, which are part of the value of the non-produced asset and are represented as such in the non-financial balance sheet. As discussed in 3.9.3, these are produced and consumption of fixed capital applies to them. It is possible to estimate the price and volume of capital services from transfer costs on non-produced assets using the methods used for fixed assets and to aggregate these with the capital services from the non-produced assets on which the transfer costs are related. For presentational purposes, capital services from non-produced assets should be shown as the aggregate of these 2 components to provide consistency with the conventions of the non-financial balance sheet.
Back to table of contents5. Data sources and methodology within the UK
4.1 Current method
As discussed in section 3.1, transfer costs are only included in the valuation of non-financial assets. To read further on transfer costs of financial assets, please see Appendix A.
4.1.1 Transfer costs on produced non-financial assets
Produced non-financial assets are assets that have come into existence as outputs from processes that fall within the production boundary of the national accounts. Non-financial assets include fixed assets, inventories and valuables and this section focuses on transfer costs on fixed assets. In the UK, business surveys are used to estimate expenditure on fixed assets by private sector institutional units. The historical capital expenditure questionnaire notes stated that returns should:
“Include:
The amounts entered should include the purchase costs and disposal proceeds of fixed assets, together with any other amounts treated as capital items for taxation purposes.
Exclude:
All expenditure relating to the purchase and disposal of land and existing buildings.”
While it may be reasonable to assume that respondents will include transfer costs as part of their purchase costs, it is less likely that they would interpret the meaning of disposal proceeds to exclude transfer costs. Therefore, it is likely that the disposal value returned by respondents is at market prices as these would be readily available to the respondent via their asset register. If this is the case, gross fixed capital formation (GFCF) will be underestimating transfer costs for produced assets, as explained in section 3.5. An explanation for the exclusion of existing buildings and land is given in section 4.2.1, as buildings are fixed assets, whether new or used, and should by definition be included.
The Quarterly Acquisitions and Disposals of Capital Assets Survey (QCAS) has been used as the primary source of capital expenditure data since the first quarter (January to March) of 2015. This provides more detailed notes to indicate what respondents should include and exclude from their entries:
“Include:
- assets within the UK
- assets that are used repeatedly to facilitate production, or provision of services, for more than one year
- the purchase costs and disposal proceeds of fixed assets, together with any other amounts treated as capital items for taxation purposes
- the total capital value of assets that have been bought on hire purchase in the period covered by the survey
- assets acquired under finance lease, that is, where you (the lessee) and responsible for repairs and maintenance
- assets owned by the business but leased to another business under an operating lease, that is, where you (lessor) are responsible for repairs and maintenance
- any trade or transfer costs invoiced to you separately
- non-deductible VAT
- expenditure on replacing assets destroyed in circumstances (for example, fire), which have given rise to a successful insurance claim
- expenditure on assets acquired for hiring, renting or other leasing purposes, but not financial leasing
- capital expenditure at any site belonging to the business where operations have not yet begun
- grants and allowances from government sources, statutory bodies or local authorities that have been used to acquire or create assets used in production
- finance relating to public private partnership or private finance initiative that has been used to acquire assets
- progress payment or deposits covering long-term contracts acquiring fixed assets
- all work of a capital nature carried out by your own staff, including labour costs and the cost of purchases consumed in the work
- professional charges, installation costs and other services associated with capital assets must be reported with the asset value
Exclude:
- assets outside the UK
- assets acquired in taking over an existing business or sold as part of a going concern
- assets of a capital nature acquired for re-sale rather than for use within the business, for example, stocks of vehicles held by motor traders
- assets like TV adverts or copyrights
- software licences of up to one year
- assets leased to another business under finance leases, that is, where repair and maintenance are carried out by the other business (lessee)
- assets acquired under an operating lease, that is, where responsibility for repair and maintenance are borne by the owner (lessor) or the asset
- asset transfers between businesses owned by the same enterprise (except where the asset value is considered to be a ‘new’ acquisition or disposal within the company accounts)
- interest and installment payments under finance leasing agreements
- deductible VAT
- capital expenditure on assets for use outside the UK (except ships and aircraft)
- allowances for depreciation
- the proceeds from an insurance claim against the loss of fixed assets”
This more detailed description of the items to be included in the value of produced assets is likely to improve the quality of the estimates for acquisitions, as examples are given for the types of services to be included in the value of an asset, as well as taxes paid. It is still, however, not completely clear that the value of disposal proceeds should exclude the services included in transfer costs, or that the asset itself is valued at basic prices. It is, however, unlikely that the accounting procedures used by respondents would result in the information needed to value disposal proceeds in this way being readily available1.
It is therefore likely that disposal proceeds are overestimated by the amount of transfer costs on the disposals of produced assets. If this is the case, it will result in GFCF being underestimated, as the amount netted off acquisitions will be too high.
It is likely, in particular from the introduction of the QCAS survey with the expanded notes to more comprehensively detail the items to be included by respondents, that transfer costs on acquisitions are being adequately captured in the estimates of GFCF in current prices. As they cannot currently be separately identified from the value of the asset on which they have been used in connection with, it is less likely that the price indices used for volume indices of transfer costs are not representative. It is also possible, where assets have multiple owners in their useable lives that transfer costs do not appropriately feature estimates of the consumption of fixed capital or balance sheet estimates. This is because transfer costs should be written off fully over the time their current owner holds them. The data required to make these distinctions are currently not available.
As noted in 3.8.2, transfer costs on produced assets should be integrated with the value of the assets on which they have occurred in the balance sheets. This requires that they can be separately identified and that other parameters such as average life lengths and price indices are available (respectively, so that they can be written off appropriately and re-valued to current prices for accumulation). This information is not currently available in the UK and in the calculation of balance sheets, the PIM assumes that transfer costs have a life length equal to the asset on which they have occurred.
4.1.2 Transfer costs on non-produced non-financial assets
Non-produced assets are assets that have not been produced within the production boundary, such as natural resources, contracts, leases and licences, goodwill and marketing assets. For these assets, transfer costs are separately recorded as they represent a form of production but cannot be integrated with the value of any other produced asset in the capital account (see section 3.3). An exception to this is transfer costs on land, which by convention should be treated as land improvements as they fit the definition of increasing the value of land. The current treatment in the UK, however, is that these costs are included in the value of transfer costs on non-produced non-financial assets, rather than as land improvements.
Currently land is the only non-produced non-financial asset for which transfer costs are collected in the UK National Accounts. There are numerous data inputs used to estimate this, such as land registration fees from the Land Registry Office, Stamp Duty, legal fees and agents’ commissions from HM Revenue and Customs and housing and construction estimates from Department for Communities and Local Government (DCLG).
Within the Blue Books published since 2000, GFCF includes negative transfer cost data for non-produced non-financial assets in 3 institutional sectors: financial corporations; central government; and local government. As we have shown, the buyer of the asset capitalises the transfer costs they have paid as well as those the seller has paid, so are therefore necessarily positive. Since 2010 onwards, the sector breakdown is based on historic proportions.
4.2 Improving the understanding and recording of transfer costs
4.2.1 Improving recording of transfer costs for produced non-financial assets
The current approach to recording transfer costs on acquisitions for produced non-financial assets in current prices is adequate, however, further work is required to ensure that transfer costs on disposals are appropriately captured and that they can be separately identified.
As noted in section 4.1.1, land and existing buildings are not included in the survey used to estimate expenditure on fixed assets. The reason for this exclusion comprises 2 parts, firstly, that the information required to separate the value of an existing building from the value of the land on which it sits is not normally available, as the market price will normally be for the combined property: the building and the land. Secondly, over the whole economy, these transactions should net to zero except for the costs of ownership transfer on them and these are separately estimated and recorded.
Despite this, GFCF includes expenditure on existing fixed assets and this should include existing buildings (as a produced asset) and exclude land (as a non-produced asset). The current approach means that intra-industry or sector acquisitions and disposals are not observed, affecting the industry and sector breakdown of balance sheets. At least in principle, a method could be used to separate these values, such as a residual or land to structure ratio approach.
To get improved estimates of transfer costs on produced non-financial assets, a data source would be required that would make them separately identifiable. However, to do this would be expensive for us and burdensome for respondents. A more realistic approach is to clarify in the survey notes that disposal proceeds for assets should not include transfer costs.
An alternative approach may involve collecting data on transfer costs on particularly high value assets from a detailed survey such as the Annual CApital expenditure Survey (ACAS). This would involve asking, for example, about transfer costs on aircraft, ships and boats and large, high value equipment used in the extractive industries. Alternatively, a supply side approach could be used where it is assumed that installation and other particular services are used primarily to transfer assets and the output of these units could be assumed to be equal to the value of the transfer cost and assumptions could be used to apportion this to acquisitions and disposals of assets.
Another approach would be to utilise more data from the supply side. For example, the products of the European community (PRODCOM) survey collects highly detailed data on types of installation services for specific types of machinery. Similarly it may be possible to collect data from legal and real estate firms on their turnover from services related to transactions in land, buildings and dwellings. As some of the data required to do this are available, this is a recommendation of this note.
4.2.2 Improving recording of non-produced non-financial assets
As previously discussed, in the UK there are 2 major surveys used to collect data on fixed assets. The Annual Business Survey (ABS) and the Quarterly Survey of Capital Expenditure (QCAS) require respondents to return data for acquisitions at purchasers’ prices and disposals at basic prices.
A new method will be used in Blue Book 2017 to estimate the breakdown of transfer costs by institutional sector, which will assume that those components where administrative sources are used, such as Land Registry fees and Stamp Duty, are proportionally assigned to institutional sectors based on the pattern of acquisitions of dwellings and other buildings and structures.
The ABS now collects information on expenditure on transfer costs on land by private sector institutional units. This information can be used to estimate components of transfer costs on land other than Stamp Duty and Land Registry fees. We aim to use these data in estimating transfer costs for private sector institutional units once a sufficient number of years of data have been collected.
4.2.3 Alternative sources and compilation methods
As discussed in this note, currently only transfer costs on land are included in the UK estimates of transfer costs on non-produced non-financial assets, where these should be included in land improvements. This means that transfer costs on other non-produced assets, such as mineral reserves, contracts, leases and licences are not included. While no direct information is currently available from our business surveys for these assets, it may be possible to estimate them using percentage estimates on transactions in non-produced assets.
Another approach to estimating transfer costs would be a supply side approach. Such a method would involve estimating the output associated, for example, with legal fees for particular services, which are used as transfer costs.
4.2.4 Discussion on international manuals
Transfer costs issues are described within SNA 2008, OECD (2009) and ESA10. An Advisory Expert Group (AEG) paper was written in 2004 to aid the Inter Secretariat Working Group on National Accounts (ISWGNA) in reaching a decision on how transfer costs should be treated (see section 7: References). As part of the compilation of information for this note, aspects of transfer costs definitions would benefit from greater clarity within the international manuals. For example:
- the description and explanation relating to the links between the prices of products and the values of assets should be made explicit to make clear that the value of an acquisition of an asset includes many products, each at purchasers’ prices and that the value of disposals equals the asset at basic prices minus any transfer costs at purchasers’ prices
- a compilation guide or similar could provide information on countries’ practices of including transfer costs in their capital accounts, supply and use tables and balance sheets
- the convention around the treatment of transfer costs related to land could be re-considered to be consistent with the framework, or the reasoning made explicit, rather than asserted as a convention; for example, “…An exception is made in the case of land where costs of ownership transfer are treated by convention as land improvements.“ SNA 2008 (paragraph 10.97)
- an explicit expansion of the component parts using mathematical notation would be useful to show clarity in the calculation of total transfer costs; for example, that this is the addition of both buyer and seller transfer costs at purchasers’ prices
- alignment of the SNA 2008, and OECD (2009) information in respect to the use of purchasers’ prices; see discussion in section 3.6, for example, SNA 2008, page 202 compared with OECD (2009, page 124)
- guidance should be provided in regard to balance sheet measures of transfer costs on non-produced non-financial assets explicitly recommending, for example, how life lengths may be calculated and how estimates of capital services can appropriately treat these costs
4.3 Presentation of transfer cost information
Expenditure related to transfer costs on non-produced non financial assets are presented in chapter 9 of our annual Blue Book publication. As well as an estimate for the total economy, they are also broken down into 7 institutional sectors:
- private domestic and foreign-owned non-financial corporations
- public non-financial corporations
- financial corporations
- central government
- local government
- households
- non-profit institutions serving households
As discussed in section 4.1.2, the sectors are calculated based on the breakdown presented in Blue Book 2010. Transfer costs on produced, fixed assets are not identified separately from the assets to which they relate.
Notes for: Data sources and methodology within the UK
- It should also be noted that except for special cases, such as where an asset has a large terminal cost or where sellers by convention pay significant fees on real estate sales, that transfer costs on disposals are likely to be significantly smaller than those on acquisitions of assets.
6. Impact of improving the recording and presentation of transfer costs
Changing the way in which the UK records and presents transfer costs will change overall estimates of gross fixed capital formation (GFCF), as well as institutional sector and industry breakdowns. At the total level, there are likely to be 2 underestimates. For non-produced assets, the UK currently treats transfer costs as a net concept, that is, acquisitions minus disposals. As this note has highlighted, the transfer costs on disposals should in fact be added to those on acquisitions. For produced assets, it is likely that survey respondents are overstating disposals by including transfer costs, which will lead to an underestimate of acquisitions less disposals figures.
There will be a change to the historic sector breakdown, where negatives for sector estimates will be removed and up-to-date survey data used to estimate a new sector breakdown.
The application of the national accounts publication revision policy will mean that impacts will not be observed until the publication of Blue Book 2017.
Back to table of contents7. Summary
This note has described fundamental aspects related to the calculation and treatment of transfer costs from a conceptual perspective and as used within the national accounts. The issues discussed in this note are a response to those raised within the context of the National Statistics Quality Review (2014) but go wider, describing how transfer costs are treated throughout the sequence of accounts, including the non-financial balance sheets, as well as how they feature in supply and use tables.
In summary:
The current approach to including transfer costs on acquisitions of produced non-financial assets in current prices is adequate within the UK National Accounts – in particular, the Quarterly Acquisitions and Disposals of Capital Assets Survey (QCAS) better identifies the items of expenditure to be included in the value of assets acquired than its predecessor.
Available data from supply side sources, such as from the PRODCOM Survey, should be investigated in order to estimate a breakdown of transfer costs on produced assets, such as installation services, legal and real estate fees.
Further development work is required to capture other elements of transfer costs on produced assets, including transfer costs on disposals of produced assets, price indices used to estimate volume measures and additional assumptions used to estimate the consumption of fixed capital and balance sheet estimates. This requires that estimates of transfer costs on produced assets can be separately identified, which is currently not available.
Transfer costs for produced non-financial assets cannot be separately identified from the collected capital expenditure data due to how the data are collected.
The way that sectorised transfer costs relating to non-produced non-financial assets are calculated will be addressed in Blue Book 2017, with changes and impact communicated in a separate article. This will ensure that sectors remain non-negative and capitalised only for the purchaser of the non-produced asset.
Transfer costs on land should be removed from transfer costs on non-produced non-financial assets and added to land improvements. This will be implemented in a future Blue Book.
Transfer costs on non-produced non-financial assets should be integrated into the value of their associated non-produced non-financial asset in the non-financial balance sheets. This will be done as part of the ongoing programme of work to develop capital stock measures.
8. References
Eurostat, Statistical Classification of Products by Activity, 2008.
European System of Accounts, ESA 2010
National Statistics Quality Review: Review of National Accounts and Balance of Payments, July 2014
OECD (2009) Measuring Capital: OECD Manual, Second edition.
System of National Accounts, 1998 SNA update information – Cost of ownership transfers.
United Nations, System of National Accounts (SNA 2008).
Back to table of contents9. Appendix A: Transfer costs of financial assets (and liabilities)
Financial assets consist of all financial claims, shares or other equity in corporations plus gold bullion held by monetary authorities as a reserve asset. A liability is established when one unit is obliged, under specific circumstances, to provide a payment or series of payments to another unit. The valuation of financial transactions does not include any cost of ownership transfer. This is confirmed in the following extract from the SNA 2008:
“Transactions in financial assets and liabilities are recorded at the prices at which they are acquired or disposed of. Transactions in financial assets and liabilities should be recorded exclusive of any commissions, fees, and taxes whether charged explicitly, included in the purchaser’s price, or deducted from the seller’s proceeds. This is because both debtors and creditors should record the same amount for the same financial instrument. The commissions, fees, and taxes should be recorded separately from the transaction in the financial asset and liability, under appropriate categories. The valuation of financial instruments, which excludes commission charges, differs from the valuation of non-financial assets, which includes any costs of ownership transfer.”
(SNA08, page 51, paragraph 3.122)
Back to table of contents