Table of contents
- Main points
- Executive summary
- Introduction
- Summary of methodology improvements impacting sector and financial accounts
- Indicative impact on the sector and financial accounts of methodological and other improvements
- Appendix A: Indicative estimates to net lending or net borrowing by sector
- Appendix B: Contributions to revisions to estimated net lending or borrowing and net worth to selected sectors, by transaction
1. Main points
The year-on-year growth rate of real household disposable income (RHDI) in 2016 has been revised down from 0.0% to negative 0.2% compared with that previously published; making it the first year of negative RHDI growth since 2011 when it was negative 1.7%.
The historically low household saving ratio in 2016 has been revised down from 7.0% to 6.6%; making it the outright lowest since 1971.
The UK is less of a net borrower than previously estimated following an average downward revision to the non-financial net borrowing position of £3.4 billion a year between 1997 and 2016.
UK sectors were net lenders of £0.1 billion in 1997 for the only time since records began in 1987.
Financial corporations saw their net lending or borrowing position impacted the most by UK National Accounts, The Blue Book 2018 improvements; between 1997 and 2016, it was revised up by an average of £2.6 billion a year compared with previously published data – meaning that they borrowed less to fund their economic activity than previously estimated.
2. Executive summary
This article explains the main methodological improvements that will be introduced in Blue Book 2018 and Pink Book 2018 for the sector and financial accounts and covers the period 1997 to 2016. It also summarises the indicative impact to each sector as a result of improvements made in this latest iteration of Blue Book.
The UK Quarterly National Accounts: January to March 2018 to be published on 29 June 2018 will be consistent with Blue Book 2018 and Pink Book 2018.
Summary of main impacts due to Blue Book 2018 changes
The net borrowing position of total UK sectors in the non-financial account (a position where borrowing is required to fund all non-financial economic activity undertaken by UK sectors) was revised down by an average of £3.4 billion a year between 1997 and 2016 following over 10 methodological improvements; meaning that the UK borrowed less from the rest of the world sector than previously estimated. As a result, UK sectors were net lenders of £0.1 billion in 1997 for the only time since records began in 1987.
Blue Book 2018 improvements had a 0.0% impact, on average, on the annual growth rate of real household disposable income (RHDI) between 1997 and 2016. However, the year-on-year growth rate of RHDI for 2016 has been revised down from 0.0% to negative 0.2%, making it the first year of negative RHDI growth since 2011 when it was negative 1.7%. This downward revision is due to a 0.1 percentage points upward revision of the growth in prices experienced by households in 2016 and the 0.1 percentage points downward revision on the growth of gross disposable household income.
The household saving ratio has been revised by an average of 0.0 percentage points a year between 1997 and 2016. However, for 2016, the joint lowest saving ratio of 7.0% since 1971 has been revised down to 6.6%; making it outright the lowest saving ratio since 1971, at that point.
Among the UK sectors, financial corporations saw their net lending or borrowing position impacted the most following Blue Book 2018 changes. Their position in the non-financial account has been revised up by an average of £2.6 billion a year compared with the previously published figure, due mainly to changes in the recording of net spread earnings.
Summary of main improvements in Blue Book 2018
The improvements to the calculation of employee pension schemes had the broadest impact to the sector and financial accounts; the most significant impacts are on households and local government. The improvement was the main contributor to downward revisions on the net lending or borrowing position of households (by an average of £1.0 billion a year) and upward revisions to the net lending or borrowing position of local government (by an average of £0.8 billion a year) between 1997 and 2016.
Improvements to the calculation of net spread earnings had a large but narrower impact on the sector and financial accounts. The improvements impact from 2004 onwards and only for private non-financial corporations, financial corporations, households and the rest of the world sectors.
Further improvements continue to be made to the households and non-profit institutions serving households split; a major improvement made in UK National Accounts, The Blue Book 2017.
There were also other improvements that had no net impact on the net lending or borrowing of UK sectors; such as Corporation Tax and improvements to the estimates of housing associations.
Section 4 goes into greater detail of each Blue Book 2018 improvement.
Back to table of contents3. Introduction
This article is part of a series describing changes to national accounts, detailing the improvements made to UK National Accounts, The Blue Book 2018 and Pink Book 2018 to ensure that the UK National Accounts continue to provide the best possible framework for analysing the UK economy and for comparing it with those of other countries. It details estimates of the indicative impact of changes that will be introduced when revised figures for the quarterly gross domestic product (GDP), sector and financial accounts (SFA) and balance of payments (BoP) consistent with Blue Book and Pink Book 2018, are published on 29 June 2018 in the UK Quarterly National Accounts.
An initial summary of the planned changes for Blue Book and Pink Book 2018 was announced in the article National Accounts articles: Latest developments to UK National Accounts and Balance of Payments – changes to be implemented for Blue Book and Pink Book 2018, published on 4 December 2017. This article brings together the methodological and data improvements that impact on the financial and non-financial transactions of sectors for the period 1997 to 2016.
The figures presented in this article are indicative estimates while final quality assurance is being undertaken. Indicative impacts have been given for the non-financial accounts, financial accounts, financial balance sheets and main economic indicators such as the household saving ratio and real household disposable income. The remainder of the article is structured as follows:
Section 4 – describes the changes and provides links to tables showing the indicative overall average impacts and revisions to the net lending or borrowing and other main aggregates in the non-financial account, financial account and financial balance sheets by transaction and sector
Section 5 – provides indicative impacts on the net lending or net borrowing of the institutional sectors as a result of the improvements made in Blue Book 2018
Appendix A – provides charts showing the indicative estimates of the net lending or borrowing for the non-financial account, financial account and financial balance sheets, showing the impact of the changes to all sectors
Appendix B – provides charts showing the indicative estimates of contributions to revisions to estimated net lending or net borrowing and net worth to selected sectors, by transaction
4. Summary of methodology improvements impacting sector and financial accounts
This section discusses the methodological improvements undertaken in Blue Book 2018 that affect the sector and financial accounts. Some of these changes were first described in National Accounts articles: Impact of Blue Book 2018 changes on current price gross domestic product estimates, 1997 to 2016, on 13 April 2018. Other new improvements affecting sector and financial accounts are also included in the following sub-sections.
Revisions throughout the published time series are mainly because of implementing the improvements described in this article. Indicatively, revisions between 1997 and 2013 (the closed period) will be exclusively from methods changes. The years 2014 to 2016 (the open period) are fully open for revisions to incorporate new data from sources.
The accompanying dataset summarises the impact from the Blue Book 2018 improvements by transaction line for greater detail on indicative impacts.
Most significant improvements
Net spread earnings
Some companies make a return by trading in financial assets. They buy assets at a price that is typically lower than the prevailing market price and sell them at a price that is typically above the market price. These margins (or differences) together are referred to as net spread earnings (NSE). In the national accounts, NSE are considered to be the value of the production and income associated with this trading. NSE do not include the income that comes from the ownership of these assets (that is, dividends), therefore, estimates for this aspect are unaffected by this change.
Since its introduction in 2004, the Bank of England has collected NSE generated from trading in foreign exchange, securities and derivatives using its Profit and Loss (PL) form. This collection of NSE has proved challenging as the reporting units are not required to report under financial regulations. The closest concept is trading profits, which encompasses other types of income alongside NSE. The Bank of England has emphasised recently the importance of these data and targeted some of the main reporters to ensure that NSE are reported correctly. This has led to more comprehensive coverage and revisions to our estimates.
The majority of trading that generates NSE is with the rest of the world sector and results in an increase in exports of services across all years. Annex C of the Impact of Blue Book 2018 changes on current price gross domestic product estimates article shows the Blue Book 2018 net trade position. In addition to the NSE change there are also smaller impacts on the net trade position from the development of the trade in goods processing system (see later in this section) and the usual take-on of updated data for 2014 to 2016 and the subsequent supply and use balancing process.
Sectors affected by this change: private non-financial corporations, financial corporations and households.
Gross fixed capital formation – purchased software
A change was made in Blue Book 2017 to correct the estimation of elements of purchased software, which were being double-counted from 2001 onwards, along with discrepancies in the modelled data prior to 2001. During further quality assurance, it was identified that this adjustment did not fully address the issue and an additional amendment to other machinery and equipment, and information and communication technology (ICT) equipment was required. Purchased software is unaffected by this additional amendment.
Pension schemes
Improvements have been made to the data and methods used to calculate figures for funded public sector employee pensions in the financial corporations sector, where the employer or “pension manager” is in local government or central government. These changes follow on from decisions made by our Economic Statistics Classification Committee (ESCC) and improve the method for calculating employer-imputed social contributions, as defined in the European System of Accounts 2010: ESA 2010.
Employer-imputed social contributions reflect any shortfall in actual contributions received as well as possible experience effects, where the outcome differs from the modelling assumptions. The improved method will calculate employer-imputed social contributions to funded defined benefit pension schemes as a residual after accounting for balances, transactions and other flows on an actuarial basis, whereas the current method involves modelling them as a percentage of wages and salaries.
As a result of these changes:
the estimate of compensation of employees has changed – this affects the current price value of government output, of which compensation of employees is a component; the majority of government output is provided free of charge or sold at economically insignificant prices and is therefore valued by summing the costs of production
the estimate of the pension scheme service charge has changed – this affects market output for the financial corporations sector
These improvements to funded public sector employee pension schemes were implemented to the public sector finances in September 2017 and have also been discussed in the methodology article accompanying the release of Table 29: Accrued-to-date pension entitlements in social insurance (specifically the text relating to Column E).
Sectors affected by this change: private non-financial corporations, financial corporations, general government, households, and non-profit institutions serving households.
Trade in goods and services processing systems
Blue Book 2018 will include enhancements to the processing of UK trade data. As outlined in the UK Trade Development Plan, a new processing system for trade in goods data has been developed. The new system has been built to provide faster and more streamlined processing for the monthly UK trade statistics, as well as the production of quarterly and annual trade statistics for other national accounts publications. This will enable more detailed analysis of trade statistics. In particular, the new trade in goods system will provide more granular data for analysis – commodity by country on a balance of payments basis. The system will also be flexible to support future improvements to methods and data sources.
On aggregate, the impact on gross domestic product (GDP) and net trade compared with the previous system is generally small. There is some impact at the more detailed level and to gross imports and exports. These changes arise mainly from processing data at a more granular level, but also a review of historical national accounts conceptual adjustments. Further details were published in the article UK trade data impact assessment from new developments on 8 May 2018.
Sectors affected by this change: private non-financial corporations, financial corporations, households, and non-profit institutions serving households.
Smaller improvements
Rail for London
In Blue Book 2018, we have implemented the reclassification of Rail for London (RfL) from the local government sector to the public corporations sector. This reclassification is effective from April 2011.
In addition to the implementation of the reclassification of RfL, in Blue Book 2018 we have made other improvements to the data relating to the Transport for London group. Notably revenue received by Tube Lines Ltd, which is classified to the local government sector, is now included in the category payments for non-market output. During a review of Transport for London data it was identified that this revenue was not previously included.
Sectors affected by this change: public corporations and local government.
Government alignment
Government alignment improves the alignment between the UK National Accounts and government finance statistics (GFS). GFS datasets usually incorporate latest data and methodological changes affecting the public finances ahead of national accounts, owing to an unrestricted revisions policy. Included in this year’s alignment are changes in payments to the Financial Services Compensation Scheme, payments of National Non-Domestic Rates and, as previously mentioned, Corporation Tax and Rail for London.
Furthermore, payments of Motor Vehicle Duty (MVD) have been revised further following changes implemented in Blue Book 2017 to split the tax between other taxes on production and other current tax as a result of the separation between the households sector and non-profit institutions serving households sector.
These changes improve the alignment between the UK National Accounts and public sector finances data as published in the August 2017 release (published in September 2017).
Sectors affected by this change: all UK sectors.
Housing associations
In Blue Book 2018, we have implemented the reclassification of registered social landlords and housing associations in Scotland, Northern Ireland and Wales (“devolved housing associations”) from the private non-financial corporations sector to the public corporations sector. This reclassification is effective from July 2008.
In Blue Book 2017, we implemented the reclassification of “private registered providers” of social housing in England (“English housing associations”) to the public corporations sector. In November 2017, following changes to the regulation of social housing in England, English housing associations were reclassified back into the private non-financial corporations sector. This reclassification has been implemented in Blue Book 2018 from November 2017, the date the regulations came into force.
These changes bring the national accounts into alignment with public sector finances, which implemented the reclassification of devolved housing associations in the January 2017 release (published in February 2017) and English housing associations in the November 2017 release (published in December 2017).
Blue Book 2018 also includes revisions to compensation of employees and offsetting intermediate consumption for public corporations and for private non-financial corporations due to improvements in estimates for English housing associations. This last change has no impact on gross operating surplus, net borrowing or the public sector finances.
Corporation Tax
Historically, we have been using cash receipts for the Corporation Tax and the Bank Surcharge as a proxy for accrued revenue. Our improved methodology derives accrued revenue figures by adjusting cash receipts to more accurately reflect the time at which the economic activity took place, in line with international guidance.
The improvements were implemented in the February 2017 public sector finances statistical bulletin. More information about this change is available in the methodological article explaining Improvements to accruals methodology for Corporation Tax, Bank Corporation Tax Surcharge and the Bank Levy: 2017.
Sectors affected by this change: non-financial corporations, financial corporations and central government.
On a UK aggregate level, this improvement has no net impact.
Listed shares change
The listed shares change is a further improvement to the households and non-profit institutions serving households (NPISH) estimates. This change improved the calculation of the NPISH-quoted UK asset level, impacting households’ asset level and has altered the split between the sectors leading to revisions from 1997 to present.
Sectors affected by this change: non-financial corporations, financial corporations, households, and non-profit institutions serving households.
Other household/NPISH improvements
Further to the work to separate the household and NPISH sectors in Blue Book 2017, we have continued to enhance both accounts wherever possible.
In some cases, significant improvements were made to certain transaction lines. To distinguish these larger impacts from the other household and NPISH improvements, we have highlighted them where appropriate (for example, as F32N56 double-counting fix and F424N1 sign reversal improvement).
Revisions to these sectors also reflect the inclusion of updated data that became available too late in the production of the previous Blue Book to be included in the published tables.
Sectors affected by this change: all UK sectors except central government.
Back to table of contents5. Indicative impact on the sector and financial accounts of methodological and other improvements
Understanding and using the charts
In some instances, the Blue Book 2018 impacts on the sector and financial accounts are very small and difficult to see at first glance. To focus in on the smaller impacts, click on the labels of the larger series to hide them. The chart will then change the interval of the axis to show the minor impacts.
Estimates of the impact on net lending or borrowing by sector
This article provides indicative impacts on the net lending or net borrowing of the institutional sectors.
The following section sets out the average indicative impact between 1997 and 2016 of all improvements introduced this year on the sector and financial accounts.
Figure 1 shows the indicative Blue Book 2018 revisions to net lending or borrowing positions as a percentage of revised gross domestic product (GDP) between 1997 and 2016.
Financial corporations have seen the largest impacts, mostly in the latter years (2010 onwards) as a result of improvements to net spread earnings (NSE), as previously stated in Section 2.
Figure 1: Indicative Blue Book 2018 revisions to net lending or borrowing positions as a percentage of revised gross domestic product, 1997 and 2016
Source: Office for National Statistics
Download this chart Figure 1: Indicative Blue Book 2018 revisions to net lending or borrowing positions as a percentage of revised gross domestic product, 1997 and 2016
Image .csv .xlsTable 1 sets out the indicative nominal average impact of the changes on the non-financial accounts, the financial accounts and financial balance sheets for 1997 to 2016, when revised figures for the UK National Accounts, consistent with Blue Book 2018 and Pink Book 2018, are published on 29 June 2018 in the UK Quarterly National Accounts. It also shows the indicative impact as a percentage of revised GDP.
Appendix A gives greater detail on the revisions shown in Table 1.
Table 1: Latest indicative average impact of the changes to the net lending or net borrowing for the UK non-financial account, net lending or net borrowing for the financial account and financial net worth from the balance sheets
| UK, 1997 to 2016 | ||||
| Average impact of the changes 1997 to 2016 | ||||
| Sector | Total Impact upon net lending/borrowing from the non-financial account (B.9N) | |||
|---|---|---|---|---|
| £billion | % of GDP | |||
| Methodological changes | Data revisions separate to methodological changes | Indicative average revision to net lending (+) or borrowing (B.9N) | Indicative average revision to net lending (+) or borrowing (B.9N) | |
| Public corporations | -0.2 | 0.0 | -0.2 | -0.1 |
| Private non-financial corporations | -1.0 | 0.8 | -0.2 | 0.1 |
| Financial corporations | 2.9 | -0.3 | 2.6 | 1.4 |
| Central government | 1.1 | -0.3 | 0.8 | 0.5 |
| Local government | 0.9 | 0.0 | 0.9 | 0.5 |
| Households | -0.2 | 0.0 | -0.2 | -0.1 |
| Non-profit institutions serving households (NPISH) | -0.6 | -0.1 | -0.7 | -0.6 |
| Rest of the world | -3.4 | 0.0 | -3.4 | -2.0 |
| Sector | Total Impact upon net lending/borrowing from the financial account (B.9F) | |||
| £billion | % of GDP | |||
| Methodological changes | Data revisions separate to methodological changes | Indicative average revision to net lending or net borrowing for the financial account (B.9N) | Indicative average revision to net lending or net borrowing for the financial account (B.9N) | |
| Public corporations | -0.2 | 0.0 | -0.2 | -0.1 |
| Private non-financial corporations | -0.3 | 0.0 | -0.3 | -0.2 |
| Financial corporations | 0.2 | -1.2 | -1.0 | -1.0 |
| Central government | 0.5 | 0.3 | 0.8 | 0.5 |
| Local government | 0.8 | 0.1 | 0.9 | 0.5 |
| Households | 1.8 | -1.2 | 0.6 | 0.8 |
| Non-profit institutions serving households (NPISH) | -0.5 | -0.3 | -0.8 | -0.5 |
| Rest of the world | 0.1 | 0.0 | 0.1 | 0.0 |
| Sector | Total Impact upon financial net worth from the balance sheets (BF.90) | |||
| £billion | % of GDP | |||
| Methodological changes | Data revisions separate to methodological changes | Indicative average revision to financial net worth (BF.90) | Indicative average revision to financial net worth (BF.90) | |
| Public corporations | -2.3 | 0.0 | -2.3 | -1.3 |
| Private non-financial corporations | -48.1 | 0.4 | -47.7 | -30.0 |
| Financial corporations | -5.1 | -1.9 | -7.0 | -4.5 |
| Central government | 11.0 | 1.1 | 12.1 | 7.1 |
| Local government | 32.8 | -0.8 | 32.0 | 23.6 |
| Households | 19.5 | -0.8 | 18.7 | 8.4 |
| Non-profit institutions serving households (NPISH) | -3.9 | 3.1 | -0.8 | -0.5 |
| Rest of the world | 0.5 | -2.1 | -1.6 | -0.9 |
| Source: Office for National Statistics | ||||
Download this table Table 1: Latest indicative average impact of the changes to the net lending or net borrowing for the UK non-financial account, net lending or net borrowing for the financial account and financial net worth from the balance sheets
.xls (39.9 kB)Impact of the changes on the household saving ratio
Figure 2 shows the indicative revisions of the household saving ratio between Blue Book 2018 and previously published, from 1997 to 2016. Revisions to the household saving ratio range from positive 0.4 percentage points in 1997 to negative 0.4 percentage points in 2016. The average revision to the saving ratio was positive 0.0 percentage points.
Figure 2: Indicative impact to households saving ratio

Source: Office for National Statistics
Download this image Figure 2: Indicative impact to households saving ratio
.png (28.4 kB) .xls (28.7 kB)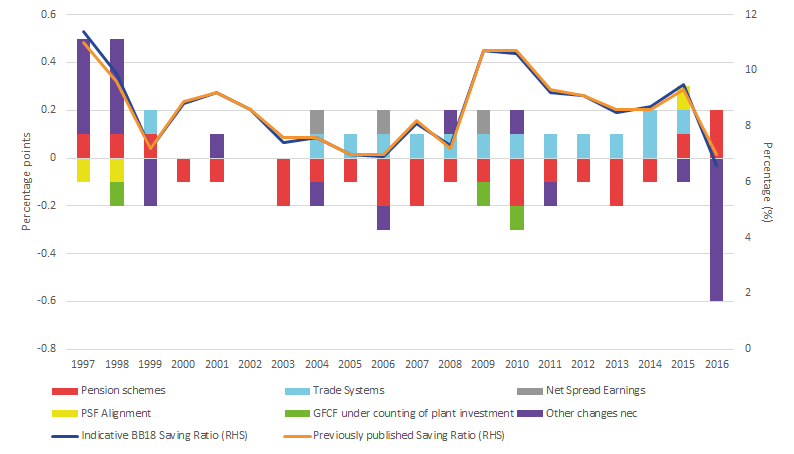
Impact of the changes on gross disposable household income
Blue Book 2018 improvements had a 0.0 percentage points impact, on average, on the annual growth rate of real household disposable income (RHDI) between 1997 and 2016.
However, the year-on-year RHDI growth rate for 2016 has been revised down from 0.0% to negative 0.2%, making it the first year of negative RHDI growth since 2011 when it was negative 1.7%. This downward revision is due to the upward revision of prices experienced by households in 2016 and the downward revision of gross disposable household income (GDHI); each contributing 0.1 percentage points to the downward revision.
Figure 3 shows the indicative revisions to GDHI against those previously published. Between 1997 and 2016, GDHI was revised down every year by an average of £2.8 billion a year with 2016 seeing the largest downward revision; due mainly to revised wages and salaries data. The Blue Book 2018 improvement with the biggest impact on GDHI is the enhancement of pension data. See Section 3 for greater detail on this improvement.
Figure 3: Contributions to indicative revisions to gross disposable household income, 1997 to 2016
Source: Office for National Statistics
Download this chart Figure 3: Contributions to indicative revisions to gross disposable household income, 1997 to 2016
Image .csv .xls6. Appendix A: Indicative estimates to net lending or net borrowing by sector
Understanding and using the charts
In some instances, the Blue Book 2018 impacts on the sector and financial accounts are very small and difficult to see at first glance. To focus in on the smaller impacts, click on the labels of the larger series to hide them. The chart will then change the interval of the axis to show the minor impacts.
Public corporations
Figure 4: Public corporations net lending or net borrowing from the non-financial account, 1997 to 2016
Source: Office for National Statistics
Notes:
- B.9N = net lending or borrowing position from the non-financial account.
- nec = not elsewhere classified.
Download this chart Figure 4: Public corporations net lending or net borrowing from the non-financial account, 1997 to 2016
Image .csv .xls
Figure 5: Public corporations net lending or net borrowing from the financial account, 1997 to 2016
Source: Office for National Statistics
Notes:
- B.9F = net lending or borrowing position from the financial account.
- nec = not elsewhere classified.
Download this chart Figure 5: Public corporations net lending or net borrowing from the financial account, 1997 to 2016
Image .csv .xls
Figure 6: Public corporations net financial worth, 1997 to 2016
Source: Office for National Statistics
Notes:
- BF.90 = Financial net worth.
Download this chart Figure 6: Public corporations net financial worth, 1997 to 2016
Image .csv .xlsPrivate non-financial corporations
Figure 7: Private non-financial corporations net lending or net borrowing from the non-financial account, 1997 to 2016
Source: Office for National Statistics
Notes:
- B.9N = net lending or borrowing position from the non-financial account.
- Households and no-profit institutions serving households.
- Other changes includes public sector alignment, listed shares improvement, and other changes not elsewhere classified.
Download this chart Figure 7: Private non-financial corporations net lending or net borrowing from the non-financial account, 1997 to 2016
Image .csv .xls
Figure 8: Private non-financial corporations net lending or net borrowing from the financial account, 1997 to 2016
Source: Office for National Statistics
Notes:
- B.9F = net lending or borrowing position from the financial account.
- nec - not elsewhere classified.
Download this chart Figure 8: Private non-financial corporations net lending or net borrowing from the financial account, 1997 to 2016
Image .csv .xls
Figure 9: Private non-financial corporations net financial worth, 1997 to 2016
Source: Office for National Statistics
Notes:
- BF.90 = Financial net worth.
- nec = not elsewhere classified.
Download this chart Figure 9: Private non-financial corporations net financial worth, 1997 to 2016
Image .csv .xls
Figure 10: Financial corporations net lending or net borrowing from the non-financial account, 1997 to 2016
Source: Office for National Statistics
Notes:
- B.9N = net lending or borrowing position from the non-financial account.
- Public sector finance alignment.
- Other changes includes listed shares improvement and other changes not elsewhere classified.
Download this chart Figure 10: Financial corporations net lending or net borrowing from the non-financial account, 1997 to 2016
Image .csv .xls
Figure 11: Financial corporations net lending or net borrowing from the financial account, 1997 to 2016
Source: Office for National Statistics
Notes:
- B.9F = net lending or borrowing position from the financial account.
- Households and non-profit instituions serving households.
- nec - not elsewhere classified.
Download this chart Figure 11: Financial corporations net lending or net borrowing from the financial account, 1997 to 2016
Image .csv .xls
Figure 12: Financial corporations net financial worth, 1997 to 2016
Source: Office for National Statistics
Notes:
- BF.90 = Financial net worth.
- HH/NPISH = Households and non-profit institutions serving households.
- nec = not elsewhere classified.
Download this chart Figure 12: Financial corporations net financial worth, 1997 to 2016
Image .csv .xlsCentral government
Figure 13: Central government net lending or net borrowing from the non-financial account, 1997 to 2016
Source: Office for National Statistics
Notes:
- B.9N = net lending or borrowing position from the non-financial account.
- Public sector finance alignment.
- nec = not elsewhere classified.
Download this chart Figure 13: Central government net lending or net borrowing from the non-financial account, 1997 to 2016
Image .csv .xls
Figure 14: Central government net lending or net borrowing from the financial account, 1997 to 2016
Source: Office for National Statistics
Notes:
- B.9F = net lending or borrowing position from the financial account.
- PSF = Public sector finance.
- nec - not elsewhere classified.
Download this chart Figure 14: Central government net lending or net borrowing from the financial account, 1997 to 2016
Image .csv .xls
Figure 15: Central government net financial worth, 1997 to 2016
Source: Office for National Statistics
Notes:
- BF.90 = Financial net worth.
- PSF = Public sector finance.
- nec = not elsewhere classified.
Download this chart Figure 15: Central government net financial worth, 1997 to 2016
Image .csv .xlsLocal government
Figure 16: Local government net lending or net borrowing from the non-financial account, 1997 to 2016
Source: Office for National Statistics
Notes:
- B.9N = net lending or borrowing position from the non-financial account
- PSF = Public sector finance alignment
Download this chart Figure 16: Local government net lending or net borrowing from the non-financial account, 1997 to 2016
Image .csv .xls
Figure 17: Local government net lending or net borrowing from the financial account, 1997 to 2016
Source: Office for National Statistics
Notes:
- B.9F = net lending or borrowing position from the financial account.
- nec - not elsewhere classified.
Download this chart Figure 17: Local government net lending or net borrowing from the financial account, 1997 to 2016
Image .csv .xls
Figure 18: Local government net financial worth, 1997 to 2016
Source: Office for National Statistics
Notes:
- BF.90 = Financial net worth.
- nec = not elsewhere classified.
Download this chart Figure 18: Local government net financial worth, 1997 to 2016
Image .csv .xlsHouseholds
Figure 19: Households net lending or net borrowing from the non-financial account, 1997 to 2016
Source: Office for National Statistics
Notes:
- B.9N = net lending or borrowing position from the non-financial account.
- PSF = Public sector finance alignment.
- HH/NPISH = Households and non-profit institutions serving households.
- nec - not elsewhere classified.
Download this chart Figure 19: Households net lending or net borrowing from the non-financial account, 1997 to 2016
Image .csv .xls
Figure 20: Households net lending or net borrowing from the financial account, 1997 to 2016
Source: Office for National Statistics
Notes:
- B.9F = net lending or borrowing position from the financial account.
- PSF = Public sector finance.
- HH/NPISH = Households and non-profit institutions serving households.
- nec - not elsewhere classified.
Download this chart Figure 20: Households net lending or net borrowing from the financial account, 1997 to 2016
Image .csv .xls
Figure 21: Households net financial worth, 1997 to 2016
Source: Office for National Statistics
Notes:
- BF.90 = Financial net worth.
- PSF = Public sector finance.
- HH/NPISH = Households and non-profit institutions serving households.
- nec = not elsewhere classified.
Download this chart Figure 21: Households net financial worth, 1997 to 2016
Image .csv .xlsNon-profit institutions serving households (NPISH)
Figure 22: Non-profit institutions serving households net lending or net borrowing from the non-financial account, 1997 to 2016
Source: Office for National Statistics
Notes:
- B.9N = net lending or borrowing position from the non-financial account.
- HH/NPISH = Households and non-profit institutions serving households.
- nec - not elsewhere classified.
Download this chart Figure 22: Non-profit institutions serving households net lending or net borrowing from the non-financial account, 1997 to 2016
Image .csv .xls
Figure 23: Non-profit institutions serving households net lending or net borrowing from the financial account, 1997 to 2016
Source: Office for National Statistics
Notes:
- B.9F = net lending or borrowing position from the financial account.
- HH/NPISH = Households and non-profit institutions serving households.
- nec - not elsewhere classified.
Download this chart Figure 23: Non-profit institutions serving households net lending or net borrowing from the financial account, 1997 to 2016
Image .csv .xls
Figure 24: Non-profit institutions serving households net financial worth, 1997 to 2016
Source: Office for National Statistics
Notes:
- BF.90 = Financial net worth.
- HH/NPISH = Households and non-profit institutions serving households.
- nec = not elsewhere classified.
Download this chart Figure 24: Non-profit institutions serving households net financial worth, 1997 to 2016
Image .csv .xlsRest of the world
Figure 25: Rest of the world net lending or net borrowing from the non-financial account, 1997 to 2016
Source: Office for National Statistics
Notes:
- B.9N = net lending or borrowing position from the non-financial account.
- HH/NPISH = Households and non-profit institutions serving households.
- nec - not elsewhere classified.
Download this chart Figure 25: Rest of the world net lending or net borrowing from the non-financial account, 1997 to 2016
Image .csv .xls
Figure 26: Rest of the world net lending or net borrowing from the financial account, 1997 to 2016
Source: Office for National Statistics
Notes:
- B.9F = net lending or borrowing position from the financial account.
- HH/NPISH = Households and non-profit institutions serving households.
- nec - not elsewhere classified.
Download this chart Figure 26: Rest of the world net lending or net borrowing from the financial account, 1997 to 2016
Image .csv .xls
Figure 27: Rest of the world net financial worth, 1997 to 2016
Source: Office for National Statistics
Notes:
- BF.90 = Financial net worth.
- PSF = Public sector finance.
- HH/NPISH = Households and non-profit institutions serving households.
- nec = not elsewhere classified.
Download this chart Figure 27: Rest of the world net financial worth, 1997 to 2016
Image .csv .xls7. Appendix B: Contributions to revisions to estimated net lending or borrowing and net worth to selected sectors, by transaction
Understanding and using the charts
In some instances, the Blue Book 2018 impacts on the sector and financial accounts are very small and difficult to see at first glance. To focus in on the smaller impacts, click on the labels of the larger series to hide them. The chart will then change the interval of the axis to show the minor impacts. The figures in this section show the indicative revision against previously published data for:
the non-financial net lending or borrowing position
the financial net lending or borrowing position
and the financial balance sheet financial net worth
by sector, and show the contributions to the revision by category of transaction.
Although all three estimates should conceptually equal, they do not as a result of different data sources causing the statistical discrepancies. Out of the three estimates, the data in the non-financial account is generally deemed to be of greater quality due to the greater availability of data sources.
The line in the graphs in the figures in this appendix represents the revisions to the specified indicator and the stacked bars represent the revisions to the underlying transactions that make up the indicator.
Public corporations
Figure 28: Contributions to indicative revisions to public corporations net lending or net borrowing from the non-financial account, 1997 to 2016
Source: Office for National Statistics
Notes:
- Sum of contributions may not equal to revisions in the total net lending/borrowing position due to rounding.
Download this chart Figure 28: Contributions to indicative revisions to public corporations net lending or net borrowing from the non-financial account, 1997 to 2016
Image .csv .xls
Figure 29: Contributions to indicative revisions to public corporations net lending or net borrowing from the financial account, 1997 to 2016
Source: Office for National Statistics
Notes:
- Sum of contributions may not equal to revisions in the total net lending/borrowing position due to rounding.
Download this chart Figure 29: Contributions to indicative revisions to public corporations net lending or net borrowing from the financial account, 1997 to 2016
Image .csv .xls
Figure 30: Contributions to indicative revisions to public corporations net financial worth, 1997 to 2016
Source: Office for National Statistics
Notes:
- Sum of contributions may not equal to revisions in the total net lending/borrowing position due to rounding
Download this chart Figure 30: Contributions to indicative revisions to public corporations net financial worth, 1997 to 2016
Image .csv .xlsPrivate non-financial corporations
Figure 31: Contributions to indicative revisions to private non-financial corporations net lending or net borrowing from the non-financial account, 1997 to 2016
Source: Office for National Statistics
Notes:
- Sum of contributions may not equal to revisions in the total net lending/borrowing position due to rounding.
Download this chart Figure 31: Contributions to indicative revisions to private non-financial corporations net lending or net borrowing from the non-financial account, 1997 to 2016
Image .csv .xls
Figure 32: Contributions to indicative revisions to private non-financial corporations net lending or net borrowing from the financial account, 1997 to 2016
Source: Office for National Statistics
Notes:
- Sum of contributions may not equal to revisions in the total net lending/borrowing position due to rounding.
Download this chart Figure 32: Contributions to indicative revisions to private non-financial corporations net lending or net borrowing from the financial account, 1997 to 2016
Image .csv .xls
Figure 33: Contributions to indicative revisions to private non-financial corporations net financial worth, £billions, 1997 to 2016
Source: Office for National Statistics
Notes:
- Sum of contributions may not equal to revisions in the net financial worth due to rounding
Download this chart Figure 33: Contributions to indicative revisions to private non-financial corporations net financial worth, £billions, 1997 to 2016
Image .csv .xls
Figure 34: Contributions to indicative revisions to financial corporations net lending or net borrowing from the non-financial account, £billions, 1997 to 2016
Source: Office for National Statistics
Notes:
- Sum of contributions may not equal to revisions in the total net lending/borrowing position due to rounding.
Download this chart Figure 34: Contributions to indicative revisions to financial corporations net lending or net borrowing from the non-financial account, £billions, 1997 to 2016
Image .csv .xls
Figure 35: Contributions to indicative revisions to financial corporations net lending or net borrowing from the financial account, 1997 to 2016
Source: Office for National Statistics
Notes:
- Sum of contributions may not equal to revisions in the total net lending/borrowing position due to rounding.
Download this chart Figure 35: Contributions to indicative revisions to financial corporations net lending or net borrowing from the financial account, 1997 to 2016
Image .csv .xls
Figure 36: Contributions to indicative revisions to financial corporations net financial worth, 1997 to 2016
Source: Office for National Statistics
Notes:
- Sum of contributions may not equal to revisions in the net financial worth due to rounding.
Download this chart Figure 36: Contributions to indicative revisions to financial corporations net financial worth, 1997 to 2016
Image .csv .xlsCentral government
Figure 37: Contributions to indicative revisions to central government net lending or net borrowing from the non-financial account,1997 to 2016
Source: Office for National Statistics
Notes:
- Sum of contributions may not equal to revisions in the total net lending/borrowing position due to rounding.
Download this chart Figure 37: Contributions to indicative revisions to central government net lending or net borrowing from the non-financial account,1997 to 2016
Image .csv .xls
Figure 38: Contributions to indicative revisions to central government net lending or net borrowing from the financial account, 1997 to 2016
Source: Office for National Statistics
Notes:
- Sum of contributions may not equal to revisions in the total net lending/borrowing position due to rounding
Download this chart Figure 38: Contributions to indicative revisions to central government net lending or net borrowing from the financial account, 1997 to 2016
Image .csv .xls
Figure 39: Contributions to indicative revisions to central government net financial worth, 1997 to 2016
Source: Office for National Statistics
Notes:
- Sum of contributions may not equal to revisions in the net financial worth due to rounding.
Download this chart Figure 39: Contributions to indicative revisions to central government net financial worth, 1997 to 2016
Image .csv .xlsLocal government
Figure 40: Contributions to indicative revisions to local government net lending or net borrowing from the non-financial account, 1997 to 2016
Source: Office for National Statistics
Notes:
- Sum of contributions may not equal to revisions in the total net lending/borrowing position due to rounding.
Download this chart Figure 40: Contributions to indicative revisions to local government net lending or net borrowing from the non-financial account, 1997 to 2016
Image .csv .xls
Figure 41: Contributions to indicative revisions to local government net lending or net borrowing from the financial account, 1997 to 2016
Source: Office for National Statistics
Notes:
- Sum of contributions may not equal to revisions in the total net lending/borrowing position due to rounding.
Download this chart Figure 41: Contributions to indicative revisions to local government net lending or net borrowing from the financial account, 1997 to 2016
Image .csv .xls
Figure 42: Contributions to indicative revisions to local government net financial worth, 1997 to 2016
Source: Office for National Statistics
Notes:
- Sum of contributions may not equal to revisions in the net financial worth due to rounding.
Download this chart Figure 42: Contributions to indicative revisions to local government net financial worth, 1997 to 2016
Image .csv .xlsHouseholds
Figure 43: Contributions to indicative revisions to households net lending or net borrowing from the non-financial account, £billions, 1997 to 2016
Source: Office for National Statistics
Notes:
- Sum of contributions may not equal to revisions in the total net lending/borrowing position due to rounding.
Download this chart Figure 43: Contributions to indicative revisions to households net lending or net borrowing from the non-financial account, £billions, 1997 to 2016
Image .csv .xls
Figure 44: Contributions to indicative revisions to households net lending or net borrowing from the financial account, 1997 to 2016
Source: Office for National Statistics
Notes:
- Sum of contributions may not equal to revisions in the total net lending/borrowing position due to rounding.
Download this chart Figure 44: Contributions to indicative revisions to households net lending or net borrowing from the financial account, 1997 to 2016
Image .csv .xls
Figure 45: Contributions to indicative revisions to households net financial worth, 1997 to 2016
Source: Office for National Statistics
Notes:
- Sum of contributions may not equal to revisions in the net financial worth due to rounding.
Download this chart Figure 45: Contributions to indicative revisions to households net financial worth, 1997 to 2016
Image .csv .xlsNon-profit institutions serving households (NPISH)
Figure 46: Contributions to indicative revisions to non-profit institutions serving households net lending or net borrowing from the non-financial account,1997 to 2016
Source: Office for National Statistics
Notes:
- Sum of contributions may not equal to revisions in the total net lending/borrowing position due to rounding
Download this chart Figure 46: Contributions to indicative revisions to non-profit institutions serving households net lending or net borrowing from the non-financial account,1997 to 2016
Image .csv .xls
Figure 47: Contributions to indicative revisions to non-profit institutions serving households net lending or net borrowing from the financial account, £billions, 1997 to 2016
Source: Office for National Statistics
Notes:
- Sum of contributions may not equal to revisions in the total net lending/borrowing position due to rounding.
Download this chart Figure 47: Contributions to indicative revisions to non-profit institutions serving households net lending or net borrowing from the financial account, £billions, 1997 to 2016
Image .csv .xls
Figure 48: Contributions to indicative revisions to non-profit institutions serving households net financial worth, £billions, 1997 to 2016
Source: Office for National Statistics
Notes:
- Sum of contributions may not equal to revisions in the net financial worth due to rounding.
Download this chart Figure 48: Contributions to indicative revisions to non-profit institutions serving households net financial worth, £billions, 1997 to 2016
Image .csv .xlsRest of the world
Figure 49: Contributions to indicative revisions to rest of the world net lending or net borrowing from the non-financial account, 1997 to 2016
Source: Office for National Statistics
Notes:
- Sum of contributions may not equal to revisions in the total net lending/borrowing position due to rounding.
Download this chart Figure 49: Contributions to indicative revisions to rest of the world net lending or net borrowing from the non-financial account, 1997 to 2016
Image .csv .xls
Figure 50: Contributions to indicative revisions to rest of the world net lending or net borrowing from the financial account, 1997 to 2016
Source: Office for National Statistics
Notes:
- Sum of contributions may not equal to revisions in the total net lending/borrowing position due to rounding.
Download this chart Figure 50: Contributions to indicative revisions to rest of the world net lending or net borrowing from the financial account, 1997 to 2016
Image .csv .xls
Figure 51: Contributions to indicative revisions to rest of the world net financial worth, 1997 to 2016
Source: Office for National Statistics
Notes:
- Sum of contributions may not equal to revisions in the net financial worth due to rounding.