Table of contents
- Main points
- Main figures for March 2016
- Understanding and working with UK trade statistics
- Summary of latest UK Trade statistics
- Longer-term perspective
- Value of UK trade in goods
- Trade in goods – analysis by area
- Trade in goods – geographical analysis
- Volume of total trade in goods, excluding oil and erratics
- Export and import prices for trade in goods (not seasonally adjusted)
- Trade in oil
- Trade in services
- Where to find more information about UK trade statistics
- Revisions to trade statistics
- Accuracy of the statistics
- Other quality information
- Records sheet
- Background notes
1. Main points
UK trade shows import and export activity and is a main contributor to the overall economic growth of the UK. All data are shown on a seasonally adjusted, balance of payments basis, at current prices unless otherwise stated.
The UK’s deficit on trade in goods and services was estimated to have been £3.8 billion in March 2016, a narrowing of £0.5 billion from February 2016. The narrowing is attributed to both trade in goods and trade in services. The trade in goods deficit has narrowed from £11.4 billion in February 2016, to £11.2 billion in March 2016. The trade in services surplus increased from £7.1 billion in February 2016, to £7.4 billion in March 2016.
The narrowing of the trade in goods deficit between February 2016 and March 2016 reflected an increase in exports of £0.4 billion to £23.7 billion; mainly attributed to a rise in unspecified goods and machinery and transport equipment.
Between Quarter 4 (October to December) 2015 and Quarter 1 (January to March) 2016, the total trade deficit for goods and services widened by £1.1 billion to £13.3 billion.
Between Quarter 4 (October to December) 2015 and Quarter 1 (January to March) 2016, the trade in goods deficit widened by £1.4 billion to £34.7 billion. This widening is attributed to a £1.9 billion rise in imports of goods to £104.6 billion (of which, machinery and transport equipment rose by £1.6 billion).
Between Quarter 4 (October to December) 2015 and Quarter 1 (January to March) 2016, the UK’s trade in goods deficit with the EU widened by £0.7 billion to £23.9 billion – the widest on record - reflecting a 1.6% increase in exports and a 2.3% increase in imports.
Between Quarter 4 (October to December) 2015 and Quarter 1 (January to March) 2016, the trade in services surplus widened by £0.4 billion to £21.4 billion.
Back to table of contents2. Main figures for March 2016
Table 1: Balance of UK trade in goods and services, March 2015 and January 2016 to March 2016
| Balance of trade in goods | Balance of trade in services | Total trade balance | ||||
| EU | Non-EU | Total | ||||
| 2015 | Mar | -7.6 | -3.8 | -11.4 | 7.4 | -4.0 |
| 2016 | Jan | -7.7 | -4.4 | -12.1 | 6.9 | -5.1 |
| Feb | -8.1 | -3.4 | -11.4 | 7.1 | -4.3 | |
| Mar | -8.1 | -3.1 | -11.2 | 7.4 | -3.8 | |
| Source: Office for National Statistics | ||||||
Download this table Table 1: Balance of UK trade in goods and services, March 2015 and January 2016 to March 2016
.xls (25.1 kB)
Figure 1: Balance of UK trade, March 2014 to March 2016
Source: Office for National Statistics
Download this chart Figure 1: Balance of UK trade, March 2014 to March 2016
Image .csv .xls3. Understanding and working with UK trade statistics
Short guide to UK trade
UK Trade shows the extent of import and export activity and is an important contributor to the overall economic growth of the UK. Trade is measured through both imports and exports of goods and/or services. Data are supplied by over 30 sources including several administrative sources, Her Majesty’s Revenue and Customs (HMRC) being the largest.
This monthly release contains tables showing the total value of trade in goods together with index numbers of volume and price. Figures are analysed by broad commodity group (values and indices) and according to geographical area (values only). In addition, the UK Trade statistical bulletin also includes early monthly estimates of the value of trade in services.
This bulletin focuses on trade in goods due to the coverage and comprehensiveness of the administrative data sources available for goods as it is easier to quantify and measure. Trade in services is more difficult to measure, and source data is provided mainly on a quarterly or annual basis principally from ITIS (International Trade in Services survey). Monthly estimates are derived using this quarterly data; therefore the data are less robust on a monthly basis compared with goods.
As more information becomes available on trade in services this bulletin will focus on the values, volumes and geographic breakdown on a 3 monthly cycle described below:
| Month | Trade in services detail |
|---|---|
| March, June, October, December | Focus on the estimated quarterly change in exports and imports of services by the main types of service |
| January, April, July, October | Focus on trade in services in volume terms |
| February, May, October, November | Focus on trade in services with EU and selected non-EU countries |
Our website
The UK trade methodology web pages can now be found on our website. These have been developed to provide detailed information about the methods used to produce UK trade statistics. Any recent user requested trade data are included on our website.
Understanding UK trade
We make every effort to provide informative commentary on the data in this release. Where possible, the commentary draws on evidence from other sources of information to help explain possible reasons behind the observed changes. However, in some instances it can prove difficult to draw out detailed reasons for movements; consequently, it is not possible for all data movements to be fully explained.
Trade statistics for any one month can be erratic. For that reason, it is recommended to compare the latest 3 months against the preceding 3 months and the same 3 months of the previous year.
When examining the trade in goods data, oil and “erratics”, which are high value, low volume products, are removed from some analysis as they are extremely influential on trade in goods as a whole. Therefore we publish data inclusive and exclusive of these categories. We also provide a separate analysis of oil because it is subject to erratic price fluctuations and therefore volume data is provided in metric tonnes as well as value (£ million).
Strengths and weaknesses of the data
Strengths
Quality of trade in goods data
The quality of the source data for trade in goods is high in terms of the timeliness, comprehensiveness and coverage and this level of quality compares well internationally. The data are used across government, business and academia and feed into a number of other outputs and publications; including GDP and balance of payments. The Bank of England uses the total figures to make policy decisions, whereas government departments such as the Foreign and Commonwealth Office are interested in the individual country detail.
We have frequent communication with our suppliers to discuss quality, including regular meetings, telephone conversations and email correspondence. Service level agreements are in place to define the level of quality expected in the data received and these are reviewed annually. Data suppliers have their own internal quality assurance processes to meet the quality standards outlined in the service level agreements and we work closely with them to understand these. Suppliers are required to advise us of any changes to the collection or processing of the data to ensure our expectations are still met.
When data is received by the trade team we conduct our own initial quality assurance. Further quality analysis is then conducted at several stages of processing; this is detailed in a process map and quality assurance plan. If there are any quality concerns we work closely with the supplier to address these.
We have regular discussions with users on the quality of our data and provide comprehensive explanations of the terms, methodology and processes we use. Eurostat is an important customer influence and helps improve the quality of our data through task force meetings and by producing quality guidelines.
Timeliness of publications
The UK trade publication is very timely (generally 40 days after the period to which it refers), helping to inform policy and to assess UK economic performance.
Weaknesses
Quality and timeliness of trade in services data
Where trade in goods has one main data supplier, there are a large number of suppliers of trade in services data. Additionally, a number are voluntary, so it can be difficult to establish and maintain the same quality assurance processes and relationships with these businesses or suppliers.
Due to the collection methods and complexities of quantifying trade in services, data is less timely than trade in goods estimates. The data is processed quarterly, so monthly forecasts are made to provide a complete trade total.
Monthly volatility
Trade statistics for any one month can be erratic. For that reason, we recommend comparing the latest 3 months against the preceding 3 months and the same 3 months of the previous year, however we also recognise the importance to users of an early estimate of trade therefore we continue to produce a monthly estimate.
UK trade National Statistics suspension
Due to a series of errors during 2014, the UK Statistics Authority suspended the National Statistics designation of UK trade on 14 November 2014. The Authority's reassessment of UK trade against the Code of Practice for Official Statistics has been completed. We are committed to meeting the requirements and regaining National Statistics status for UK trade as soon as possible and will keep you informed of progress.
One of the recommendations of the reassessment was to consult with users on the use of UK trade statistics. The results of this user engagement survey can be found on our website.
To provide feedback on the bulletin please contact us via email trade@ons.gov.uk.
The trade development plan has now been launched for consultation. We are seeking feedback by 27 May 2016, any comments or feedback should be directed to the UK trade inbox (trade@ons.gov.uk).
UK trade re-assessment update
ONS has now addressed some of the requirements of the re-assessment of UK trade and is in the final stages of providing evidence on the remaining requirements. In doing so, we are working with the Assessment Team to evaluate whether any additional evidence will be required as a result of the Independent review of UK economic statistics, led by Professor Sir Charles Bean.
Definitions and explanations
A glossary of terms is published in the UK trade glossary and the UK Balance of Payments - The Pink Book, 2015.
Nonmonetary gold
According to internationally agreed standards, nonmonetary gold held in allocated accounts is recorded as a good; therefore, gold of this type which is being stored as a financial asset is recognised under trade in goods when ownership changes between a resident and non-resident.
Data are collected by the Bank of England from the London Bullion Market on holdings of nonmonetary gold. Working alongside the Bank of England and the London Bullion Market Association we have implemented a method for smoothing the source data; effectively minimising volatility whilst enabling the underlying trend of the gold market to be reflected in the trade balance.
Estimates for trade in nonmonetary gold still remain volatile compared with other commodities and, as such, is classified under erratics.
Use of the data
UK trade is a main economic indicator due to the importance of international trade to the UK economy. It is also a very timely statistic, providing an early indicator of what is happening more generally in the economy.
In addition, it is a major component of 2 other main economic indicators: UK gross domestic product (GDP) and the UK balance of payments. This means that there is a threefold potential for UK trade statistics to inform the government’s view of the UK economy, as well as the views of others, such as economists, city analysts, academics, the media and international organisations.
Notes on tables
Rounding:
The sum of constituent items in tables does not always agree exactly with the totals shown due to rounding.
Symbols:
.. Not applicable
- Nil or less than half the final digit shown.
4. Summary of latest UK Trade statistics
Monthly analysis
The deficit on trade in goods and services in March 2016 was £3.8 billion, compared with a deficit of £4.3 billion in February 2016. The trade position reflects exports minus imports; the narrowing of the deficit was attributed to an increase in exports between February 2016 and March 2016.
Between February 2016 and March 2016, total exports increased by £0.5 billion (1.2%) to £42.6 billion. This increase comprised a £0.4 billion rise in the export of goods and a £0.1 billion rise in the export of services. Total imports increased by £0.1 billion to £46.4 billion (0.1%) over the same period.
The deficit on trade in goods was £11.2 billion in March 2016; narrowing by £0.2 billion from February 2016. This narrowing reflected an increase in exports (up £0.4 billion to £23.7 billion) and an increase in imports (up £0.2 billion to £34.9 billion). The increase in exports was mainly attributed to a £0.6 billion increase in unspecified goods* and £0.2 billion increase in exports of aircraft; these increases were offset by a £0.5 billion fall in chemicals. The increase in imports was attributed to a £0.4 billion increase in oil and a £0.2 billion increase in aircraft; these increases were offset by a £0.3 billion fall in chemicals.
Exports of goods to EU countries was unchanged between February 2016 and March 2016. There was a £0.2 billion increase in exports of cars and a £0.1 billion increase in aircraft; these movements were offset by a £0.3 billion decrease in chemicals and a £0.1 billion fall in oil. Imports of goods from EU countries increased by £16.0 million, to a monthly record of £19.4 billion over the same period. There was a £0.1 billion increase in imports of works of art, to a record of £0.2 billion; offset by a £0.3 billion fall in chemicals and a £0.1 billion fall in aircraft. These movements resulted in widening of the trade in a goods deficit with EU countries by £16.0 million, to a record monthly deficit of £8.1 billion in March 2016.
Between February 2016 and March 2016, exports of goods to countries outside the EU increased by £0.4 billion. There was a £0.6 billion increase in exports of unspecified goods* and £0.1 billion increases in both aircraft and oil; these increases were offset by a £0.2 billion fall in chemicals and a £0.1 billion fall in cars. Imports from countries outside the EU increased by £0.2 billion; specifically oil, which increased by £0.4 billion and aircraft, which increased by £0.3 billion. These movements resulted in a £0.2 billion narrowing of the deficit with non-EU countries to £3.1 billion.
*Unspecified goods includes parcel post and low value trade, and, most notably, nonmonetary gold.
Quarterly analysis
Between Quarter 4 (October to December) 2015 and Quarter 1 (January to March) 2016, the total trade deficit (goods and services) widened by £1.1 billion to £13.3 billion. The trade position reflects exports minus imports; the widening of the deficit was attributed to an increase in imports, partially offset by an increase in exports.
The deficit on trade in goods widened by £1.4 billion to a record quarterly deficit of £34.7 billion between Quarter 4 (October to December) 2015 and Quarter 1 (January to March) 2016. Exports of goods increased by £0.5 billion, to £69.9 billion, reflecting a £0.7 billion increase in the export of chemicals and a £0.4 billion increase in cars; these increases were offset by a decrease in the export of fuels of £0.8 billion and £0.2 billion falls in both iron and steel and aircraft exports. Imports increased by £1.9 billion due to a £1.1 billion increase in mechanical machinery, a £0.7 billion increase in unspecified goods*, a £0.3 billion increase in cars and clothing and footwear and jewellery both increased by £0.2 billion to record highs of £0.6 billion and £0.9 billion respectively. These increases were offset by a £1.3 billion decrease in imports of fuels.
Between Quarter 4 (October to December) 2015 and Quarter 1 (January to March) 2016, exports of goods to EU countries increased by £0.5 billion due to exports of chemicals which increased by £0.5 billion, this was offset by a decrease in exports of fuels other than oil, which fell by £0.4 billion. Imports from the EU increased by £1.3 billion, with increases in imports of mechanical machinery of £0.4 billion and chemicals of £0.2 billion. This resulted in a widening of the trade in goods deficit with EU countries to a record quarterly and 3 monthly level of £23.9 billion in Quarter 1 (January to March) 2016.
There was a trade in goods deficit with non-EU countries of £10.8 billion in Quarter 1 (January to March) 2016, a widening of £0.7 billion from Quarter 4 (October to December) 2015. Exports of goods to countries outside the EU fell by £41.0 million, this was the result of a £0.3 billion increase in cars, offset by a £0.5 billion fall in oil and a £0.2 billion fall in aircraft. Imports of goods to countries outside the EU increased by £0.7 billion; most notably there were increases in mechanical machinery and unspecified goods*, both of £0.7 billion. These increases were offset by a decrease in fuels of £1.4 billion.
*Unspecified goods includes parcel post and low value trade, and, most notably, nonmonetary gold.
Please note, the month span for Quarter 1 2016 in this section was incorrectly labelled as January to December. This was amended on 11 May, 10:00am.
Revisions
In this publication periods from January 2016 are open for revision. The total trade (goods and services) deficit for February 2016 has been revised down by £0.5 billion. This is attributed to a £0.5 billion downwards revision to imports of EU goods. These revisions were mainly due to finished manufactures, specifically road vehicles other than cars (revised down by £0.3 billion) and aircraft (revised down by £0.1 billion).
Back to table of contents5. Longer-term perspective
UK trade with the EU
In 2015, exports of goods and services to the EU accounted for 44% of the total exports. The proportion is closer to half for exports of goods (47%) and just under two-fifths (39%) for trade in services. The share of exports has fallen by more than 10 percentage points over the last 15 years.
Table 2: UK trade with the EU and percentages of World total, 2000 to 2015
| £ million | |||||
| Trade with European Union | 2000 | 2005 | 2010 | 2015 | |
| Exports of goods | L87S | 113,108 | 123,069 | 145,173 | 134,332 |
| Percentage of World total | 60.1% | 58.0% | 53.7% | 47.0% | |
| Exports of services | L854 | 33,452 | 54,497 | 70,991 | 89,015 |
| Percentage of World total | 40.9% | 42.2% | 40.8% | 39.4% | |
| Total exports of goods and services | L84Y | 146,560 | 177,566 | 216,164 | 223,347 |
| Percentage of World total | 54.3% | 52.0% | 48.6% | 43.7% | |
| Imports of goods | L87U | 118,548 | 161,921 | 189,072 | 223,009 |
| Percentage of World total | 53.5% | 57.4% | 51.4% | 54.3% | |
| Imports of services | L868 | 37,613 | 52,895 | 58,074 | 68,099 |
| Percentage of World total | 55.0% | 55.4% | 48.5% | 49.6% | |
| Total imports of goods and services | L864 | 156,161 | 214,816 | 247,146 | 291,108 |
| Percentage of World total | 53.8% | 56.9% | 50.7% | 53.1% | |
| Source: UKEA, Office for National Statistics | |||||
Download this table Table 2: UK trade with the EU and percentages of World total, 2000 to 2015
.xls (27.1 kB)Rotterdam effect
In this context users should note the ‘Rotterdam effect’ where goods initially exported to one country are subsequently re-exported to another country. This might overstate the share of exports going to a particular country, in this case the Netherlands, and therefore overstate the share of exports going to the EU.
It is not possible to quantify the Rotterdam effect precisely, but an article exploring this issue was published in 2015 . The article used 2013 data to estimate the effect, and made an assumption that 50 per cent of all goods exports to the Netherlands were re-exported to non-EU countries. Using this assumption the Rotterdam effect would account for around 4 percentage points of the UK’s exports of goods. These effects were calculated to illustrate the possible size of the Rotterdam effect. The Rotterdam effect applies only to trade in goods. The 4 percentage points estimate therefore applies to the share of the exports of goods only.
When considering the total exports of goods and services to the EU – the 44.0% figure quoted above – the Rotterdam effect is estimated at around 2 percentage points. It is also important to note that the Rotterdam effect could also affect the UK’s imports. However these effects were calculated to illustrate the possible size of the Rotterdam effect and does not imply that a different data series should be produced or used.
International comparisons
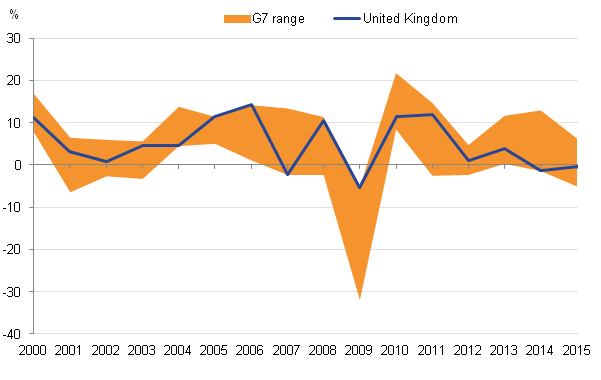
This section compares movements in the UK’s export growth rates with its G7 counterparts (Canada, France, Italy, Germany, Japan, US). Figure 2 shows the range of G7 annual export growth rates between 2000 and 2015 using OECD data.
UK export growth averaged 4.9% per year over the past 15 years, between 2000 and 2015. This was higher than that of Canada, France, Italy and Japan - by 2.1 percentage points, 1.0 percentage points, 0.8 percentage points and 0.9 percentage points respectively. The UK had the highest export growth among the G7 in 4 of the past 15 years, and was in the top half of G7 range in 7 of the past 15 years. Figure 2 also shows that UK exports fell the least in 2009, by 5.3%. Conversely, UK export growth was among the lowest of the G7 export growth performance in 7 of the past 15 years. Overall, UK export growth appears to be more variable than that of the G7 average.
Figure 2: Exports of goods and services of G7 countries, current price in national currency, 2000 to 2015
Source: Organisation for Economic Co-operation and Development
Download this image Figure 2: Exports of goods and services of G7 countries, current price in national currency, 2000 to 2015
.png (18.2 kB) .xls (30.2 kB)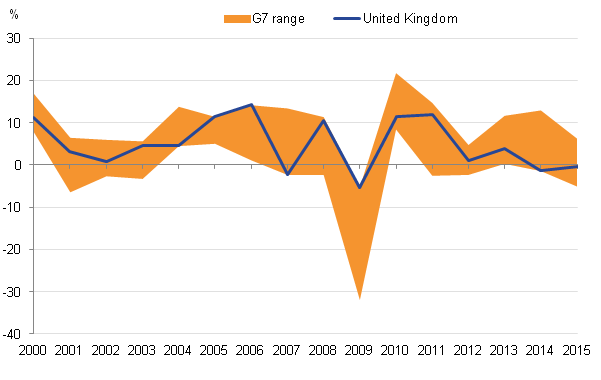
Although G7 export growth improved in 2013 and 2014 compared with 2012 - indicating improved trade activity across the G7, UK export growth has been at the bottom of the G7 range in the last 3 years. In 2015 UK exports fell by 0.4% and were 5.3 percentage points below their longer-term average growth of 4.9% (2000 to 2015). Nevertheless, this was a 1.1 percentage point improvement, compared with 2014-ranking the UK fifth among the G7 economies in 2015 from seventh in 2014. The UK performed better than Japan and the United States by 4.2 percentage points and 4.7 percentage points respectively in 2015. This improved performance was largely driven by goods exports, the negative contribution of which decreased by 0.8 percentage points in 2015 compared with the previous year.
Back to table of contents6. Value of UK trade in goods
Monthly commentary
In March 2016, the UK’s deficit on trade in goods was £11.2 billion, narrowing by £0.2 billion from February 2016.
Exports increased by £0.4 billion (1.9%) to £23.7 billion in March 2016, from £23.2 billion in February 2016.
In detail:
unspecified goods rose by £0.6 billion (148.7%) to £1.0 billion
this increase was partially offset by a decrease in chemicals which fell by £0.5 billion (10.9%) to £4.1 billion
Imports increased by £0.2 billion (0.6%) to £34.9 billion in March 2016, from £34.7 billion in February 2016.
In detail:
oil rose by £0.4 billion (24.3%) to £2.1 billion
this increase was partially offset by a decrease in chemicals which fell by £0.3 billion (5.9%) to £4.3 billion
Quarterly analysis
In Quarter 1 (January to March) 2016, the deficit on trade in goods was £34.7 billion, widening by £1.4 billion from Quarter 4 (October to December) 2015.
Exports increased by £0.5 billion (0.7%) to £69.9 billion in Quarter 1 (January to March) 2016, compared with £69.4 billion in Quarter 4 (October to December) 2015.
In detail:
chemicals rose by £0.7 billion (6.1%) to £12.8 billion
this increase was partially offset by a decrease in oil which fell by £0.4 billion (9.3%) to £4.1 billion
Imports increased by £1.9 billion (1.9%) to £104.6 billion in Quarter 1 (January to March) 2016, compared with £102.6 billion in Quarter 4 (October to December) 2015.
In detail:
machinery and transport equipment rose by £1.6 billion (4.1%) to £40.1 billion
unspecified goods rose by £0.7 billion (23.2%) to £3.6 billion
miscellaneous manufactures rose by £0.7 billion (4.0%) to a quarterly record of £17.5 billion
these increases was partially offset by a decrease in oil which fell by £1.0 billion (15.1%) to £5.5 billion
At the main commodity level, the data are shown in Table 3.
Table 3: Change in UK main commodity value, March 2016
| Monthly change 1 | Quarterly change 2 | ||||
| Exports | Imports | Exports | Imports | ||
| Oil (see section on "trade in oil") | -73 | +4 | +92 | -25 | |
| Cars | +171 | -26 | +34 | +134 | |
| Consumer goods other than cars | 23 | +131 | +88 | +195 | |
| Intermediate goods | -7 | +74 | +54 | +234 | |
| Capital goods | +46 | +79 | +105 | +276 | |
| Chemicals | -262 | -282 | +491 | +150 | |
| Semi-manufactured goods other than chemicals | +4 | +82 | -16 | +84 | |
| Source: Office for National Statistics | |||||
| Notes: | |||||
| 1. Monthly change is March 2016 compared with February 2016. | |||||
| 2. Quarterly change is January 2016 to March 2016 compared with October to December 2015. | |||||
Download this table Table 3: Change in UK main commodity value, March 2016
.xls (26.1 kB)
Figure 3: Value of UK trade in goods, March 2014 to March 2016
Source: Office for National Statistics
Download this chart Figure 3: Value of UK trade in goods, March 2014 to March 2016
Image .csv .xls
Figure 4: Value of UK trade in goods excluding oil, March 2014 to March 2016
Source: Office for National Statistics
Download this chart Figure 4: Value of UK trade in goods excluding oil, March 2014 to March 2016
Image .csv .xlsThe value of trade in goods figures are available in Table 1 and commodity figures are available in Tables 8, 9 and 10 of the dataset of the tables.
Back to table of contents7. Trade in goods – analysis by area
In March 2016, the deficit on trade in goods with EU countries widened by £16.0 million to a record £8.1 billion. The deficit on trade in goods with non-EU countries narrowed by £0.2 billion to £3.1 billion (Figure 5).
Figure 5: Balance of UK trade in goods - EU and non-EU countries, March 2014 to March 2016
Source: Office for National Statistics
Download this chart Figure 5: Balance of UK trade in goods - EU and non-EU countries, March 2014 to March 2016
Image .csv .xlsIn Quarter 1 (January to March) 2016, the deficit on trade in goods with EU countries widened by £0.7 billion to £23.9 billion. Over the same period, the deficit on trade in goods with non-EU countries widened by £0.7 billion to £10.8 billion.
EU analysis
Between February 2016 and March 2016, exports to the EU was unchanged at £11.4 billion. Exports to the Netherlands and France both increased by £0.1 billion; these increases were offset by a fall in exports to Germany of £0.2 billion
Between February 2016 and March 2016, imports from the EU increased by £16 million (0.1%) to £19.4 billion. This was attributed to an increase in imports from Denmark and Spain of £0.1 billion each. These increases were offset by decreases in imports from Germany and the Netherlands of £0.1 billion each.
Between Quarter 4 (October to December) 2015 and Quarter 1 (January to March) 2016, exports to the EU increased by £0.5 billion (1.6%) to £33.6 billion. This was attributed to an increase in exports to Germany of £0.5 billion and Italy and the Netherlands of £0.2 billion each. These increases were offset by decreases in exports to Belgium and Luxembourg (combined) and the Irish Republic of £0.3 billion each.
Between Quarter 4 (October to December) 2015 and Quarter 1 (January to March) 2016, imports from the EU increased by £1.3 billion (2.3%) to £57.5 billion. This was attributed to an increase in imports from Germany, Italy and Spain of £0.2 billion each. These increases were offset by decreases in imports from the Netherlands of £0.6 billion, from the Irish Republic of £0.3 billion and from Sweden of £0.2 billion.
At the commodity level, the data are shown in Table 4.
Table 4: Change in UK main commodity value (EU), March 2016
| £ million | |||||
| Monthly change 1 | Quarterly change 2 | ||||
| Exports | Imports | Exports | Imports | ||
| Oil (see section on "trade in oil") | +25 | +402 | -419 | -985 | |
| Cars | +54 | +50 | +369 | +315 | |
| Consumer goods other than cars | +46 | +1 | +56 | +562 | |
| Intermediate goods | +16 | -85 | +169 | +944 | |
| Capital goods | +56 | +166 | +38 | +384 | |
| Chemicals | -505 | -270 | +736 | -10 | |
| Semi-manufactured goods other than chemicals | -28 | +42 | -38 | +178 | |
| Source: Office for National Statistics | |||||
| Notes: | |||||
| 1. Monthly change is March 2016 compared with February 2016. | |||||
| 2. Quarterly change is January to March 2016 compared with October to December 2015. | |||||
Download this table Table 4: Change in UK main commodity value (EU), March 2016
.xls (25.6 kB)Non-EU analysis
Between February 2016 and March 2016, exports to non-EU countries increased by £0.4 billion (3.6%) to £12.3 billion. This was attributed to increases in exports to Switzerland of £0.4 billion, China of £0.3 billion and Saudi Arabia of £0.2 billion. These increases were offset by decreases in exports to the USA of £0.2 billion and Canada of £0.1 billion.
Between February 2016 and March 2016, imports from non-EU countries increased by £0.2 billion (1.3%) to £15.4 billion. This was attributed to increases in imports from the USA of £0.3 billion, Norway of £0.2 billion and Singapore and South Africa of £0.1 billion each. These increases were offset by decreases in imports from Canada of £0.4 billion and Qatar of £0.2billion.
Between Quarter 4 (October to December) 2015 and Quarter 1 (January to March) 2016, exports to non-EU countries decreased by £41.0 million (0.1%) to £36.2 billion. This was attributed to decreases in exports to Saudi Arabia of £0.5 billion. This decrease was offset by an increases in exports to China of £0.3 billion.
Between Quarter 4 (October to December) 2015 and Quarter 1 (January to March) 2016, imports from non-EU countries increased by £0.7 billion (1.4%) to £47.1 billion. This was attributed to increases in imports from Canada of £0.8 billion and from the USA of £0.7 billion. These increases were offset by decreases in imports to Norway of £0.3 billion and Nigeria of £0.2 billion.
At the commodity level, the data are shown in Table 5.
Table 5: Change in UK main commodity value (non-EU), March 2016
| Monthly change 1 | Quarterly change 2 | ||||
| Exports | Imports | Exports | Imports | ||
| Oil (see section on 'trade in oil') | +98 | +398 | -511 | -960 | |
| Cars | -117 | +76 | +335 | +181 | |
| Consumer goods other than cars | +23 | -130 | -32 | +367 | |
| Intermediate goods | +23 | -159 | +115 | +710 | |
| Capital goods | +10 | +87 | -67 | +108 | |
| Chemicals | -243 | +12 | +245 | -160 | |
| Semi-manufactured goods other than chemicals | -32 | -40 | -22 | +94 | |
| Source: Office for National Statistics | |||||
| Notes: | |||||
| 1. Monthly change is March 2016 compared with February 2016. | |||||
| 2. Quarterly change is January 2016 to March 2016 compared with October to December 2015. | |||||
Download this table Table 5: Change in UK main commodity value (non-EU), March 2016
.xls (25.6 kB)Where to find data about UK trade in goods – analysis by area
Trade in goods by area figures are available in Table 2 and value of trade in goods with selected EU and non-EU trading partner figures are available in Tables 11 and 12 of the dataset of the tables.
Back to table of contents8. Trade in goods – geographical analysis
Monthly analysis
The USA remained the UK’s top export partner with exports of £3.4 billion in March 2016, decreasing by £0.2 billion when compared with February 2016.
Germany remained the UK’s top import partner with imports of £5.2 billion in March 2016, decreasing by £0.1 billion when compared with February 2016. The UK experienced record monthly imports from Spain in March 2016, which increased by £0.1 billion to £1.3 billion compared with February 2016.
Table 6: Change in UK monthly trade with significant partner countries, March 2016 compared with February 2016
| Exports (£ million) | Imports (£ million) | ||||||||
| March 2016 value | 1 month change | March 2016 value | 1 month change | ||||||
| 1 | USA | 3,485 | -226 | 1 | Germany | 5,247 | -145 | ||
| 2 | Germany | 2,576 | -211 | 2 | USA | 3,265 | +259 | ||
| 3 | France | 1,585 | +124 | 3 | China | 3,081 | -33 | ||
| 4 | Netherlands | 1,544 | +55 | 4 | Netherlands | 2,775 | -63 | ||
| 5 | Irish Republic | 1,324 | +19 | 5 | France | 2,108 | -24 | ||
| 6 | China | 1,293 | +309 | 6 | Belgium and Luxembourg | 1,859 | -25 | ||
| 7 | Belgium and Luxembourg | 934 | +21 | 7 | Italy | 1,388 | +10 | ||
| 8 | Switzerland | 797 | +363 | 8 | Spain | 1,342 | +76 | ||
| 9 | Italy | 786 | +34 | 9 | Irish Republic | 1,054 | +15 | ||
| 10 | Spain | 753 | +11 | 10 | Norway | 1,033 | +169 | ||
| Source: Office for National Statistics | |||||||||
| Notes: | |||||||||
| 1 Significant trading partners defined as top 10 export markets and import sources 2015 (see attached table 14). | |||||||||
| 2 USA includes Puerto Rico. | |||||||||
Download this table Table 6: Change in UK monthly trade with significant partner countries, March 2016 compared with February 2016
.xls (27.1 kB)
Figure 6: Significant UK partner countries, 1 month balances, March 2016
Source: Office for National Statistics
Download this chart Figure 6: Significant UK partner countries, 1 month balances, March 2016
Image .csv .xlsQuarterly analysis
In Quarter 1 (January to March) 2016, the USA remained the UK’s top export partner with exports of £11.1 billion, increasing by £0.1 billion when compared with Quarter 4 (October to December) 2015.
Germany remained the UK’s top import partner with imports of £15.7 billion, increasing by £0.2 billion when compared with Quarter 4 (October to December) 2015. Imports from the USA increased by £0.7 billion over the same period and reached a quarterly record high of £9.6 billion in Quarter 1 (January to March) 2016. There were also record imports from Spain of £3.8 billion and from the Czech Republic of £1.4 billion.
Table 7: Change in UK Quarterly trade with significant partner countries, Quarter 1 (January to March) 2016 compared with Quarter 4 (October to December) 2015
| Exports (£ million) | Imports (£ million) | |||||||
| Quarter 1 Value | Quarterly change | Quarter 1 Value | Quarterly change | |||||
| 1 | USA | 11,106 | +144 | 1 | Germany | 15,668 | +186 | |
| 2 | Germany | 7,903 | +532 | 2 | USA | 9,554 | +661 | |
| 3 | Netherlands | 4,510 | +231 | 3 | China | 9,225 | -1 | |
| 4 | France | 4,487 | +139 | 4 | Netherlands | 8,331 | +630 | |
| 5 | Irish Republic | 3,913 | -313 | 5 | France | 6,172 | -111 | |
| 6 | China | 3,356 | +331 | 6 | Belgium and Luxembourg | 5,609 | +125 | |
| 7 | Belgium and Luxembourg | 2,774 | -262 | 7 | Italy | 4,108 | +177 | |
| 8 | Italy | 2,265 | +169 | 8 | Spain | 3,828 | +173 | |
| 9 | Spain | 2,201 | -16 | 9 | Irish Republic | 3,091 | -284 | |
| 10 | Switzerland | 1,669 | -222 | 10 | Norway | 3,007 | -316 | |
| Source: Office for National Statistics | ||||||||
| Notes: | ||||||||
| 1. Significant trading partners defined as top 10 export markets and import sources 2015 (see attached Table 14). | ||||||||
| 2. USA includes Puerto Rico. | ||||||||
Download this table Table 7: Change in UK Quarterly trade with significant partner countries, Quarter 1 (January to March) 2016 compared with Quarter 4 (October to December) 2015
.xls (27.1 kB)
Figure 7: Significant UK partner countries, Quarterly balances, Quarter 1 (January to March) 2016
Source: Office for National Statistics
Download this chart Figure 7: Significant UK partner countries, Quarterly balances, Quarter 1 (January to March) 2016
Image .csv .xlsWhere to find data about UK trade in goods – geographical analysis
Trade in goods by area figures are available in Table 2 and value of trade in goods with selected EU and non-EU trading partner figures are available in Tables 11 and 12 of the dataset of the tables.
Back to table of contents9. Volume of total trade in goods, excluding oil and erratics
Between February 2016 and March 2016, the volume of exports decreased by 0.3%:
- chemicals fell by 13.7%
Between February 2016 and March 2016, the volume of imports decreased by 1.3%:
- chemicals fell by 3.6%
In Quarter 1 (January to March) 2016, the volume of exports decreased by 1.0% when compared with Quarter 4 (October to December) 2015:
- basic materials fell by 2.9%
In Quarter 1 (January to March) 2016, the volume of imports increased by 1.3% when compared with Quarter 4 (October to December) 2015:
- intermediate goods rose by 4.4%
At the commodity level, the data are shown in Table 8.
Table 8: Change in UK main commodity volume, March 2016
| Monthly change 1 | Quarterly change 2 | ||||
| Exports percentage change | Imports percentage change | Exports percentage change | Imports percentage change | ||
| Food, beverages and tobacco | -0.9 | +1.9 | +2.7 | +1.3 | |
| Basic materials | -1.3 | +8.1 | -2.9 | +3.0 | |
| Semi-manufactured goods; of which | -8.6 | -1.9 | +1.7 | -1.3 | |
| Chemicals | -13.7 | -3.6 | +4.6 | -1.8 | |
| Finished manufactured goods; of which | +1.9 | +1.6 | -1.5 | +1.4 | |
| Cars | 0.0 | +2.3 | +1.6 | +1.5 | |
| Consumer goods other than cars | +2.6 | -0.9 | -2.2 | +1.2 | |
| Intermediate goods | +1.0 | -1.7 | -0.7 | +4.4 | |
| Capital goods | 0.0 | +4.3 | -1.7 | +0.6 | |
| Source: Office for National Statistics | |||||
| Notes | |||||
| 1. Monthly change is March 2016 compared with February 2016. | |||||
| 2. Quarterly change is January to March 2016 compared with October to December 2015. | |||||
Download this table Table 8: Change in UK main commodity volume, March 2016
.xls (26.1 kB)Where to find data about volume of trade in goods, excluding oil and erratics
The volume of trade in goods, excluding oil and erratics figures are available in Table 3 of the dataset of the tables.
Back to table of contents10. Export and import prices for trade in goods (not seasonally adjusted)
In March 2016, compared with February 2016, export prices increased by 1.8% and import prices increased by 1.0%. Excluding the oil price effect, export prices increased by 0.9% and import prices increased by 0.6%.
In Quarter 1 (January to March) 2016, when compared with Quarter 4 (October to December) 2015, export prices increased by 1.9% and import prices increased by 1.1%. Excluding the oil price effect, export prices increased by 3.2% and import prices increased by 2.4%.
Figure 8: UK trade in goods export and import prices, March 2014 to March 2016
Source: Office for National Statistics
Download this chart Figure 8: UK trade in goods export and import prices, March 2014 to March 2016
Image .csv .xlsWhere to find data about export and import prices for trade in goods (not seasonally adjusted)
The export and import prices for trade in goods (not seasonally adjusted) figures are available in Table 3 of the dataset of the tables.
Back to table of contents11. Trade in oil
In March 2016, the balance of trade in oil was in deficit by £0.7 billion, a widening of £0.4 billion from February 2016. Oil exports increased by £25.0 million to £1.4 billion and oil imports increased by £0.4 billion to £2.1 billion.
In Quarter 1 (January to March) 2016, the balance on trade in oil was in deficit by £1.5 billion; narrowing by £0.6 billion from Quarter 4 (October to December) 2015. Oil exports decreased by £0.4 billion to £4.1 billion and oil imports decreased by £1.0 billion to £5.5 billion.
Figure 9: Balance of UK trade in oil, March 2014 to March 2016
Source: Office for National Statistics
Download this chart Figure 9: Balance of UK trade in oil, March 2014 to March 2016
Image .csv .xlsWhere to find data about trade in oil
The trade in oil figures are available in Tables 1 and 7 of the dataset of the tables.
Back to table of contents12. Trade in services
Information on trade in services is mainly obtained from quarterly surveys, in some cases underpinned by larger annual surveys. This means that the latest months are uncertain.
Between February 2016 and March 2016, the estimated surplus on trade in services increased by £0.3 billion to £7.4 billion. Exports were estimated to have been £18.9 billion and imports £11.6 billion.
Figure 10: Value of UK trade in services, March 2014 to March 2016
Source: Office for National Statistics
Download this chart Figure 10: Value of UK trade in services, March 2014 to March 2016
Image .csv .xlsIn Quarter 1 (January to March) 2016, the surplus on trade in services was £21.4 billion; financial services (£10.2 billion), other business services (£6.7 billion) and insurance and pension services (£4.1 billion) had the largest surpluses.
Between Quarter 4 (October to December) 2015 and Quarter 1 (January to March) 2016, exports of services decreased by £39.0 million to £56.6 billion, reflecting a decrease to insurance and pension services which fell by £0.4 billion. This decrease was offset by increases in travel services (£0.2 billion) and other business services (£0.2 billion). For the same period, imports of services decreased by £0.4 billion to £35.1 billion, mainly reflecting a decrease in transport services (£0.2 billion).
Table 9: Change in UK service product, Quarter 1 (January to March) 2016 compared with Quarter 4 (October to December) 2015
| Exports (£m) | Imports (£m) | |||||||
| Service product | 2016 Q1 Value | Quarterly change 1 | Service product | 2016 Q1 Value | Quarterly change 1 | |||
| Other business | 16,084 | +169 | Travel | 10,882 | -60 | |||
| Financial | 12,515 | -148 | Other business | 9,355 | -145 | |||
| Travel | 6,642 | +211 | Transport | 5,715 | -199 | |||
| Transport | 6,555 | -2 | Telecoms, computer and information | 2,581 | +1 | |||
| Insurance and pension | 4,151 | -404 | Financial | 2,326 | -81 | |||
| Telecoms, computer and information | 4,887 | -9 | Charges for the use of intellectual property | 2,164 | -3 | |||
| Charges for the use of intellectual property | 3,042 | +34 | Government | 713 | +43 | |||
| Manufacturing and maintenance | 1,106 | +107 | Personal, cultural and recreation | 832 | -3 | |||
| Personal, cultural and recreation | 597 | +67 | Construction | 338 | -26 | |||
| Government | 654 | +1 | Insurance and pension | 96 | -1 | |||
| Construction | 323 | -65 | Manufacturing and maintenance | 133 | +68 | |||
| Total Exports | 56,556 | -39 | Total Imports | 35,135 | -406 | |||
| Source: Office for National Statistics | ||||||||
| Notes: | ||||||||
| 1. Quarterly change is Quarter 1 (January to March) 2016 compared with Quarter 4 (October to December) 2015 | ||||||||
Download this table Table 9: Change in UK service product, Quarter 1 (January to March) 2016 compared with Quarter 4 (October to December) 2015
.xls (28.7 kB)Revisions
There are no revisions to trade in services.
Where to find data about trade in services
The trade in services figures are available in Table 1 CONT. of the dataset of the tables.
A further breakdown of non-EU countries can found in the Quarter 4 (October to December) 2015 United Kingdom Economic Accounts.
Back to table of contents13. Where to find more information about UK trade statistics
Other regularly published UK trade releases
Supplementary quarterly data analysed by product according to the UK trade in goods by classification of product by activity (CPA 2008) are also available.
The latest release on 16 March 2016 covered the period Quarter 4 (October to December) 2015 and the data is consistent with UK trade January 2016 and contained revisions back to 2015. Following an internal review of our publications and a wider survey of users there is no longer a statistical bulletin associated with the release. Instead we have provided a longer-term commentary alongside the data tables.
The complete run of data in the tables of this statistical bulletin are also available to view and download in other electronic formats free of charge using our time series data website service. You can download the complete statistical bulletin in a choice of zipped formats, or view and download your own selections of individual series.
HM Revenue and Customs (HMRC) publish Overseas trade statistics on the same day as we release the UK trade data each month. These aggregate estimates will differ slightly from those that are published by us as part of the Balance of Payments (BoP), as the 2 sets of data are compiled to different sets of rules. The BoP publication shows a high level picture of UK trade in goods, whereas the OTS publication shows a detailed picture of the UK’s trade in goods by commodity and partner country.
Recently published reports on UK trade topics
The Economic Review, April 2016 published 6 April 2016 contains information on trade as a percentage of GDP.
The Economic Review, February 2016 published 3 February 2016 includes analysis of trade with EU and non-EU countries.
On 29 January 2016 annual International trade in services survey results for 2014 were published. This release gives information on the industry of the businesses engaged in trade in services.
Historic articles published on UK trade
On 30 October 2015 we published the annual Balance of Payments Pink Book 2015 which as well as containing more detailed information on trade also provided an overview of the trade deficit in relation to the current account deficit.
In our Economic Review published on 3 September 2015 there is further commentary on UK export performance.
On 1 September 2015, we published an article on the economic performance of the UK’s motor vehicle manufacturing industry.
On 26 June 2015, we published a short story on the importance of EU to UK trade and investment.
On 9 June 2015, we published a short story on the importance of China to the UK economy, including the value of the UK trade with China.
On 6 February 2015, we published an article on the Rotterdam effect and its potential impact on the UK trade in goods estimates.
On 23 January 2015, we published a short story exploring the reasons behind the UK trade deficit.
Published user requested data and analysis
Additional statistical data and analyses for UK trade statistics that have not been included in our standard publications are available at the user requested data and analysis pages on our website.
Methodological articles
Detailed methodological notes are published in the UK Balance of Payments - The Pink Book, 2015.
Back to table of contents14. Revisions to trade statistics
Trade in goods revisions
In this release, periods from January 2016 are open for revision.
The revisions to trade in goods from January 2016 reflect revised data from Her Majesty’s Revenue and Customs and other data suppliers, later survey data on trade prices and a re-assessment of seasonal factors.
Trade in services revisions
In this release, there are no revisions to trade in services.
The National accounts revision policy can be found on our website.
Back to table of contents15. Accuracy of the statistics
Accuracy: Trade in goods figures for the most recent months are provisional and subject to revision in the light of:
late trader data
revisions to seasonal adjustment factors which are re-estimated every month
Trade in services estimates have been derived from a number of monthly and quarterly sources. For components where no monthly data are available, estimates have been derived on the basis of recent trends. The results should be used with appropriate caution, as they are likely to be less reliable than those for trade in goods.
Reliability: Revisions to data provide one indication of its reliability. Table 10 shows summary information on the size and direction of the revisions that have been made to the data covering a 5-year period. A statistical test has been applied to the average revision to find out if it is statistically significantly different from zero. An asterisk (*) shows that the test is significant.
Table 10: Revisions analysis, UK trade, March 2016
| £ million | |||
| Revisions between first publication and estimates 12 months later | |||
| Value in latest period | Average over the last 5 years (mean revision) | Average over the last 5 years without regard to sign (average absolute revision) | |
| Total trade exports (IKBH) | 42,606 | 1,018* | 1,030* |
| Total trade imports (IKBI) | 46,436 | 873* | 874* |
| Total trade balance (IKBJ) | -3,830 | 137 | 761 |
| Source: Office for National Statistics | |||
Download this table Table 10: Revisions analysis, UK trade, March 2016
.xls (25.1 kB)16. Other quality information
Advanced notice of correction
ONS would like to make users aware of an inconsistency between the implied deflator and the underlying price indices in trade in goods for some low level commodities in 2014. It has been estimated that the annual growth in exports and imports of total goods and services should be 0.5 percentage points higher, equivalent to a widening of the trade deficit of approximately £0.5 billion; all else being equal. ONS will correct this at the earliest opportunity in the Quarterly National Accounts publication on 30th June 2016.
UK trade re-assessment
The UK Statistics Authority suspended the National Statistics designation of UK trade on 14 November 2014. The Authority's re-assessment of UK trade against the Code of Practice for Official Statistics has been completed.
One of the recommendations of the re-assessment was to consult with users on the use of UK trade statistics. The results of this user engagement survey can be found on our website.
UK trade re-assessment update
ONS has now addressed some of the requirements of the re-assessment of UK trade and is in the final stages of providing evidence on the remaining requirements. In doing so, we are working with the Assessment Team to evaluate whether any additional evidence will be required as a result of the Independent review of UK economic statistics, led by Professor Sir Charles Bean.
Trade development plan
The trade development plan has now been launched for consultation. We are seeking feedback by 27 May 2016, any comments or feedback should be directed to the UK trade inbox (trade@ons.gov.uk).
HMRC methodology change for gas and revisions to past years
HMRC trade Statistics are amending the mechanism for the data source used in the compilation of Natural Gas traded with non-EU partners. We will implement these revisions in a phased approach. More details can be found on our website.
EMU enlargement
As of 1 January 2015, Lithuania joined the European Monetary Union (EMU). Therefore the EMU totals in this UK trade release include Lithuania.
EMU coverage
The coverage of EMU countries was extended to cover Cyprus and Malta from October 2008, Slovakia from January 2009, Estonia from January 2011, Latvia from January 2014 and Lithuania from January 2015. Some EU and non-EU breakdowns of commodity data for chained volume measures which are available on request may be less reliable than the current price data. Please consult Katherine Kent on +44 (0)1633 455829 if you are considering using them.
Data have been combined for the United States and Puerto Rico and for Dubai, Abu Dhabi and Sharjah (the United Arab Emirates) from January 2009 onwards. Estimates are separately available for the United States and Dubai up to the end of 2008 on request.
Erratics
Non-monetary gold is now included in the erratics series; along with ships, aircraft, precious stones and silver. In compliance with the BPM6 changes, non-monetary gold which is held as a store of wealth is now recorded within trade in goods.
Deflation
It is common for the value of a group of financial transactions to be measured in several time periods. The values measured will include both the change in the volume sold and the effect of the change of prices over that year. Deflation is the process whereby the effect of price change is removed from a set of values.
Chain-linked indices (chained volume measures), which are indexed to form the volume series in this bulletin, differ from fixed base indices in that the growth from one year to the next is estimated by weighting the components using the contribution to value of trade in the immediately preceding year (effectively re-basing every year). This series of annually re-weighted annual growths is then “chain-linked” to produce a continuous series.
The implied price deflators, derived by comparing current price data to chained volume measures data are not the same as the price indices published in this statistical bulletin, because the former are current weighted while the latter are base (2012) weighted.
Changes in trade associated with VAT MTIC fraud mean that comparisons of volume and prices (both including and excluding trade associated with VAT MTIC fraud) should be treated with a great deal of caution.
Interpreting the data
In months where quarterly and 3-monthly ending percentage changes for index data coincide, there may be small differences between the data for methodological reasons. Quarterly data are the indexed form of an underlying constant price (for volume indices) or consistent quantity (for price indices) series. 3-month ending data are the average of the index data in that period.
Seasonal adjustment
Seasonal adjustment aims to remove effects associated with the time of the year or the arrangement of the calendar so that movements within a time series may be more easily interpreted.
Back to table of contents17. Records sheet
The UK trade record information for February 2016 can be accessed on our website.
Back to table of contents