1. Main points
Private rental prices paid by tenants in the UK rose by 1.4% in the 12 months to November 2019, up from 1.3% in October 2019.
In England, private rental prices grew by 1.4%, Wales experienced growth of 1.0%, while in Scotland private rental prices increased by 0.9% in the 12 months to November 2019.
London private rental prices rose by 1.0% in the 12 months to November 2019.
2. UK private rental prices
Figure 1: There has been a broad slowdown in the UK annual growth rate between 2016 and 2018
Index of Private Housing Rental Prices percentage change over 12 months, UK and Great Britain, January 2012 to November 2019
Source: Office for National Statistics – Index of Private Housing Rental Prices
Notes:
- Data presented in this dataset are classified as Experimental Statistics and subject to revisions if improvements in the methodology are identified. Results should be interpreted with this in mind.
Download this chart Figure 1: There has been a broad slowdown in the UK annual growth rate between 2016 and 2018
Image .csv .xlsPrivate rental prices paid by tenants in the UK increased by 1.4% in the 12 months to November 2019, up from 1.3% in October 2019. For example, a property that was rented for £500 per month in November 2018 and saw its rent increase by the average rate in the UK would be rented for £507.00 in November 2019. Growth in private rental prices paid by tenants in the UK generally slowed since the beginning of 2016, driven mainly by a slowdown in London over the same period. Rental growth has started to pick up since the end of 2018, driven by strengthening growth in London.
Rental prices for the UK excluding London increased by 1.6% in the 12 months to November 2019, up from 1.5% in October 2019 (Figure 1). London private rental prices increased by 1.0% in the 12 months to November 2019.
The Royal Institution of Chartered Surveyors' (RICS's) October 2019 UK Residential Market Survey found that demand from prospective tenants has accelerated in the three months to October 2019. Alongside this, landlord instructions continue to decline.
The Association of Residential Letting Agents (ARLA) described in their Private Rented Sector Report, October 2019 how demand from prospective tenants and the number of landlords exiting the market remained the same.
These supply and demand pressures can take time to feed through to the Index of Private Housing Rental Prices (IPHRP), which reflects price changes for all private rental properties rather than only newly advertised rental properties.
Focusing on the long-term trend, between January 2015 and November 2019, private rental prices in the UK increased by 8.3% (Figure 2).
Figure 2: UK rental prices have increased by 8.3% since January 2015
Index of Private Housing Rental Prices indices, UK, January 2015 to November 2019
Source: Office for National Statistics – Index of Private Housing Rental Prices
Notes:
- Data presented in this dataset are classified as Experimental Statistics and subject to revisions if improvements in the methodology are identified. Results should be interpreted with this in mind.
Download this chart Figure 2: UK rental prices have increased by 8.3% since January 2015
Image .csv .xls3. UK private rental growth rates by country
In England, private rental prices grew by 1.4% in the 12 months to November 2019, unchanged since October 2019. Excluding London from the data for England, privately rented properties increased by 1.7% in the 12 months to November 2019.
Private rental prices in Wales grew by 1.0% in the 12 months to November 2019, down from 1.2% in October 2019.
Rental growth in Scotland increased by 0.9% in the 12 months to November 2019, up from 0.7% in October 2019. The weaker growth in Scotland since 2016 may be because of stronger supply and weaker demand in Scotland, as reported by the Association of Residential Letting Agents (ARLA).
The annual rate of change for Northern Ireland (2.2%) in September 2019 is higher than for the other countries of the UK. The Northern Ireland annual growth rate has remained broadly consistent around 2% since 2018. Northern Ireland data have been copied forward since September 2019. The next update to Northern Ireland data will be in the release on 25 March 2020.
Figure 3: The annual rental growth in Scotland was lower than in other countries of the UK
Index of Private Housing Rental Prices percentage change over 12 months for countries of the UK, January 2012 to November 2019
Source: Office for National Statistics – Index of Private Housing Rental Prices
Notes:
- Data presented in this dataset are classified as Experimental Statistics and subject to revisions if improvements in the methodology are identified. Results should be interpreted with this in mind.
- Northern Ireland data are only available every three months. Northern Ireland data are copied forward until the next data are available, which will be in February 2020 bulletin.
Download this chart Figure 3: The annual rental growth in Scotland was lower than in other countries of the UK
Image .csv .xlsAll UK countries have experienced increases in their private rental prices since 2015 (Figure 4). Since January 2015, rental prices in Northern Ireland have increased more than those in Wales, Scotland and England.
Figure 4: Rental prices have increased more in England and Northern Ireland than in Wales and Scotland since 2015
Index of Private Housing Rental Prices indices for countries of the UK, January 2015 to November 2019
Source: Office for National Statistics – Index of Private Housing Rental Prices
Notes:
- Data presented in this dataset are classified as Experimental Statistics and subject to revisions if improvements in the methodology are identified. Results should be interpreted with this in mind.
- Northern Ireland data are only available every three months. Northern Ireland data are copied forward until the next data are available, which will be in February 2020 bulletin.
Download this chart Figure 4: Rental prices have increased more in England and Northern Ireland than in Wales and Scotland since 2015
Image .csv .xls4. UK private rental growth by English regions
London private rental prices increased by 1.0% in the 12 months to November 2019. The Royal Institution of Chartered Surveyors (RICS) reported in their November 2018 UK Residential Market Survey that demand from prospective tenants held steady, with rents expecting to rise modestly over the 12-month horizon.
Focusing on the English regions, the largest annual rental price increase was in the South West (2.3%), up from 2.2% in October 2019 (Figure 5). This was followed by the East Midlands (2.1%), Yorkshire and The Humber (1.9%), and the South East (1.7%).
The lowest annual rental price growth was in the North East, where prices increased by 0.5%, followed by London, which increased by 1.0% in the 12 months to November 2019.
Figure 5: The strongest annual rental price growth was in the South West
Index of Private Housing Rental Prices percentage change over 12 months by English region, November 2018 to November 2019
Source: Office for National Statistics – Index of Private Housing Rental Prices
Download this chart Figure 5: The strongest annual rental price growth was in the South West
Image .csv .xlsFigure 6 shows the historical 12-month percentage growth rate in the rental prices of each of the English regions.
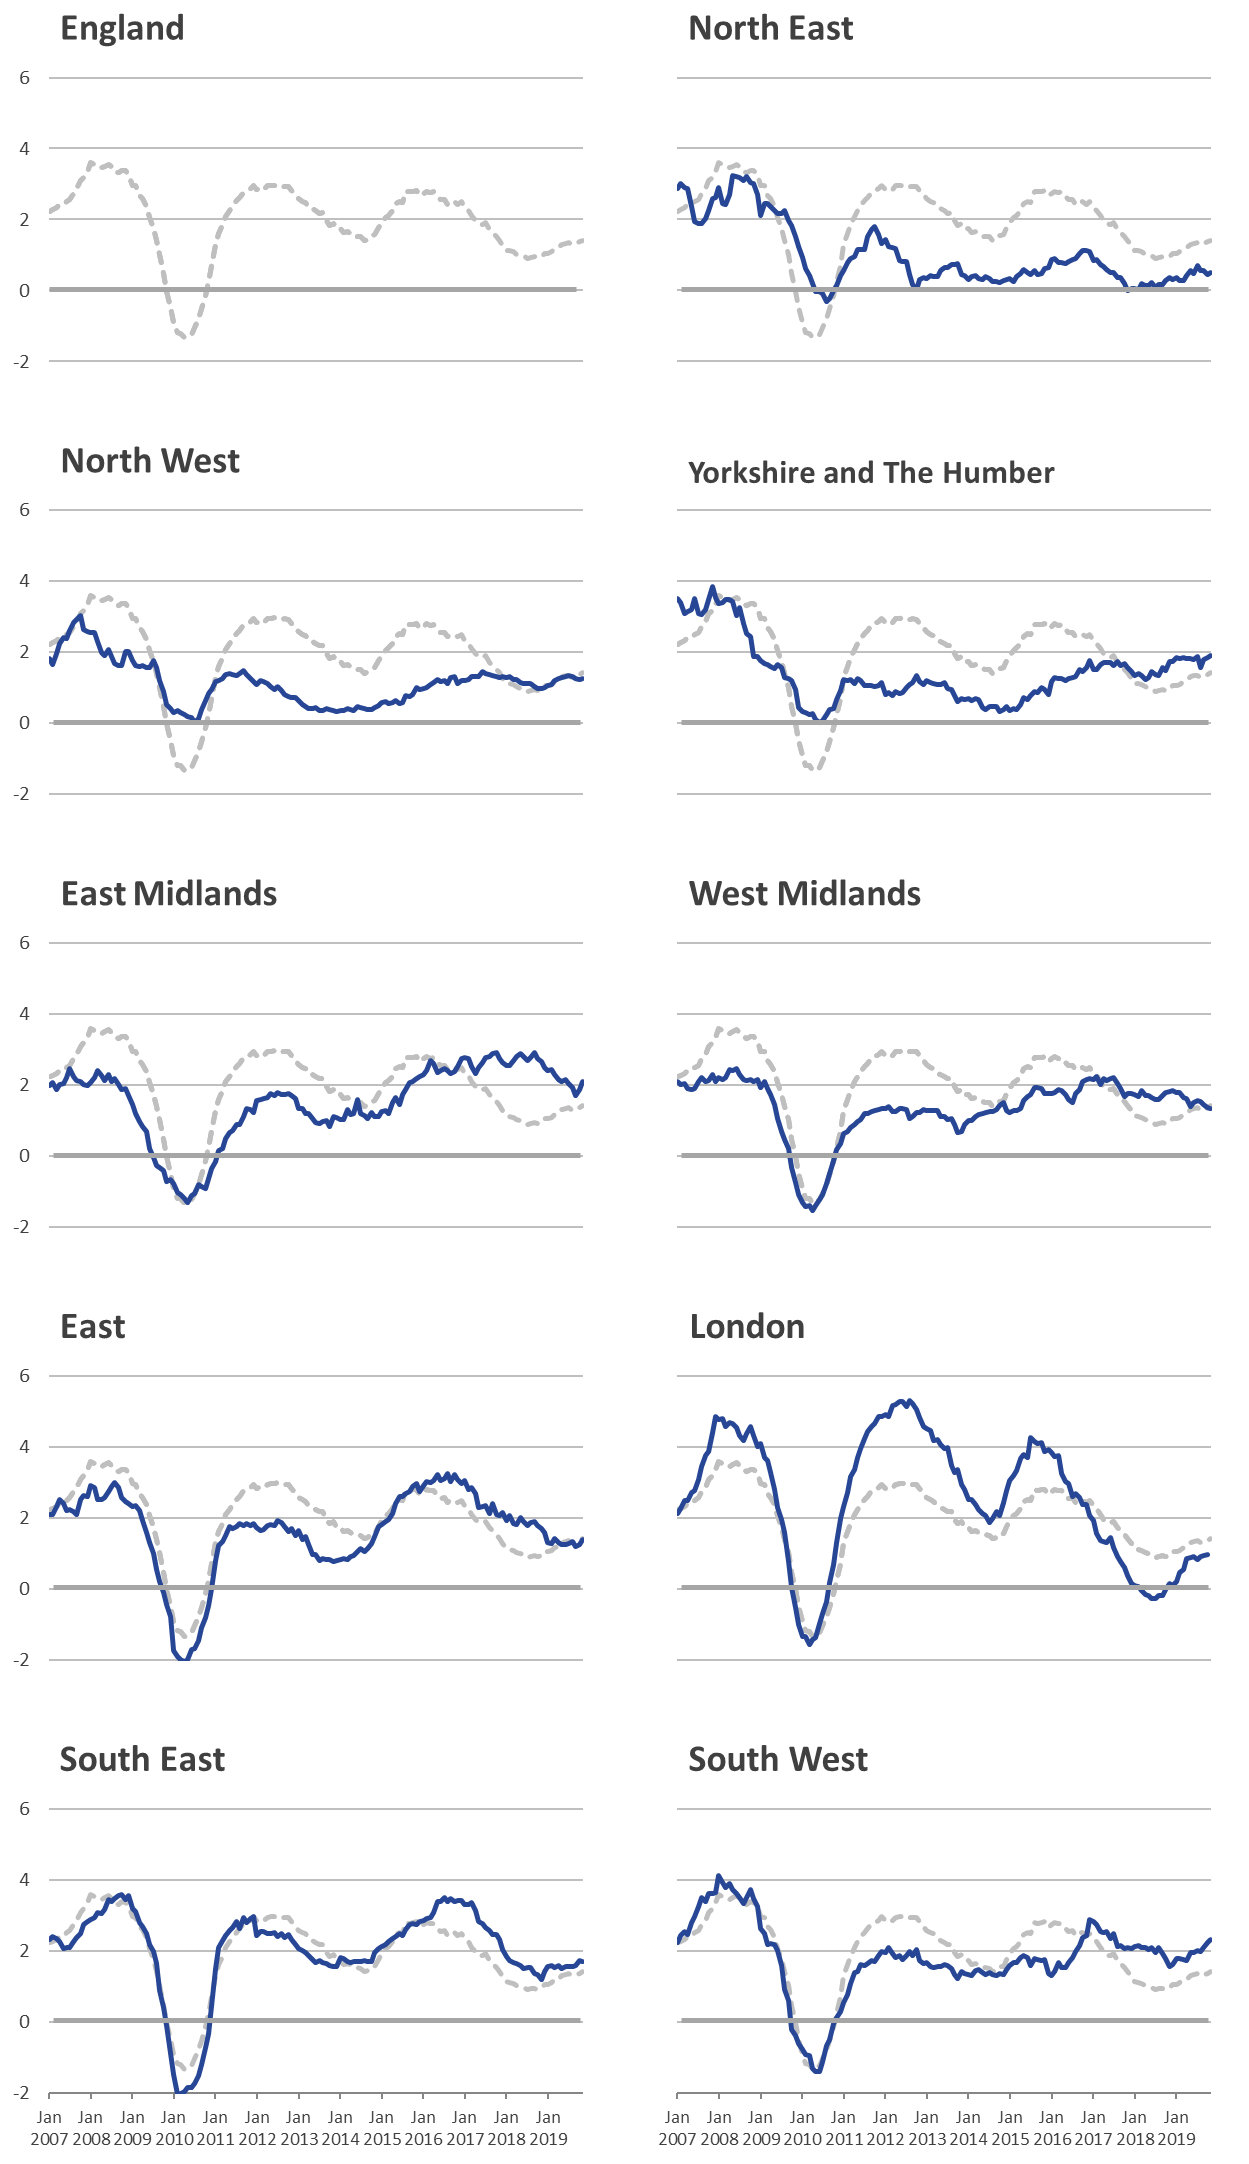
Figure 6: London rental prices experienced greater increases and falls than other regions
Index of Private Housing Rental Prices percentage change over 12 months by English region, January 2007 to November 2019
Source: Office for National Statistics – Index of Private Housing Rental Prices
Notes:
- The grey line shows the average England 12-month percentage change.
Download this image Figure 6: London rental prices experienced greater increases and falls than other regions
.png (203.8 kB) .xls (86.0 kB)
5. Private rental data
Index of Private Housing Rental Prices, UK: monthly estimates
Dataset | Released 18 December 2019
Rental price index historical time series (index values and annual percentage change).
Index of Private Housing Rental Prices, UK: annual weights analysis
Dataset | Released 13 November 2019
Aggregate weights information used in the experimental Index of Private Housing Rental Prices (IPHRP).
Private rental market summary statistics
Dataset | Released 13 December 2019
This collection brings together all documents relating to the private rental market summary statistics previously published by the Valuation Office Agency (VOA).
6. Glossary
Index of Private Housing Rental Prices (IPHRP)
The Index of Private Housing Rental Prices (IPHRP) measures the change in the price tenants face when renting residential property from private landlords.
Local authority
A local authority is a geographical area with a total population of between 2,200 and 1,074,000 people.
Administrative data
Administrative data are data that people have already provided to the government.
Back to table of contents7. Measuring the data
Data sources
The Index of Private Housing Rental Prices (IPHRP) is constructed using administrative data, or data that are already collected by the government for other purposes, to estimate rental prices. The sources of private rental prices are the Valuation Office Agency (VOA); Scottish Government; Welsh Government; and Northern Ireland Housing Executive (NIHE). Data for Northern Ireland also include data provided by Propertynews.com. Estimates are based on a known sample rather than a census.
The sources of the annually updated expenditure weights are the Ministry of Housing, Communities and Local Government (MHCLG); Scottish Government; Welsh Government; NIHE; and the VOA.
The IPHRP's indices are updated on a monthly basis with the new monthly estimate. The data are indexed with January 2015 as a base year. Data for England are provided from January 2005, data for Wales are provided from January 2009, and data from Scotland are provided from January 2011. The UK data are from January 2015.
Quality
More quality and methodology information on strengths, limitations, appropriate uses, and how the data were created is available in the Index of Private Housing Rental Prices QMI.
Back to table of contents8. Strengths and limitations
Large administrative sources
The Index of Private Housing Rental Prices (IPHRP) is constructed using large administrative sources, specified in Section 7: Measuring the data. Annually, over 450,000 private rents prices are collected in England, 30,000 in Wales, 25,000 in Scotland and 15,000 in Northern Ireland.
The index does not only measure the change in newly advertised rental prices but reflects price changes for all private rental properties.
Scope of the IPHRP
The IPHRP is published as price indices rather than average prices. It is also only published down to a country and regional level. While actual rental prices cannot currently be published in the IPHRP owing to data access constraints, we are actively working to acquire the necessary data.
The IPHRP is released as Experimental Statistics.
Back to table of contents