1. Main points
Private rental prices paid by tenants in Great Britain rose by 1.0% in the 12 months to June 2018; unchanged since April 2018.
In England, private rental prices grew by 1.0%, Wales saw growth of 1.1% while Scotland saw rental prices increase by 0.6% in the 12 months to June 2018.
London private rental prices decreased by 0.2% in the 12 months to June 2018; unchanged from May 2018.
2. Things you need to know about this release
The Index of Private Housing Rental Prices (IPHRP) measures the change in price of renting residential property from private landlords. The index is published as a series of price indices covering Great Britain, its constituent countries and the English regions. All data presented are non-seasonally adjusted.
IPHRP measures the change in price tenants face when renting residential property from private landlords, thereby allowing a comparison between the prices tenants are charged in the current month as opposed to the same month in the previous year. The index does not measure the change in newly advertised rental prices only, but reflects price changes for all private rental properties.
The IPHRP is constructed using administrative data. That is, the index makes use of data that are already collected for other purposes to estimate rental prices. The sources of private rental prices are Valuation Office Agency (VOA), Scottish Government (SG) and Welsh Government (WG). All three organisations deploy rental officers to collect the price paid for privately-rented properties. Annually, over 450,000 private rents prices are collected in England and 30,000 and 25,000 in Wales and Scotland respectively. The sources of expenditure weights are the Ministry of Housing, Communities and Local Government (MHCLG), Scottish Government, Welsh Government and the VOA.
IPHRP is released as an Experimental Statistic. While the methodology (PDF, 2.42MB) for IPHRP is final, Northern Ireland is currently excluded from the price index. We are working with Northern Ireland Housing Executive to secure private rental data for Northern Ireland. Once the coverage of IPHRP has been improved to that of the UK, the IPHRP will be assessed against the Code of Practice for Statistics to achieve National Statistics status.
Back to table of contents3. Growth in Great Britain private rental prices slows
Growth in private rental prices paid by tenants in Great Britain has slowed since the end of 2015, increasing by 1.0% in the 12 months to June 2018. For example, a property that was rented for £500 per month in June 2017, which saw its rent increase by the average rate in Great Britain, would be rented for £505 in June 2018. This slowdown in the growth in private rental prices in Great Britain is driven mainly by a slowdown in London over the same period.
The 12-month growth rate of private rental prices paid by tenants in Great Britain in June 2018 was 1.0%, unchanged since April 2018. Rental prices for Great Britain excluding London increased by 1.6% in the 12 months to June 2018, unchanged since January 2018 (Figure 1). The growth rate for London in the 12 months to June 2018 was negative 0.2%, unchanged from May 2018.
Figure 1: Index of Private Housing Rental Prices percentage change over 12 months, Great Britain, January 2012 to June 2018
12-month percentage change
Source: Office for National Statistics
Download this chart Figure 1: Index of Private Housing Rental Prices percentage change over 12 months, Great Britain, January 2012 to June 2018
Image .csv .xlsThe Royal Institution of Chartered Surveyors (RICS) May 2018 Residential Market Survey reported that demand for rented properties remained unchanged (on a non-seasonally adjusted basis) extending a run of five consecutive reports where respondents have reported flat tenant demand. Alongside this, landlord instructions remain in decline. Given the lack of supply, RICS suggests that rents are envisaged to increase at the national level over the year ahead. These pressures can take time to feed through to IPHRP, which reflects price changes for all private rental properties, rather than only new advertised rental properties.
In contrast, the Association of Residential Letting Agents (ARLA) reported in their Private Rented Sector Report for May 2018 that supply of rental properties rose to the highest level recorded for 2018 so far. In context, they also note a continued supply shortage in the rental market.
Between January 2011 and June 2018, private rental prices in Great Britain increased by 15.9% (Figure 2); this was strongly driven by growth in private rental prices within London. When London is excluded from these figures, private rental prices increased by 12.5% over the same period.
Figure 2: Index of Private Housing Rental Prices indices, Great Britain, January 2011 to June 2018
Index values
Source: Office for National Statistics
Download this chart Figure 2: Index of Private Housing Rental Prices indices, Great Britain, January 2011 to June 2018
Image .csv .xls4. Growth in Wales private rental prices above England and Scotland
The annual rate of change for Wales (1.1%) in June 2018 is still marginally higher than the annual rate of change for England (1.0%) and Great Britain (1.0%). Wales showed a broad increase in its annual growth rate between July 2016 (Figure 3) and the end of 2017, but has fallen back during 2018. This slightly stronger growth in Wales may be a response to stronger rental demand in Wales as reported by the Association of Residential Letting Agents (ARLA) in their April 2018 report.
In England, private rental prices grew by 1.0% in the 12 months to June 2018, unchanged from May 2018.
Rental growth in Scotland increased by 0.6% in the 12 months to June 2018, unchanged from May 2018. The historic weaker growth since mid-2016 may be due to stronger supply and weaker demand in Scotland as reported by ARLA.
Figure 3: Index of Private Housing Rental Prices percentage change over 12 months for Great Britain and its constituent countries, January 2012 to June 2018
12-month percentage change
Source: Office for National Statistics
Download this chart Figure 3: Index of Private Housing Rental Prices percentage change over 12 months for Great Britain and its constituent countries, January 2012 to June 2018
Image .csv .xlsAll the countries that constitute Great Britain have experienced rises in their private rental prices since 2011 (Figure 4). Since January 2011, rental prices in England have increased more than those in Wales and Scotland.
Figure 4: Index of Private Housing Rental Prices indices for Great Britain and its constituent countries, January 2011 to June 2018
Index values
Source: Office for National Statistics
Download this chart Figure 4: Index of Private Housing Rental Prices indices for Great Britain and its constituent countries, January 2011 to June 2018
Image .csv .xls5. London private rental prices fall over the year
Growth in private rental prices in London was negative 0.2% in the 12 months to June 2018, unchanged from May 2018. The Royal Institute of Chartered Surveyors (RICS) reported in their May 2018 Residential Market Survey that expectations are still negative in London, an ongoing trend stretching back to August 2016.
Focusing on the English regions, the largest annual rental price increase was in the East Midlands (2.8%), down from 2.9% in May 2018 (Figure 5). This was followed by the South West (2.1%), up from 2.0% in May 2018 and the East of England (1.9%), down from 2.0% in May 2018.
The lowest annual rental price increase was in London (negative 0.2%), unchanged from May 2018. It was followed by the North East (0.2%), up from 0.1% in May 2018.
Figure 5: Index of Private Housing Rental Prices percentage change over the 12 months to June 2018 by English region
12-month percentage change
Source: Office for National Statistics
Download this chart Figure 5: Index of Private Housing Rental Prices percentage change over the 12 months to June 2018 by English region
Image .csv .xlsFigure 6 shows the historical 12-month percentage growth rate in the rental prices of each of the English regions.
Figure 6: Index of Private Housing Rental Prices percentage change over 12 months by English region, January 2007 to June 2018
12-month percentage change

Source: Office for National Statistics
Notes:
- The grey line shows the average England 12-month percentage change.
Download this image Figure 6: Index of Private Housing Rental Prices percentage change over 12 months by English region, January 2007 to June 2018
.png (66.7 kB) .xls (69.6 kB)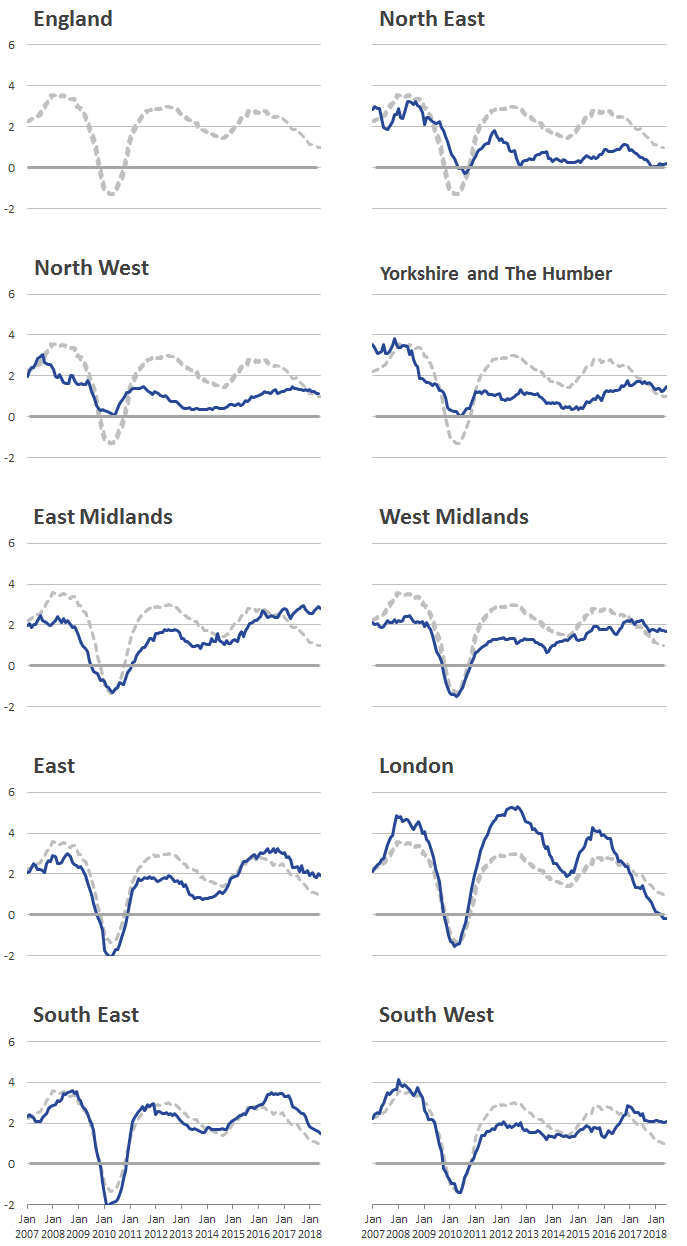
7. Quality and methodology
Details of the methodology used to calculate the Index of Private Housing Rental Prices (IPHRP) can be found in the July 2013 IPHRP article but this article requires some updating. In March 2015, methodological improvements were implemented to improve the matching of properties over time; this ensures that we are comparing “like with like”. These methodological improvements were presented in the January 2015 article.
In September 2015, we published an evaluation of our rental price indices against the growth in average private rental prices published by Valuation Office Agency (VOA); please see the article Explaining private rental growth (PDF, 446KB) for more information. Comparisons of IPHRP against other private rent measures can be found in the article published alongside this release.
The IPHRP Quality and Methodology Information report contains important information on:
the strengths and limitations of the data and how it compares with related data
uses and users of the data
how the output was created
the quality of the output including the accuracy of the data