1. Introduction
Consumer price inflation is an important indicator of how the UK economy is performing. The “shopping basket” of items and their economic importance (or weight) used in compiling the various measures of consumer price inflation1 are reviewed and updated each year to ensure the indices remain representative of the latest consumer spending patterns.
This article focuses on updates to the weights applied within these baskets.
The second section explains what is meant by a weight and why weights are required.
The third section will explain how weights are calculated in consumer price inflation, defining the data sources and methodology used.
The fourth section will look at the aggregation structure, that is, what level are weights calculated at and where are they used to aggregate through price indices.
Finally, the fifth section will take a look at the latest (2019) set of consumer price inflation weights and explain any notable movements when comparing with weights used in 2018.
The datasets in Annex A present the latest (February 2019 updated) Consumer Prices Index including owner occupiers’ housing costs (CPIH) weights (Table W3) and Consumer Prices Index (CPI) weights (Table W1) from 2005 onwards. The latest Retail Prices Index (RPI) weights (Table W2) are also included for reference.
For reference, a similar article was also published in March 2018.
This article will primarily focus on the CPIH. Further detail on the methods and process discussed in this article can be found via the CPIH compendium and the Consumer Price Indices technical manual (PDF, 674KB).
Notes for: Introduction
- Namely CPIH, a measure of UK consumer price inflation that includes owner-occupiers’ housing costs, the Consumer Price Indices (CPI) and the Retail Prices Index (RPI).
2. What is a weight?
Consumer price inflation is the speed at which the prices of goods and services bought by households rise or fall and is estimated by using price indices. One way to understand a price index is to think of a very large shopping basket1 containing goods and services typically bought by households. The price index estimates changes to the total cost of this basket by calculating the average of price changes of the items within the basket.
However, we know that households spend more on some goods and services than others, so we would expect, for example, a 10% increase in the price of petrol to have a much bigger impact on the basket than a similar rise in the price of tea. For this reason, the components of price indices are weighted using the amount we spend on these items as consumers, to ensure that it reflects the relative importance of the various items in the average shopping basket.
The various weights used in the calculation of consumer price inflation, along with the items that form the “shopping basket” are reviewed and updated each year. This ensures weights remain representative of current household expenditure patterns and reflect the introduction of new items into the shopping basket and removal of old ones. A separate article is published that explains the annual update to the content of the consumer price inflation basket of goods and services.
Notes for: What is a weight?
- In reality there are three inflation baskets: for the CPIH, CPI and a basket used by RPI.
3. How do we calculate weights in consumer price indices?
Within Consumer Prices Index including owner occupiers’ housing costs (CPIH) and Consumer Prices Index (CPI), there are four different types of weight:
central and regional shop weights
stratum weights
CPIH and CPI item weights
classification of individual consumption according to purpose (COICOP) weights, for the CPIH and CPI higher-level indices
The order of the bullets is also that in which the weights are used. The first two types of weights are used to produce the item indices (that is, combining the individual items within the basket), the next is used to combine items into higher-level indices (that is, COICOP level indices) and the last is used for all levels above this. Aggregation is explained further in Section 4 or via the technical manual (PDF, 674KB).
This article will now focus on the COICOP-level weights. In 2017, a new, additional level of the COICOP classification was introduced. This new level of detail, known as COICOP5 sits between the existing class (or COICOP4)-level indices and item level indices. Further detail on the impact of introducing this new level of classification can be found in the October 2016 article explaining methodological improvements on the consumer price indices.
Data sources for CPIH and CPI weights
In consumer price inflation, expenditure weights are designed to reflect the expenditure patterns of the target population of households covered by the index. CPIH and CPI have a different target population to the Retail Prices Index (RPI)1 and therefore have different expenditure weights, and thus a different source of data underpinning the weights.
The CPIH and CPI cover all expenditure within the UK by:
private households
residents of institutions such as university halls of residence or nursing homes
visitors to the UK from abroad
Information on spending patterns, which underpin the CPIH and CPI weights, largely comes from the household final consumption expenditure (HHFCE)2 component of the UK National Accounts. These data are used because the expenditure information is comprehensive, and balanced against data collected in other sectors of the economy to create the most accurate picture of consumer spending. However, there are a few exceptions where additional source data is used to supplement the HHFCE data and improve the coherence with the intended scope of the indices:
the Living Costs and Food Survey (LCF) is used to supplement HHFCE data in the calculation of weights for air travel, package holidays and actual rentals
the International Passenger Survey, which is also used in the calculation of a weight for air travel
the public sector component of the national accounts, which is used in the calculation of the weight for passport fees
The HHFCE data used in the annual update of CPIH and CPI weights is always the latest calendar year national accounts dataset that is available at the time of weights calculation, that is consistent in methodology with the latest published UK National Accounts, The Blue Book. The annual CPIH and CPI weights update commences in January each year, so the weights are sourced from the latest national accounts update in Quarter 3 (July to Sept) of the preceding year.
For example, for the 2019 weights update, the latest set of HHFCE expenditure was taken from the Quarter 3 2018 national accounts dataset. These data are consistent with the most recent Blue Book release (Blue Book 2018, published in July 2018). In all cases the current price measure (as opposed to the chained volume measure) is used. Effectively, the 2019 weights are calculated using a more up-to-date version of data in Table 6.2.14 (XLS, 1.0MB) of Blue Book 2018: Individual consumption expenditure at current market prices by households, non-profit institutions serving households and general government: classified by function.
This approach to the use of the latest national accounts data is consistent over time, and will remain so in the future.
Methodology behind the update of COICOP weights and above
Higher-level CPIH and CPI weights (that is, at the COICOP level and above) are updated annually with the January index (published in February), followed by a further update with the February index (published in March) due to the 2017 introduction of improved methodology (the “double update”) for the production of consumer price inflation and to coincide with the introduction of new items to the basket of goods and services. The underlying expenditure in each COICOP grouping is converted to an expenditure share relative to total household expenditure for the overall basket and given an integer weight in parts per thousand so that the sum of the weights equals 1,000.
The weights are based on the latest available calendar year’s HHFCE data; however, these data are not timely enough for immediate use in consumer price indices due to the lag at which national accounts data are published. For example, in Blue Book 2018 the latest available calendar year is 2017. To make the expenditure data as up-to-date as possible, we can restate the expenditure in current prices using a process called price updating, an explanation of which follows.
For a given index year y, the weights are based on the latest available national accounts expenditure from y minus 2.
At the first annual update of weights (published with the January index), the expenditure needs to be price updated to December of year y minus 1. For the 2019 weights this would mean expenditure from the calendar year 2017 is updated to December 2018 by applying the respective change in price between 2017 and December 2018 (known as the price update factor). This process is applied at the lowest level of COICOP within the weighting structure using the accompanying price movement for that COICOP level in CPIH and CPI (this process is presented in formula in Annex E of the CPIH compendium).
At the second update of weights, published with the February index, the same underlying 2017 expenditure is updated to January of year y. So, for the 2019 weights this would mean HHFCE data from the calendar year 2017 is updated to January 2019 by applying the respective change in price between 2017 and January 2019. This approach ensures the latest available expenditure is adjusted so that it is suitable for use in the calculation of consumer price inflation weights. Effectively the same expenditure underpins both the January and February update of weights, with the main difference being the period covered in the price update.
Further details on this double update approach can be found in the October 2016 methodology article and Annex E of the CPIH compendium.
There are two further aspects of the annual weights update that warrant a mention.
Firstly, when calculating the CPIH and CPI weights for insurance (such as insurance connected with the dwelling, travel, health and transport) an average of the most recent three years’ expenditure is used in line with international regulation. As insurance expenditure is recorded on a net basis (the difference between expenditure on insurance premiums and the amount paid out in claims) this approach safeguards against exceptional cases where the amount paid out in claims could exceed the amount paid in premiums.
Secondly, the Revisions Policy for Consumer Price Statistics (PDF, 49KB) means that indices are not usually revised historically. Published weights for consumer price inflation reflect the best available understanding of what households spend their money on in the UK at the time they were produced. Whilst the source data are often revised at a later date, these revisions are not taken into the calculation of weights, that is, only the latest calendar year’s data are used in each weights update. As such, the changes in weights between years may reflect changes in data sources, methods and definitions, as well as changes in spending patterns. For this reason, the weights should not be used to analyse trends in consumer spending over time.
Notes for: How do we calculate weights in consumer price indices?
Further details on the RPI can be found in section 10 of the Consumer Price Indices Technical Manual.
4. The aggregation process in consumer price indices
Having explained how and why weights are calculated in consumer price indices, it is worth defining the various levels of aggregation that weights are used in the production process.
The Consumer Prices Index including owner occupiers’ housing costs (CPIH) and Consumer Prices Index (CPI) are classified according to the classification of individual consumption by purpose, commonly referred to as COICOP. This is the international classification of household expenditure and is used in the production of national accounts, the Living Costs and Food (LCF) Survey and consumer price indices. COICOP enables the consistent classification of individual consumption expenditure incurred by households, non-profit institutions serving households and general government according to their purpose.
In previous years (prior to 2017) there were four COICOP levels, with the fourth COICOP level being commonly referred to as “class level” within consumer prices. Items within these levels are aggregated together using expenditure weights up to the first COICOP level – the headline CPIH or CPI.
Figure 1 presents the aggregation structure in consumer prices prior to the introduction of COICOP5.
Figure 1: Consumer price inflation aggregation structure

Source: Office for National Statistics
Download this image Figure 1: Consumer price inflation aggregation structure
.png (110.5 kB)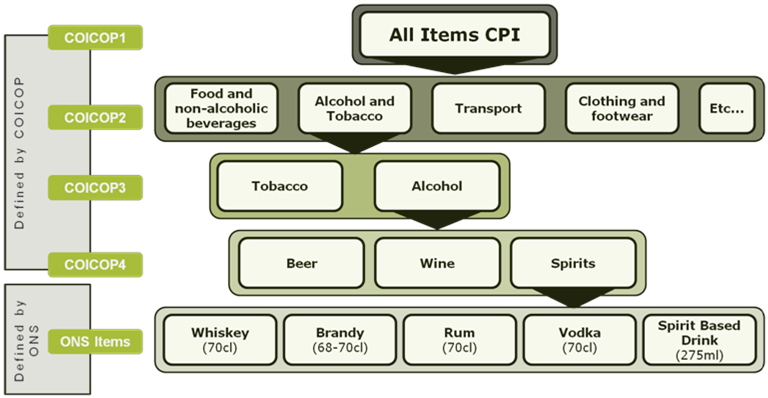
Traditionally the class level was the first building block of aggregation, however, as of March 2017 a new, more detailed level was introduced into CPIH and CPI aggregation. This new level is referred to as COICOP5 and it sits between the existing COICOP 4 level indices and item level indices. Effectively the COICOP5 classification has replaced COICOP4 as the first building block of aggregation in consumer price indices and is the level at which HHFCE data is delivered, price updating of expenditure takes place and COICOP-based weights in consumer price indices are first calculated. Further details on the introduction and impact of COICOP5 in 2017 can be found in the October 2016 article.
Figure 2 shows how the introduction of COICOP5 provides an additional level of detail into the aggregation process.
Figure 2: The introduction of classification of individual consumption by purpose 5 (COICOP5)

Source: Office for National Statistics
Download this image Figure 2: The introduction of classification of individual consumption by purpose 5 (COICOP5)
.png (49.4 kB)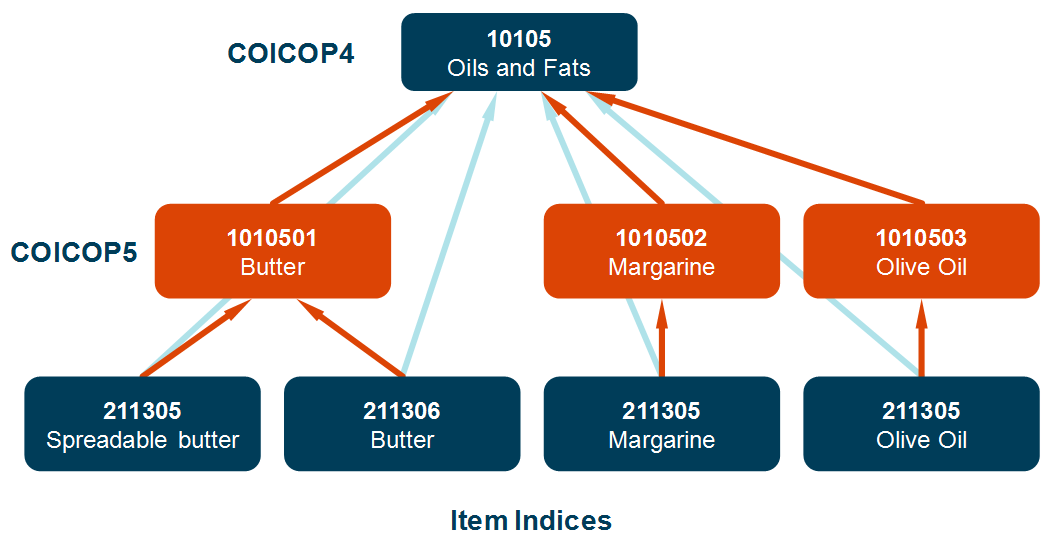
5. Weight changes between 2018 and 2019
This section considers the largest weight changes between 2018 and 2019, focusing on the Consumer Prices Index including owner occupiers’ housing costs (CPIH) weights, and explains the reasons for these changes. These published weights reflect the best available understanding of what households spent their money on at the time the weights were produced. Differences in the weights between years can reflect changes in data sources, methods and definitions, as well as changes in consumer spending in the UK over time. Therefore, these weights should not be used to compare consumer spending over time.
This section will firstly look at the CPIH divisional-level weights (classification of individual consumption by purpose (COICOP2) level) and drill down through the structure to explain any movements when compared with 2018 by looking at the group-level weights (COICOP3 level) and class-level weights (COICOP4 level). Additionally, any notable lower-level movements are also explained.
The datasets in Annex A present the latest (February 2019 updated) CPIH weights (Table W3) and Consumer Prices Index (CPI) weights (Table W1) down to a class level from 2005 onwards. The latest Retail Prices Index (RPI) weights (Table W2) are also included for reference.
Summary of weight changes
The update of 2019 weights has seen two separate updates, in line with the “double update” methodology introduced in 2017:
the first update of weights for the January 2019 set of indices, where expenditure for 2017 is price updated to December 2018
the second update of weights for the February to December 2019 indices, where the expenditure for 2017 is price updated to January 2019
Table 1 presents the CPIH divisional-level COICOP weights. The most notable movements will be explained further in this section, firstly focusing on the comparison of January 2019-updated weights to the latest available weights for 2018 (that is, those updated in February 2018 and used for the period February to December 2018) and then explaining any notable change between the January 2019 and February 2019-updated weights. Typically, changes in weight between years can be caused by two factors:
a change in the underlying expenditure used to calculate the weight
a change in the price factor applied to price update the expenditure
The change when comparing the February 2019 update against the January 2019 update will be driven by any notable movement in price update factor, which is used to price update the underlying expenditure, whereas any change when comparing the January 2019-updated weight with last year’s weights will be due to a combination of changes in expenditure and any notable movement in the price update factor.
| parts per thousand | |||
|---|---|---|---|
| CPIH Division | 2018 weight (ppt) | 2019 weight January update (ppt) | 2019 weight February update (ppt) |
| 0.1 Food and non-alcoholic beverages | 83 | 80 | 82 |
| 0.2 Alcoholic beverages and tobacco | 34 | 32 | 32 |
| 0.3 Clothing and footwear | 57 | 57 | 54 |
| 0.4 Housing, water, electricity, gas and other fuels | 301 | 298 | 298 |
| 0.5 Furniture, household equipment and maintenance | 48 | 52 | 53 |
| 0.6 Health | 21 | 22 | 22 |
| 0.7 Transport | 124 | 124 | 123 |
| 0.8 Communication | 20 | 20 | 20 |
| 0.9 Recreation and culture | 120 | 125 | 127 |
| 10. Education | 18 | 18 | 18 |
| 11. Restaurants & hotels | 97 | 98 | 97 |
| 12. Miscellaneous goods and services | 77 | 74 | 74 |
| Total | 1,000 | 1,000 | 1,000 |
Download this table Table 1: CPIH division level weights, 2018 to 2019
.xls .csvThere are several divisions with notable movements when comparing the January 2019-updated weight with 2018 weights.
Division 01 Food and non-alcoholic beverages
This division has shown a fall of 3 parts per thousand (ppt) when comparing the January 2019-updated weight with 2018, however, the weight then increases by 2 ppt at the February 2019 update.
The fall, when comparing the January 2019-updated weight with 2018 is driven by the following:
within the component COICOP group for food, whilst there is no stand out fall, there is a more general (and small) fall in weight across several of the classes, which leads to the group falling from a weight of 73 ppt in 2018 to 71 ppt in the January 2019 update
there is a more notable fall within the group for non-alcoholic beverages, where the weight has fallen from 10 ppt in 2018 to 9 ppt in the January 2019 update; this is driven by a fall in the price update factor used for components of the coffee, tea and cocoa class; this results in the price-updated expenditure being less than that used in 2018 and hence a fall in weight
This division then experiences an increase of 2 ppt at the February 2019-updated weights (when comparing with January 2019). A general increase in the price for a number of the component classes between January and February 2019 (in particular coffee and tea) is responsible for the increase.
Division 02 Alcoholic beverages and tobacco
This division has shown a fall of 2 ppt when comparing the January 2019-updated weight with 2018. This fall in weight is most notably driven by a fall in the underlying expenditure for the cigarettes class within the component tobacco group. The expenditure used in 2019 weights for cigarettes is approximately 3% lower than the expenditure used in 2018. Other smaller (but less notable) changes within this division also contribute to the overall fall.
Division 03 Clothing and footwear
This division shows no change in weight when comparing the January 2019 update with 2018. However, at the February 2019 update, the weight falls by 3 ppt from 57 ppt to 54 ppt.
This fall in weight at the February 2019 update is driven by the component garments class. Garments is made up of garments for men, garments for women and garments for infants and children, and all three of these saw a fall in price between January and February 2019. The result of this fall in price is to adjust down the price-updated expenditure used in the weights calculation and as a result the derived weight has fallen in comparison with January 2019.
Division 04 Housing, water, electricity, gas and other fuels
This division has shown a fall of 3 ppt when comparing the January 2019-updated weight with 2018. The fall in weight is attributed to the component group for imputed rents, which has seen a fall from 169 ppt to 164 ppt. Both the underlying expenditure and price update ratio are roughly flat for this group when comparing periods, so the fall in weight is driven by a relative reallocation caused by changes elsewhere in the CPIH basket.
Division 05 Furnishings, household equipment and maintenance
This division has seen an increase in weight of 4 ppt from 48 ppt in 2018 to 52 ppt in the January 2019 update.
This increase is driven by an increase in weight for component classes for carpets and rugs, and household furniture. In both cases, the underlying expenditure used in 2019 has increased when compared with the expenditure used in 2018. Of particular note was an increase of almost 90% in the expenditure used for carpets and rugs, however, it should be noted that the 2018 expenditure for this class has been revised upwards in the published national accounts tables. In line with the Revisions Policy for Consumer Price Inflation, these revisions to previous years’ expenditure are not used to recalculate CPI weights.
Division 09 Recreation and culture
This division has increased in weight by 5 ppt from 120 ppt in 2018 to 125 ppt in the January 2019 weights update. There is a general upward trend across most of the groups that comprise this division, however, the largest movements are seen within audio-visual, photographic and information processing equipment, and package holidays:
the group for audio-visual, photographic and information processing equipment has increased by 2 ppt (from 14 ppt to 16 ppt) when comparing the January 2019 weight with 2018; this has been driven by an increase in the underlying expenditure used in 2019 for cameras (of approximately 48%) and accessories for information processing equipment (of approximately 26%)
the group for package holidays has increased in weight by 3 ppt, when comparing January 2019 weight (34 ppt) with 2018 (31 ppt); the weight for package holidays is derived from average weekly spend data from the Living Costs and Food (LCF) Survey; the underlying average spend per week has increased by approximately 13% when comparing back to what was used in 2018 and this increase is driving the rise in weight
The weight for division 09 then sees a further increase of 2 ppt at the February 2019 update (from 125 ppt in January 2019 to 127 ppt). This rise is caused by some marginal increases in price between January and February 2019, coupled by the process of manual rounding of weights. In the January 2019 update, the weight for information processing equipment was close to the rounding cusp and manually rounded down (this process needs to take place at certain times to ensure total weights sum to unity of 1,000), however, in the February 2019 update the weight was rounded up resulting in a 1 ppt increase.
Division 12 Miscellaneous goods and services
This division has fallen in weight by 3 ppt from 77 ppt in 2018 to 74 ppt in the January 2019 update. The fall in weight is attributed to a downward movement in several component groups (insurance, social protection and other services not elsewhere classified), offset by a notable increase in weight for personal effects.
the weight for the component group insurance fell from 7 ppt in 2018 to 5 ppt at the January 2019 update; this was caused mainly by a fall in expenditure of approximately 12% between years
the group for social protection fell by 1 ppt from 14 ppt in 2018 to 13 ppt in the January 2019 update; this fall was caused by a marginal fall in underlying expenditure used in the weights calculation of roughly 3% for childcare services and services to maintain people in care homes
the other fees and services not elsewhere classified group fell by 1 ppt from 10 ppt in 2018 to 9 ppt in January 2019; this fall in weight was driven by a small fall in the underlying expenditure for other fees and services
These small downward movements were offset by an increase of 3 ppt for the personal effects not elsewhere classified group from 12 ppt in 2018 to 15 ppt in January 2019. Within this group, the most notable increase was for the jewellery, clocks and watches class, which increased from 8 ppt in 2018 to 10 ppt in January 2019 driven by an increase of approximately 36% in expenditure for jewellery.
Notable movements between the January 2019 and February 2019 update
This final section focuses on the notable movements in weight between the January 2019 and February 2019 update that have not already been covered previously.
As expected the class for passenger transport by air has seen a fall in weight between the January 2019 and February 2019 updates. The weight has fallen from 6 ppt in the January 2019 update to 4 ppt in February. This is driven by the large seasonal fall in price, which air fares experience between December and January each year. This fall in price, which was approximately 25% in January 2019 has led to the fall in weight of 2 ppt.
Further information
Further information about the construction of the weights can be obtained by contacting:
Telephone +44 (0)1633 456900
Back to table of contentsContact details for this Article
cpi@ons.gov.uk
Telephone: Consumer Price Inflation Enquiries: +44 (0)1633 456900. Consumer Price Inflation recorded message (available after 9.45am on release day): + 44 (0)800 0113703