1. Main points
Recent movements in the sterling exchange rate have fed through into the headline input and output Producer Price Index (PPI), and to a lesser extent the transport component of the Consumer Prices Index (CPI).
Imported materials contributed 6.9 percentage points to the 12.2% increase in input PPI in the year to October 2016.
The effect of increases in the global price of Brent crude oil (priced in dollars) has been amplified by the recent depreciation of sterling.
The contribution from energy products (including fuel) to the CPI turned positive for the first time since November 2014. This is likely due to increasing oil prices as well as price falls for fuel over the second half of 2015.
Back to table of contents2. Introduction
This article provides some additional analysis of the October Producer Price Index and Consumer Prices Index. It has a particular focus on how previous and current movements in the sterling exchange rate may have influenced these data. This is an update of the additional analysis article published in October which included an outline of how changes in the exchange rate could feed through to prices data.
Datasets are available with this release which contain longer time series of PPI and CPI contributions to growth by sector and import intensive products respectively. The datasets also contain further information on which goods and services within the CPI basket are grouped into which category of import intensity. “Import intensity” refers to the percentage of final household consumption which is directly due to imports.
Back to table of contents3. Main definitions
Producer Price Index (PPI): measures change in the prices of goods bought and sold by UK manufacturers. The PPI index is divided into an input price index and an output price index. The input price indices measure change in the prices of materials and fuels bought by UK manufacturers for processing. These are not limited to just those materials used in the final product, but also include those required by the company in its normal day-to-day running. The output price indices measure change in the prices of goods produced by UK manufacturers (these are often called “factory gate prices”).
Further details on definitions and methodology for producing PPI are contained in the statistical release.
Consumer Prices Index (CPI): measures change in the prices of goods and services bought by households. A way to understand this is to think of a large shopping basket containing all the goods and services bought by households. Movements in price indices represent the changing cost of this basket. Further details on definitions and methodology for producing CPI are contained in the statistical release.
Sterling effective exchange rate index (ERI): measures the relative strength of a currency relative to a basket of other currencies.
Back to table of contents4. Analysis of PPI
This analysis is also covered in the Economic context section of the PPI bulletin.
Input producer prices increased by 12.2% in the year to October 2016, compared with an increase of 7.3% in the year to September 2016, the fourth consecutive month of positive input price inflation. The increase in producer price inflation over the past several months can be partly attributed to the changes in the sterling exchange rate. In trade-weighted terms, sterling depreciated by 18.5% in the year to October 2016. All else equal, a depreciation of sterling increases the prices of UK imports, with a corresponding impact on the prices paid by producers for imported inputs. If these producers raise their own prices in response, then movements in the exchange rate can indirectly influence output producer prices.
Figure 1: Contributions to the 12-month rate of input producer price inflation and overall input PPI rate
UK, October 2014 to October 2016
Source: Office for National Statistics
Notes:
- Contributions to Input PPI may not sum up due to weighting.
Download this chart Figure 1: Contributions to the 12-month rate of input producer price inflation and overall input PPI rate
Image .csv .xlsFigure 1 shows the contributions to the 12-month rate of input producer price inflation and overall input PPI rate. Following the EU referendum result and the depreciation of sterling, prices of imported products have been rising steadily over the past several months. Imported food, metals, chemicals, parts and equipment, and other imported materials have been providing higher positive contributions to input PPI, with imported products (excluding crude oil) contributing 6.9 percentage points to the 12.2% increase in input PPI in the year to October 2016.
Oil prices have also been a factor in the upward trend in input producer price inflation. The stabilisation and recent recovery of the oil price over the last year means that the downwards contribution of crude oil to the PPI inflation series has waned in recent months. This can be seen in Figure 1 as the negative contribution of crude oil to input producer price inflation began to ease off from August 2015 onwards, contributing to the gradual rise of the input PPI inflation rate. Crude oil contributed 3.6 percentage points to the 12.2% increase in input producer prices in the year to October 2016. While this upward pressure in crude oil prices can be partly attributed to supply and demand factors in the international market, there is also an effect that can be explained by the depreciation of sterling against the US dollar.
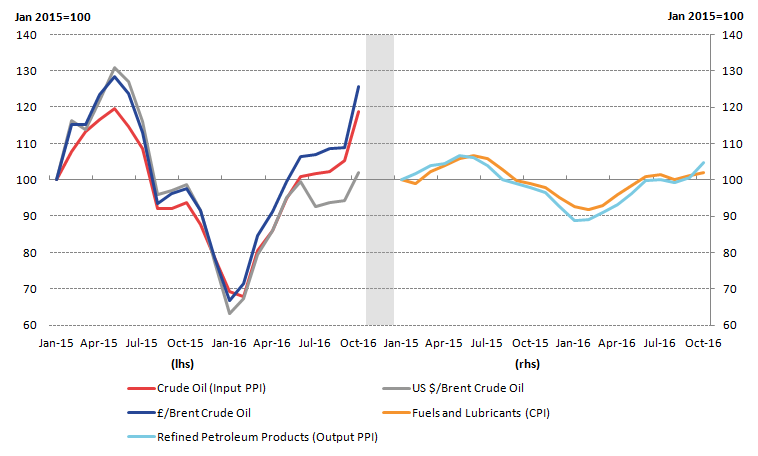
Figure 2: Left hand side: Brent crude oil (in pounds and US dollars) and crude oil (input PPI). Right hand side: Refined petroleum products (output PPI) and Fuels and lubricants (CPI)
UK, January 2015 to October 2016
Source: Office for National Statistics, Financial Times
Download this image Figure 2: Left hand side: Brent crude oil (in pounds and US dollars) and crude oil (input PPI). Right hand side: Refined petroleum products (output PPI) and Fuels and lubricants (CPI)
.png (27.9 kB) .xlsx (15.6 kB)
As most commodities traded on world markets (including crude oil) are priced in US dollars, the fall in the dollar to sterling exchange rate would likely lead to an upward pressure on import prices. The left-hand panel of Figure 2 shows the relationship between the global price of Brent crude oil (in sterling and US dollars) and the price of the PPI input component crude oil. While Brent crude oil in US dollars and sterling closely tracked each other between January and December 2015, the 2 indicators started to deviate at the beginning of 2016. This gap widened further as a result of the depreciation of sterling towards the end of June 2016, following the UK’s referendum on its membership of the European Union. In October 2016, Brent crude oil priced in pound sterling increased at a faster rate than Brent crude oil priced in US dollars. In the year to October 2016, dollar Brent crude oil prices increased by 3.5% compared with 28.8% for pound sterling crude oil prices over the same period.
The additional cost to manufacturers following the increase in crude oil prices in sterling terms is likely to particularly affect the output component of PPI for “refined petroleum products”. In the year to October 2016, refined petroleum products contributed 0.49 percentage points to the 2.1% increase in output PPI. The right-hand panel of Figure 2 shows the relationship between the growth in the price of refined petroleum products (output PPI) and fuels and lubricants (a component of CPI) since January 2015. Both indices have generally moved together over this time period and the relationship may continue over the coming months.
Back to table of contents5. Analysis of CPI
The rate of inflation as measured by the Consumer Prices Index (CPI) increased by 0.9% in the year to October 2016, compared with a 1.0% annual increase in the previous month. The CPI data for October 2016 is the fourth month to include information gathered since the UK’s referendum on its membership of the European Union and the changes in the sterling exchange rate which followed.
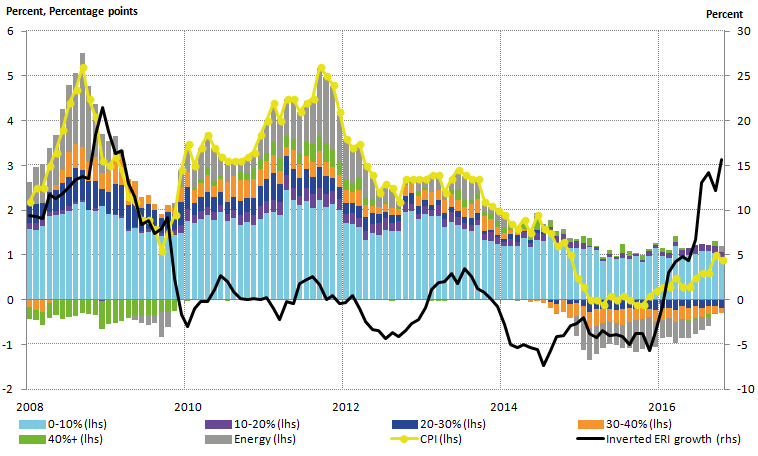
Figure 3 presents contributions to the CPI from products grouped by their relative import intensities, along with the inverted effective exchange rate (ERI). Goods and services which largely originate from domestic producers are grouped together in a low import intensity group, while products which largely come from abroad are grouped into higher import intensity groups. The ERI series has been inverted, so that a depreciation of the currency is represented by an increase in the line graph, helping to interpret a depreciation of the currency as representing a higher sterling equivalent price for imported goods and services. Energy products – which have considerable import content, on which the price of oil has a particular impact – are grouped separately.
Figure 3: Headline CPI inflation, contributions to inflation by import intensity and 12-month growth in effective exchange rate of sterling, monthly average (inverted)
UK, January 2008 to October 2016
Source: Office for National Statistics and Bank of England
Download this image Figure 3: Headline CPI inflation, contributions to inflation by import intensity and 12-month growth in effective exchange rate of sterling, monthly average (inverted)
.png (53.8 kB) .xls (90.1 kB)
Figure 3 shows that the least import-intensive non-energy products have made a fairly steady contribution to the CPI rate of inflation between 2008 and 2016. In October 2016, the largest contribution to the increase in consumer price inflation continued to come from goods in the lowest import-intensive category (0 to 10%), however, this was slightly down from the previous month. The (10 to 20%) and (40% and over) import intensive categories also continued to provide positive contributions to consumer price inflation in October 2016.
The contribution from energy has seen the largest rise on the month, turning positive for the first time since November 2014. This is likely to be due to a combination of factors including the increase in dollar and sterling equivalent oil price during 2016 to date and price falls for the energy component of CPI last year. These base effects – how the movement in last year’s prices affects the growth rate comparison in the current year – are explored further in Section 6.
Back to table of contents6. Understanding the “base effect” and recent fuel price movements
When reporting the changes in the 12-month growth rate, the “base effect” should be taken into consideration. This is when previous changes in a price index lead to headline changes being arithmetically low or high even though more recent trends indicate otherwise.
Table 1 demonstrates this using a hypothetical numerical example.
Table 1: Example of the "base effect" using a hypothetical scenario
| Period | Index, 2010 = 100 | Percentage change on previous month | Percentage change on same month a year ago | |||||||||||
| Jan-15 | 100 | - | - | |||||||||||
| Feb-15 | 95 | -5% | - | |||||||||||
| Mar-15 | 90 | -5.30% | - | |||||||||||
| Jan-16 | 100 | - | 0% | |||||||||||
| Feb-16 | 100 | 0% | 5.30% | |||||||||||
| Mar-16 | 100 | 0% | 11.10% | |||||||||||
| Source: Office for National Statistics | ||||||||||||||
| Notes: | ||||||||||||||
| 1. This is a numerical example and does not reflect real data, any similarity to real data is a coincidence. | ||||||||||||||
Download this table Table 1: Example of the "base effect" using a hypothetical scenario
.xls (27.1 kB)Hypothetical price indices for the same 3 months of 2015 and 2016 are presented in Table 1. In 2015, the index falls from 100 in January to 90 in March and the month-on-month changes are negative. Over the same period in 2016, the index remains at 100 showing no change on the month. However, when we look at the 12-month growth rate, the change is now positive for 2015 to 2016 despite no change in the index in 2016. This example demonstrates how previous movements in a price index can exert upwards pressure even if recent figures are flat.
To see how this applies to recent movements in the fuels and lubricants component of CPI, Figure 4 shows the fuels and lubricants index for 2015 and 2016 rebased to January equals 100 for each year. Prices began falling in July 2015 and this trend continued until February 2016. Therefore, the 12-month growth rates for the second half of 2016 have been quite large even though prices have been relatively stable from June to September 2016. This has amplified contributions from fuels and lubricants to the overall recent increases in CPI.
Figure 4: Fuels and lubricants component of the CPI, Index January = 100 for each year
UK, January 2015 to October 2016
Source: Office for National Statistics
Download this chart Figure 4: Fuels and lubricants component of the CPI, Index January = 100 for each year
Image .csv .xls7. Next steps
We will continue to monitor the impact of changes in the sterling exchange rate on all our economic statistics and will include additional analysis in the statistical releases or separate articles where appropriate.
Back to table of contents