Table of contents
1. Main points
Recent movements in the sterling exchange rate have fed through into the headline input and output Producer Price Index (PPI), and to a lesser extent components of the Consumer Prices Index (CPI) with high import intensity, such as fuels and lubricants.
Imported materials contributed 7.8 percentage points to the 12.9% increase in input PPI in the year to November 2016.
The effect of increases in the global price of Brent crude oil (priced in dollars) has been amplified by the recent depreciation of sterling.
Back to table of contents2. Introduction
This article provides some additional analysis of the November Producer Price Index (PPI) and Consumer Prices Index (CPI). It has a particular focus on how previous and current movements in the sterling exchange rate may have influenced these data. This is an update of the additional analysis article published in November which included an outline of how changes in the exchange rate could feed through to prices data.
Datasets are available with this release which contain longer time series of PPI and CPI contributions to growth by sector and import intensive products respectively. The datasets also contain further information on which goods and services within the CPI basket are grouped into which category of import intensity. “Import intensity” refers to the percentage of final household consumption which is directly due to imports1.
Notes for Introduction section:
- “Import intensity” refers to the percentage of final household consumption which is directly due to imports. This does not include the effect of goods which are imported and then used as inputs for goods produced domestically. As imports data is provided on a Classification of Products by Activity (CPA) basis which is not directly comparable to the COICOP classification, these estimates should be regarded as indicative.
3. Main definitions
Producer Price Index (PPI): measures change in the prices of goods bought and sold by UK manufacturers. The PPI index is divided into an input price index and an output price index. The input price indices measure change in the prices of materials and fuels bought by UK manufacturers for processing. These are not limited to just those materials used in the final product, but also include those required by the company in its normal day-to-day running. The output price indices measure change in the prices of goods produced by UK manufacturers (these are often called “factory gate prices”).
Further details on definitions and methodology for producing PPI are contained in the statistical release.
Consumer Prices Index (CPI): measures change in the prices of goods and services bought by households. A way to understand this is to think of a large shopping basket containing all the goods and services bought by households. Movements in price indices represent the changing cost of this basket. Further details on definitions and methodology for producing CPI are contained in the statistical release.
Sterling effective exchange rate index (ERI): measures the relative strength of a currency relative to a basket of other currencies.
Back to table of contents4. Analysis of PPI
This analysis is also covered in the Economic context section of the PPI bulletin.
Input producer prices increased by 12.9% in the year to November 2016, compared to a 12.4% increase in the year to October 2016, the fifth consecutive month of positive input price inflation. The increase in producer price inflation over the past several months can be partly attributed to the changes in the sterling exchange rate. In trade-weighted terms, sterling depreciated by 17.9% in the 12 months to November 2016. All else equal, a depreciation of sterling increases the sterling price of UK imports if denoted in a foreign currency, with a corresponding impact on the prices paid by producers for imported inputs. If these producers raise their own prices in response, then movements in the exchange rate can indirectly influence output producer prices.
Figure 1: Contributions to the 12-month rate of input producer price inflation and overall input PPI rate
UK, November 2014 to November 2016
Source: Office for National Statistics
Notes:
- Contributions to Input PPI may not sum up due to weighting.
Download this chart Figure 1: Contributions to the 12-month rate of input producer price inflation and overall input PPI rate
Image .csv .xlsFigure 1 shows that imported goods and crude oil are continuing to drive contributions to growth in input producer prices in the year to November 2016. The largest single contributor was crude oil, which contributed 2.9 percentage points to the growth in input producer prices, while imported goods and metals contributed 7.8 percentage points to the overall growth of 12.9%. These changes can be related to a changing oil price and recent sterling depreciation.
Figure 2 looks at how both of these effects relate to the PPI input component crude oil, alongside the refined petroleum products component of PPI output and the fuels and lubricants component of CPI. As most commodities traded on world markets (including crude oil) are priced in US dollars, the fall in the dollar to sterling exchange rate would likely lead to an upward pressure on import prices on a sterling basis.
Figure 2: Left hand side: Brent crude oil (in pounds and US dollars) and crude oil (input PPI). Right hand side: Refined petroleum products (output PPI) and Fuels and lubricants (CPI)
UK, January 2015 to November 2016

Source: Office for National Statistics, Financial Times
Download this image Figure 2: Left hand side: Brent crude oil (in pounds and US dollars) and crude oil (input PPI). Right hand side: Refined petroleum products (output PPI) and Fuels and lubricants (CPI)
.png (37.2 kB) .xls (44.5 kB)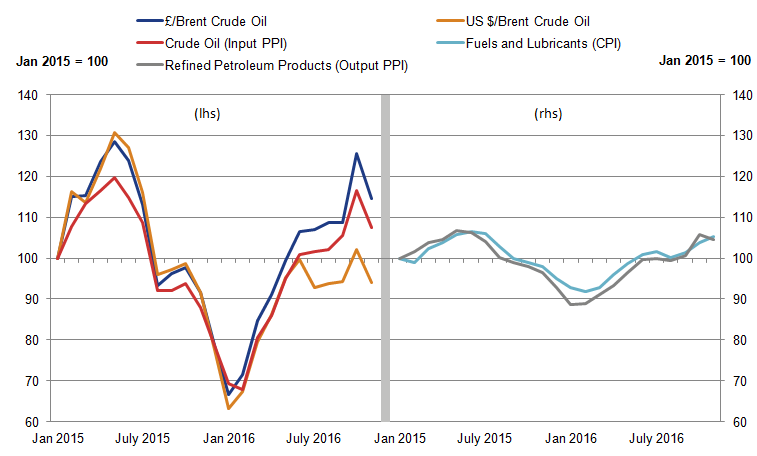
The left-hand panel of Figure 2 shows the relationship between the global price of Brent crude oil (in sterling and US dollars) and the price of the PPI input component crude oil. While crude oil in US dollars and sterling closely tracked each other between January and December 2015, the 2 indicators started to deviate at the beginning of 2016. This gap widened further as a result of the depreciation of sterling towards the end of June 2016, following the UK’s referendum on its membership of the European Union.
Figure 3 looks at these recent trends in more detail. It shows the annual 12-month growth rate of crude oil price in US dollars (blue bars) alongside the price of the PPI input component crude oil (red line). From August 2016, deflation in the US dollar oil price has moderated and growth has turned positive from October. This underlying increase in price has put upward pressure on the PPI input component crude oil, which tracks the dollar oil price closely up until mid-2016. The depreciation of sterling towards the end of June 2016 put further upwards pressure on the crude oil input component. The orange bars in Figure 3 show the annual 12-month change in the sterling to dollar exchange rate. The fall in the most recent 12-month growth rate of crude oil PPI may be due to a combination of a fall in the underlying dollar oil price and a slight strengthening of sterling against the dollar in November.
Figure 3: 12-month growth in Brent crude oil in US dollars, sterling to dollar exchange rate and crude oil (input PPI)
UK, January 2015 to November 2016
Source: Financial Times, Bank of England, Office for National Statistics
Notes:
- For the £/$ exchange rate series, bars which are above the x-axis represent a depreciation of the value of the sterling compared with the dollar over that past 12 months.
- Input PPI (crude oil) is an aggregate measure of imported and domestically sourced crude oil, and therefore may be affected by other factors as well as the exchange rate.
Download this chart Figure 3: 12-month growth in Brent crude oil in US dollars, sterling to dollar exchange rate and crude oil (input PPI)
Image .csv .xlsThe additional cost to manufacturers following the increase in crude oil prices in sterling terms is likely to particularly affect the output component of PPI for “refined petroleum products”. In the year to November 2016, refined petroleum products contributed 0.6 percentage points to the 2.3% increase in output PPI. The right-hand panel of Figure 2 shows the relationship between the growth in the price of refined petroleum products (output PPI) and fuels and lubricants (a component of CPI) since January 2015.
In November 2016, the fuels and lubricants component of CPI continued to rise, with the 12-month growth rate increasing to 7.4% up from 4.7% in the 12 months to October. This is despite a fall in both the crude oil component of input PPI and the refined petroleum product component of output PPI. This may be due to time lags between producers of refined petroleum products increasing their prices and retailers increasing their prices at petrol stations. Figure 2 appears to show this slight lag between the 2 series. Both indices have generally moved together over this time period and the relationship may continue over the coming months.
Back to table of contents5. Analysis of CPI
The rate of inflation as measured by the Consumer Prices Index (CPI) was 1.2% in the year to November 2016, compared with a 0.9% annual increase in the previous month. The CPI data for November 2016 is the fifth month to include information gathered since the UK’s referendum on its membership of the European Union and the changes in the sterling exchange rate which followed.
Figure 4 presents the 12-month growth rate in prices of products grouped by their relative import intensities. Goods and services which largely originate from domestic producers are grouped together in a low import intensity group, while products which largely come from abroad are grouped into higher import intensity groups. Energy products – which have considerable import content, on which the price of oil has a particular impact – are grouped separately.
Figure 4: 12-month growth of CPI and inflation of groups categorised by import intensity
UK, January 2014 to November 2016

Source: Office for National Statistics
Notes:
- This figure highlights certain groups of import intensity (0 to 10%, 30 to 40% and Energy). For a full dataset including 10% to 20%, 20% to 30% and 40%+, please see the chart download.
Download this image Figure 4: 12-month growth of CPI and inflation of groups categorised by import intensity
.png (32.2 kB) .xls (83.5 kB)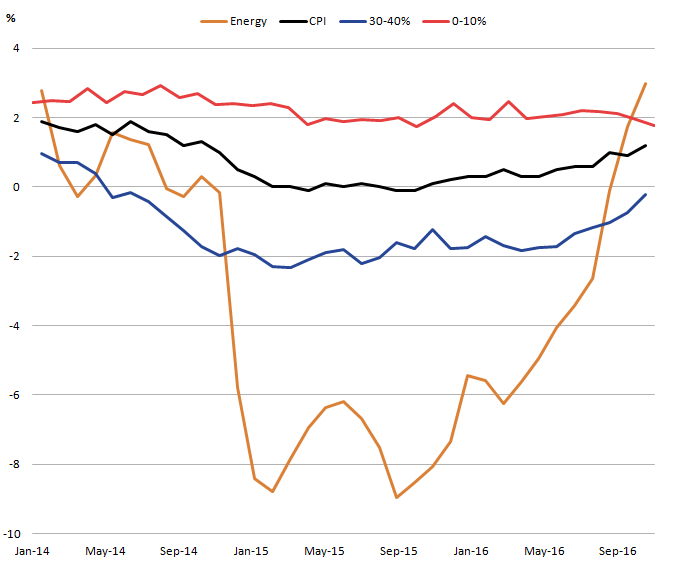
The energy component has experienced the largest changes in prices over the last 2 years. About half of this component is made up of fuels and lubricants, which has been affected by the recent fall and subsequent recovery of the crude oil price.
In November, prices of the energy component grew by 3% compared with the previous year, making it the fastest growing group; the first time this has happened since January 2014. The recent increase in prices for this group is likely to be due to a combination of the recovering oil price, as well as the depreciation of sterling.
As well as energy, all groups showed higher inflation rates in November 2016 than the previous month, with the exception of the lowest import-intensive group (0 to 10%). The main change over the last few months has come from the 30 to 40% component. The annual price change of this group rose from negative 1.7% in June to negative 0.2% in November 2016. Along with energy, components in this group have been the main drivers to the increase in the CPI in recent months.
Figure 5 shows the contributions the different groups make to the CPI, along with the inverted effective exchange rate (ERI). The ERI series has been inverted so that a depreciation of the currency is represented by an increase in the line graph, helping to interpret a depreciation of the currency as representing a higher sterling equivalent price for imported goods and services.
Figure 5: Headline CPI inflation, contributions to inflation by import intensity and 12-month growth in effective exchange rate of sterling, monthly average (inverted)
UK, January 2008 to November 2016

Source: Office for National Statistics and Bank of England
Download this image Figure 5: Headline CPI inflation, contributions to inflation by import intensity and 12-month growth in effective exchange rate of sterling, monthly average (inverted)
.png (47.4 kB) .xls (42.0 kB)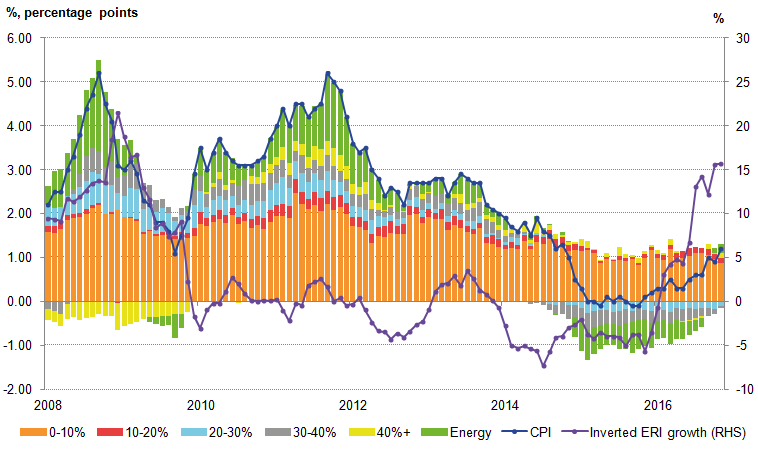
Figure 5 shows that the least import-intensive products (0 to 10%) have made a fairly steady contribution to the CPI rate of inflation between 2008 and 2016. Due to this group making up around half the basket of CPI goods and services, this tends to have the largest contribution to the CPI 12-month growth rate. However, this has fallen steadily over the last few years.
As discussed previously, the recent fall and recovery of the CPI has been largely a result of the energy and 30 to 40% components. Despite these components only representing around 8% and 16% respectively of the total expenditure basket of CPI in 2015, the scale of the price falls was enough to make CPI growth flat in 2015. The weights of both groups have fallen slightly in 2016 to around 7% and 15% of the total basket respectively, however these components have continued to be the main drivers behind the recent increase in CPI. In November 2016, the contribution from the most import-intensive (40% +) group saw the highest increase from the previous month. November 2016 was also the second consecutive month in which energy made a positive contribution to the CPI.
Back to table of contents6. Next steps
We will continue to monitor the impact of changes in the sterling exchange rate on all our economic statistics and will include additional analysis in the statistical releases or separate articles where appropriate.
Back to table of contents