Table of contents
- Key points
- Summary
- About this release
- Recent methodological changes
- Economic commentary 2012
- Regional GVA estimates analysis
- Workplace and residence estimates of regional GVA
- Manufacturing in NUTS1 regions for period 1997 to 2011
- Domestic use of regional, sub-regional and local GVA estimates
- European Union use of UK sub-regional GVA estimates
- Future work plans
- Background notes
- Methodology
1. Key points
In 2012 Gross Value Added (GVA) per head of population increased in all NUTS1 regions except for the East Midlands
In 2012 the South East had the largest increase in GVA per head at 2.5%, followed by the North West at 1.7% and Wales at 1.6%
In 2012 London had the largest GVA per head at £37,232, while Wales had the lowest at £15,401
In 2012 there was a net inflow of GVA due to commuting in three of the NUTS1 regions: London, the North West and Yorkshire and The Humber. All other regions showed a net outflow
Between 1997 and 2011 the contribution of manufacturing to total GVA decreased in each of the NUTS1 regions. The region showing the greatest decrease in absolute terms was the West Midlands, where manufacturing accounted for 27.5% of GVA in 1997 and 13.8% of GVA in 2011
2. Summary
Gross Value Added (GVA) is a measure of the increase in the value of the economy due to the production of goods and services. It is measured at current basic prices, which include the effect of inflation, excluding taxes (less subsidies) on products (for example Value Added Tax). GVA plus taxes (less subsidies) on products is equivalent to Gross Domestic Product (GDP).
Figures are presented for areas according to the Nomenclature of Units for Territorial Statistics (NUTS) (see background note 1).
Table 1: NUTS1 regional GVA<1,2>, 2012<3>
| NUTS1 regions | GVA per head (£)2 | GVA per head growth on 2011 (%) | GVA per head index (UK=100) | Total GVA (£m)2 | Total GVA growth on 2011 (%) | Share of UK total GVA (%) |
| United Kingdom4 | 21,295 | 1.0 | 100.0 | 1,383,082 | 1.6 | 100.0 |
| North East | 16,091 | 1.4 | 75.6 | 41,874 | 1.7 | 3.0 |
| North West | 18,438 | 1.7 | 86.6 | 130,618 | 2.2 | 9.4 |
| Yorkshire & The Humber | 17,556 | 0.4 | 82.4 | 93,339 | 1.0 | 6.7 |
| East Midlands | 17,448 | -0.7 | 81.9 | 79,698 | -0.0 | 5.8 |
| West Midlands | 17,429 | 0.7 | 81.8 | 98,346 | 1.3 | 7.1 |
| East of England | 19,658 | 0.9 | 92.3 | 116,125 | 1.6 | 8.4 |
| London | 37,232 | 0.7 | 174.8 | 309,339 | 2.0 | 22.4 |
| South East | 23,221 | 2.5 | 109.0 | 202,597 | 3.3 | 14.6 |
| South West | 19,023 | 0.4 | 89.3 | 101,576 | 1.2 | 7.3 |
| England | 21,937 | 1.1 | 103.0 | 1,173,512 | 1.8 | 84.8 |
| Wales | 15,401 | 1.6 | 72.3 | 47,344 | 1.9 | 3.4 |
| Scotland | 20,013 | 0.1 | 94.0 | 106,342 | 0.4 | 7.7 |
| Northern Ireland | 16,127 | 0.7 | 75.7 | 29,410 | 1.2 | 2.1 |
| Extra-Regio | n/a | n/a | n/a | 24,160 | -10.6 | 1.7 |
| Source: Office for National Statistics | ||||||
| Notes: | ||||||
| 1. GVA at current basic prices on workplace basis. | ||||||
| 2. Figures may not sum due to rounding in totals; per head (£) figures are rounded to the nearest pound. | ||||||
| 3. 2012 estimates are provisional. | ||||||
| 4. Per head and per head index figures exclude the statistical discrepancy and Extra-Regio: off-shore contribution to GVA that cannot be assigned to any region (see background note 1). These are included in the total GVA figure. | ||||||
Download this table Table 1: NUTS1 regional GVA<1,2>, 2012<3>
.xls (29.2 kB)
Map 1: Regional GVA per head UK map, 2012

Source: Office for National Statistics
Download this image Map 1: Regional GVA per head UK map, 2012
.png (31.2 kB)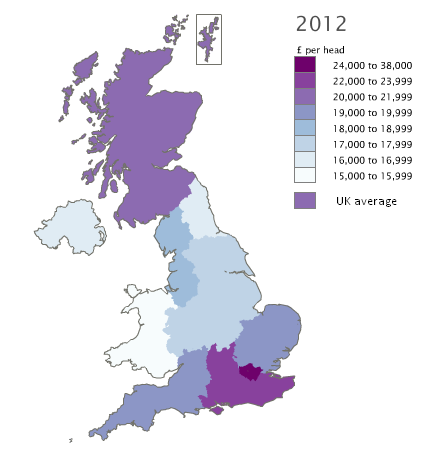
3. About this release
These regional estimates of Gross Value Added are measured using the income approach, which involves adding up the income generated by resident individuals or corporations in the production of goods and services. It is calculated gross of deductions for consumption of fixed capital, which is the amount of fixed assets used up in the process of production in any period.
The main components of income based Gross Value Added are:
- Compensation of Employees;
- Gross Operating Surplus (the sum of self-employment income, gross trading profits and surpluses, non-market capital consumption, rental income less holding gains);
- Taxes (less subsidies) incurred as a result of engaging in production, independently of the quantity or value of goods and services produced (for example business rates).
These estimates are consistent with the National Accounts Blue Book 2013. National aggregates for the components of GVA are allocated to regions using the most appropriate regional indicator available. These estimates are produced at current prices which include the effect of inflation.
GVA estimates in this bulletin are available at three geographical levels, in accordance with the Nomenclature of Units for Territorial Statistics (NUTS). Changes to NUTS areas came into force on 1st January 2012 (see background note 1).
GVA per head of population is a useful way of comparing regions of different sizes and is an important indicator for both domestic and European policy purposes. It is calculated using the entire population (including the economically inactive). Population data from the 2011 ONS Census for England and Wales and the Northern Ireland Census 2011 have been used in these estimates. Population estimates from the 2011 Scottish Census are not yet available for the years 2002 to 2010 at the NUTS1 level and for 2002 to 2012 for NUTS2 and NUTS3 areas. Therefore, for these periods this statistical bulletin will contain limited estimates of regional GVA per head for Scotland. Where data for Scotland are missing, it is not possible to calculate a UK per head value or regional indices. A complete set of per head estimates and indices will be published during 2014 when the full range of data becomes available.
These regional GVA estimates update those published in December 2012. The estimates for 2012 are released for the first time with revisions back to 1997 (see background note 6). Industry estimates are provided at t-2 (where t is the current year) for all levels of geography.
4. Recent methodological changes
Following the 2012 ONS Methodology Directorate review of smoothing and commuter adjustments in the UK Regional Accounts it was decided to cease smoothing estimates of regional Gross Value Added. This is the first publication of regional GVA estimates in which this change has been implemented. The subsequent consultation process on workplace and residence estimates resulted in the development of independent residence and workplace estimates of Compensation of Employees (CoE) for the NUTS1 regions. The review process also led to improved estimation of corporate profits by using Annual Business Survey (ABS) Gross Operating Surplus/Mixed Income (calculated as ABS approximate GVA less ABS CoE) as a regional indicator. The national Gross Trading Profits of Other Corporations (GTPOC) was previously allocated to regions using CoE data from other sources. These changes are introduced for the first time in this statistical bulletin.
The European Commission task force for regional accounts methodology recommended that residence-based income of embassy personnel, armed forces based overseas and individuals working on the continental shelf (for example in North Sea oil and gas extraction) should not be allocated to Extra-Regio (see background note 1). The aim is to achieve a consistent approach across the 27 EU Member States. This is the first publication of regional GVA where these elements of residence-based CoE, formerly allocated to Extra-Regio, are allocated to NUTS regions.
Manufacturing sub-sections of production consistent with the Standard Industrial Classification of All Economic Activities (UK SIC 2007) are presented in this regional GVA statistical bulletin (at NUTS1 and NUTS2 levels) for the first time in response to user demand.
In keeping with UK National Accounts commitment to meeting the European Commission definition of Gross National Income, improved estimates of investment in artistic originals (for example composition of music) and own-account software are included in the gross trading profits and surplus component of regional GVA.
5. Economic commentary 2012
Economic output increased in Q1 (January – March) 2012 and Q3 (July – September) 2012 but declined in Q2 (April – June) 2012 and Q4 (October – December) 2012. The decline in output during Q2 coincided with a change in bank holidays for the Diamond Jubilee and the wettest April to June period on record, which is likely to have had some impact on certain sectors of the economy. By contrast, the Olympics and Paralympics took place during Q3 (July – September) 2012 which helped raise the level of output in this quarter. Overall the UK economy is estimated to have seen output increase in real terms by 0.1% in 2012 when compared with 2011.
The overall increase in GDP in 2012 compared with 2011 was due to increases in household final consumption expenditure and general government final consumption expenditure which helped to compensate for an increased deficit in net trade that weighed down on overall growth.
The total foreign exports of goods from each of England, Wales and Northern Ireland decreased in 2012 compared with 2011 due mostly to declines in Exports to the EU. However, Scotland experienced an increase in total exports (1.3%), helped by a 4.0% increase in non-EU exports. With a reduction of 10.4%, Wales experienced the largest overall decrease in exports in 2012. Of the English regions the largest decrease in total exports was the East of England (-4.3%), while the West Midlands saw the largest increase (7.3%).
Interest rates remained at 0.5% and although inflation slowed it stayed above the Bank of England’s target of 2% throughout 2012. The Consumer Price Index (CPI) rose by 2.7% from 2011 to 2012 following a 4.2 % rise from 2010 to 2011.
The number of workforce jobs increased from December 2011 to December 2012 in most of the UK with a 3% increase in jobs in Wales and a 2% increase in Scotland, London, South East, West Midlands and Yorkshire and The Humber. Only the East of England, East Midlands and the North East of England witnessed a decline in the total number of workforce jobs during this period.
In general, unemployment rates fell and employment rates increased from Q4 2011 to Q4 2012, although the change wasn’t statistically significant in most cases. London, however, did experience a statistically significant increase in the employment rate and decrease in the unemployment rate. The other region with a statistically significant increase in the employment rate was the West Midlands. The claimant count rate of Jobseekers Allowance claimants decreased slightly in most of the English regions and Scotland, although in the North East and Northern Ireland there was an increase whilst in Wales there was no change year-on-year.
Back to table of contents6. Regional GVA estimates analysis
In 2012 GVA per head of population increased in all NUTS1 regions except for the East Midlands where it decreased by 0.7%. The largest increase was in the South East at 2.5% followed by the North West at 1.7% and Wales at 1.6%.
Figure 1: NUTS1 GVA per head index comparison with UK average, 1997 and 2012
Source: Office for National Statistics
Download this chart Figure 1: NUTS1 GVA per head index comparison with UK average, 1997 and 2012
Image .csv .xlsWhen compared with the UK average, in 1997 and 2012, only London and the South East had per head indices above the UK value. During this period three regions’ per head indices increased compared with the UK average. These were London, which increased from 164.6 to 174.8, the North East, which increased from 73.1 to 75.3 and the North West, which increased from 85.5 to 86.6. The largest decrease compared with the UK average was in the West Midlands which decreased from 90.7 in 1997 to 81.8 in 2012.
Map 2: Regional GVA UK map, 2012

Source: Office for National Statistics
Download this image Map 2: Regional GVA UK map, 2012
.png (31.8 kB)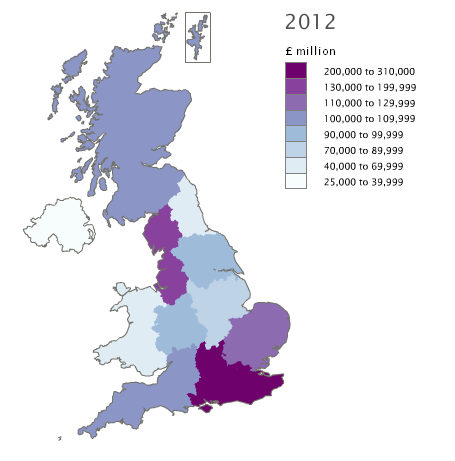
In 2012 total GVA increased in each NUTS1 region except for the East Midlands. The largest increase occurred in the South East (3.3%) followed by the North West (2.2%).
Figure 2: NUTS1 shares of total GVA, 1997 and 2012
Source: Office for National Statistics
Download this chart Figure 2: NUTS1 shares of total GVA, 1997 and 2012
Image .csv .xlsLondon and the South East are the only regions to have increased their share of UK GVA (including Extra-Regio) in the period 1997 to 2012. London (22.4%) and the South East (14.6%) had the largest regional shares of UK GVA in 2012.
London had the largest increase in share of GVA between 1997 and 2012, from 19.4% to 22.4%. The West Midlands had the largest decrease in share of GVA between 1997 and 2012, from 8.0% to 7.1%.
Sub-regional (NUTS2) and local area (NUTS3) GVA estimates
In 2012 total GVA increased in 30 of the 37 NUTS2 sub-regions. The largest increase was in Surrey, East and West Sussex at 5.6%, followed by Hampshire and Isle of Wight at 3.2% and Greater Manchester at 3.1%. The largest decrease in total GVA was in Highlands and Islands at 3.5% followed by Lincolnshire at 2.4%.
In 2012 total GVA increased in 94 of the 139 NUTS3 local areas. The largest increase in 2012 was in Surrey at 8.1%, followed by Stoke-on-Trent at 7.1%. The largest decrease was in Caithness & Sutherland and Ross & Cromarty at 8.5%, followed by Dumfries & Galloway at 8.4%.
Back to table of contents7. Workplace and residence estimates of regional GVA
At NUTS1 level both workplace and residence estimates of regional GVA are produced. Workplace estimates show the GVA that can be allocated to the region in which individuals work, whereas residence estimates show the GVA that can be allocated to the region in which individuals live.
As mentioned in the ‘Recent Methodological Changes’ section, new methods for calculating workplace and residence GVA estimates have been introduced for this publication. Both measures are now produced separately using relevant data sources.
Figure 3: Residence and workplace estimates of regional GVA, 2012
Source: Office for National Statistics
Download this chart Figure 3: Residence and workplace estimates of regional GVA, 2012
Image .csv .xlsChart 3 shows a comparison of workplace and residence estimates of regional GVA. Nine of the 12 regions had a higher residence-based GVA than workplace-based GVA. The exceptions showing a net inflow due to commuting were the North West, Yorkshire and The Humber and London.
The largest component of income based GVA is Compensation of Employees (CoE). This is where the difference in residence and workplace GVA originates. Extra-Regio has a higher workplace GVA since it excludes residence-based CoE.
Figure 4: Residence and workplace estimates of regional CoE, 2012
Source: Office for National Statistics
Download this chart Figure 4: Residence and workplace estimates of regional CoE, 2012
Image .csv .xlsChart 4 shows a comparison of residence and workplace estimates of CoE. There is a similar pattern to that of the GVA chart, with the exception of Extra-Regio. In keeping with European Union recommendations there are no residents allocated to Extra-Regio; those who work outside UK regions are allocated to their region of usual residence. See point 2 in the ‘Recent Methodological Changes’ section for further information.
In 2012 London had both the highest residence-based and workplace-based CoE. Northern Ireland was the region with the lowest workplace-based and residence-based CoE. Looking at the two measures, the South East closely followed London in terms of residence CoE, but in workplace GVA London was much further ahead.
Back to table of contents8. Manufacturing in NUTS1 regions for period 1997 to 2011
The contribution of manufacturing to UK GVA (including Extra-Regio) decreased over the time series, from 18.7% in 1997 to 10.3% in 2011. Over this period the contribution to UK GVA of each manufacturing sub-section except for sub-section CF (basic pharmaceutical products and preparations) decreased. The largest decrease in contribution to UK GVA was in sub-section CH (basic metals and metal products).
Table 2: Manufacturing as a share of total GVA by NUTS1 region, 1997 and 2011
| NUTS1 regions | 1997 | 2011 |
| United Kingdom including Extra-Regio | 18.7 | 10.3 |
| North East | 25.9 | 15.5 |
| North West | 24.5 | 15.6 |
| Yorkshire and The Humber | 24.4 | 14.3 |
| East Midlands | 27.0 | 15.8 |
| West Midlands | 27.5 | 13.8 |
| East of England | 19.4 | 12.3 |
| London | 7.0 | 2.7 |
| South East | 16.5 | 8.6 |
| South West | 19.2 | 12.3 |
| England | 18.6 | 10.2 |
| Wales | 25.3 | 16.8 |
| Scotland | 20.6 | 11.3 |
| Northern Ireland | 21.6 | 13.0 |
| Source: Office for National Statistics | ||
Download this table Table 2: Manufacturing as a share of total GVA by NUTS1 region, 1997 and 2011
.xls (26.6 kB)Over this period the contribution of manufacturing to regional GVA declined in each NUTS1 region. The regions showing the greatest decrease in absolute terms are the West Midlands, where manufacturing accounted for 27.5% of GVA in 1997 and 13.8% in 2011, and the East Midlands, where manufacturing accounted for 27.0% of GVA in 1997 and 15.8% of GVA in 2011.
In the West Midlands the contribution of each manufacturing sub-section to GVA decreased over this period, with sub-section CH (basic metals and metal products) and sub-section CG (rubber and plastic products) decreasing most sharply. The contribution of sub-section CH to the West Midlands GVA decreased from 5.8% in 1997 to 2.5% in 2011. This was the largest sub-section decrease in any region over this period.
Sub-section CH (basic metals and metal products) made the largest contribution to the GVA of the West Midlands in each year until 2011, when sub-section CL (transport equipment) became the largest sub-section.
In the East Midlands the contribution to total GVA of sub-section CB (textiles, wearing apparel and leather products) and sub-section CL (transport equipment) decreased most sharply between 1997 and 2011. Sub-section CB decreased from 3.4% to 0.9% and sub-section CL decreased from 4.1% to 2.4% over this period.
In both West Midlands and East Midlands the contribution to GVA of industry section L (real estate activities) and section Q (human health and social work activities) increased most over the time series.
In the period 1997 to 2011 the contribution of manufacturing to GVA at regional level was lowest in London, where it decreased from 7.0% in 1997 to 2.7% in 2011. In London the contribution of each manufacturing sub-section to GVA decreased over this period, with the largest decrease occurring in sub-section CC (wood and paper products and printing), from 1.2% in 1997 to 0.4% in 2011. In London the contribution of industry section K (financial and insurance activities) increased most over the time series, from 15.8% in 1997 to 19.8% in 2011.
In three NUTS1 regions the sub-section making the largest contribution to manufacturing GVA remained unchanged throughout the period 1997 to 2011: in Northern Ireland and Scotland sub-section CA (food products, beverages and tobacco) made the largest contribution to manufacturing in each year of this time series; in the South West sub-section CL (transport equipment) made the largest contribution to manufacturing GVA in each year of the time series.
Back to table of contents9. Domestic use of regional, sub-regional and local GVA estimates
These statistics provide an overview of economic performance at regional and sub-regional level, allowing comparison between the countries and regions of the UK. They provide information about regional economic diversity and the relative importance of different industries to regional economies.
They are used by the UK Government and the Devolved Administrations of Northern Ireland, Scotland and Wales to formulate and monitor economic policy and allocate resources. These statistics are used in the development of the ‘Programme for Government’ and the ‘Economic Strategy for Northern Ireland’. They are also used in respect of Public Service Agreement (PSA) targets for several Northern Ireland government departments. The Scottish Government uses regional GVA estimates in the production of Supply and Use tables and short-term estimates of GVA included in the Scottish Quarterly National Accounts, produced as part of the Scottish National Accounts Project (SNAP). GVA per head estimates are one of the Welsh Government’s ‘Programme for Government’ outcome indicators for Growth and Jobs.
The Department for Business, Innovation and Skills (BIS) uses regional and sub-regional GVA estimates in monitoring regional economic performance. They are currently used in the BIS publication ‘Regional Economic Performance Indicators’. Local authorities and regional observatories use these statistics to facilitate evidence-based policy making and economic intervention, for example assisting Local Enterprise Partnership (LEP) applications and regional growth funding bids.
These statistics inform the general public about the state of the economy and provide insight into the relative economic positions of local areas and issues such as the ‘North-South divide’. The House of Commons Library produces a standard note about these statistics and they are frequently the subject of parliamentary questions raised by Members of Parliament.
The ONS Regional Accounts team also receives general enquiries relating to these estimates from a diverse range of bodies including the Bank of England, other government departments, local authorities, business analysts, consultancy firms, financial institutions, economists and the media (provincial and national). These statistics also facilitate academic research by individuals and universities within the UK and abroad.
The countries and regions of the UK have differing demographic characteristics, industrial structure and economic performance. There is also a wide variation in the size and population of the regions which makes it difficult to compare regional economic performance using cash totals. Estimates on a per head basis allow for the comparison of regions significantly different in absolute size.
Figure 5: NUTS3 GVA per head variation within NUTS1 regions, 2012

Source: Office for National Statistics
Download this image Figure 5: NUTS3 GVA per head variation within NUTS1 regions, 2012
.png (31.6 kB) .xls (135.7 kB)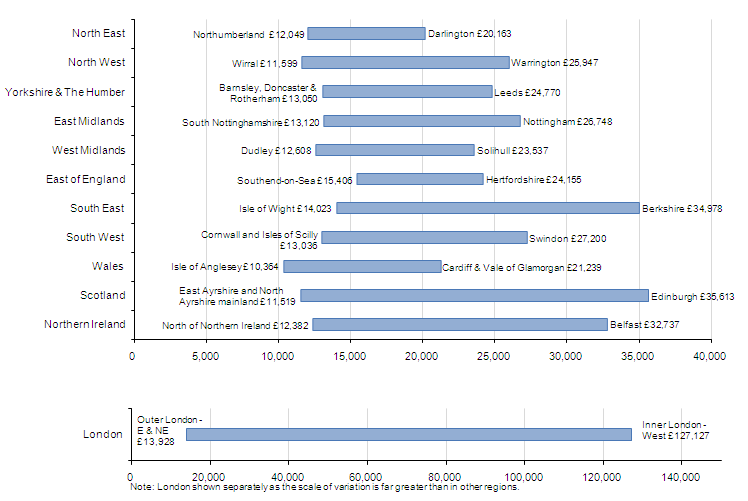
There is considerable variation in the range of GVA per head within NUTS1 regions of the UK. Variation in 2012 is illustrated in Chart 5. The NUTS3 local areas with the highest and lowest GVA per head within a NUTS1 region determine the range of GVA per head within that region.
Back to table of contents10. European Union use of UK sub-regional GVA estimates
The production of regional GVA is a legal requirement under the European System of Accounts. The sub-regional (NUTS2) estimates are used to inform European Union (EU) structural funding decisions. GDP is calculated in the currencies of the Member States and converted initially into Euros and then into an artificial common currency called the Purchasing Power Standard (PPS). This makes it possible to compare the purchasing power of different national currencies.
The resulting GDP per inhabitant estimates (expressed in terms of PPS) provide a measure of the total economic activity in a region and may be used to monitor and compare the economic development of regions over time.
The purpose of EU structural funding is to redress regional imbalances by supporting the development of regional economies. Convergence funding provided by the European Regional Development Fund (ERDF) and the European Social Fund (ESF) is allocated within the current round of funding (covering the period 2007 to 2013), to promote growth-enhancing conditions and factors leading to economic convergence for the least developed EU Member States and regions.
Where the average GDP per inhabitant of a region (in PPS), over an agreed three year period, falls below 75% of the average for the 27 EU Member States (EU-27), full convergence funding is allocated to promote economic development. A ‘phasing-out’ element of the current funding process is allocated to regions with GDP per inhabitant just above the threshold. UK receives full convergence assistance for Cornwall and the Isles of Scilly and West Wales and The Valleys, while Highlands and Islands receives ‘phasing-out’ support.
The most recent Eurostat GDP per inhabitant estimates published in March 2013 (expressed in PPS) show the EU-27 average at 24,500 PPS, up from 23,500 PPS in 2009. The following chart illustrates the variation in the range of GDP per inhabitant (expressed in PPS) within the EU Member States at NUTS2 level in 2010. Inner London had the highest GDP per inhabitant (PPS) of the NUTS2 regions within the EU at 80,300 PPS.
Figure 6: Variation across the European Union, 2010
Gross domestic product (GDP) per inhabitant, in purchasing power standard (PPS), by NUTS 2 regions, 2010 <1> (% of the EU-27 average, EU-27=100)
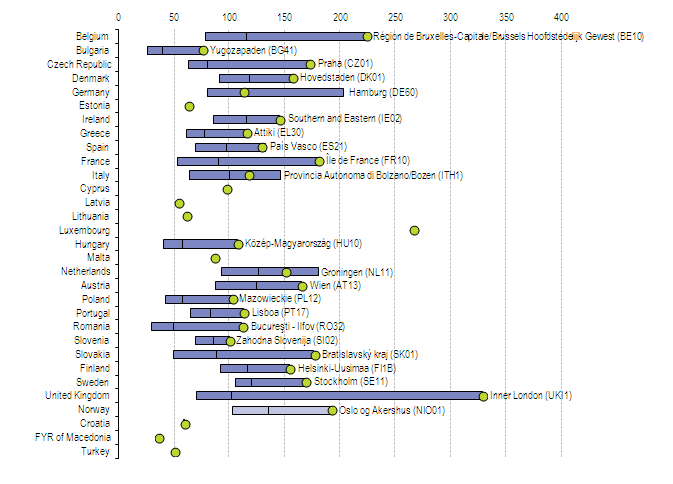
Source: Eurostat
Notes:
- The figure shows the range of the highest to lowest region for each country; the black vertical line is the average (mean); the green circular marker is the capital city (for those countries where there is no regional breakdown, the national average is used as the value for the capital region); the name of the region with the highest value is also included.
Download this image Figure 6: Variation across the European Union, 2010
.png (33.5 kB) .xls (67.6 kB)
11. Future work plans
A full range of Scottish Census population became available in May 2014. Updated reference tables containing a complete time series of GVA per head and GVA per head indices for all regions of the UK were published on 7th July 2014.
ONS plans to publish estimates of regional Gross Value Added using the income approach (GVA(I)) for 1997 to 2013 in December 2014.
The publication of Regional Gross Disposable Household Income (GDHI) estimates for the period 1997 to 2012 is currently planned for Spring 2014. This will include 2011 Census updated population counts.
On the 18th December 2013 ONS Regional Accounts will publish experimental estimates of regional real Gross Value Added, compiled using the production approach (GVA(P)). These estimates will be in constant prices, deflated to remove the effect of inflation. ONS is committed to deliver estimates of real GVA growth rates to Eurostat from 2014, in accordance with EU legislation (166.2 Kb Pdf) . In December 2014 regional GVA(I) and regional GVA(P) will be published in separate statistical bulletins. GVA(P) will remain experimental and GVA(I) will continue to be the lead National Statistic. In the longer term (2014-15) a regional GVA balancing project will consider the viability of producing a single balanced measure of regional GVA.
Relevant methodological changes arising from the introduction of the European System of National Accounts 2010 (ESA 2010) will be implemented in the regional accounts during the course of 2014, in step with the UK National Accounts.
During 2014 the Open Data Project will improve access to Regional Accounts data on the ONS website and offer greater facility for users to customise datasets.
A revised Regional Accounts Methodology Guide, GVA Inventory and GDHI Inventory will be published in 2014.
Changes in NUTS boundaries arising from the 2013 NUTS review will become active in January 2015. These changes will be implemented in the regional GDHI publication scheduled for Spring 2015 and the regional GVA(I) and GVA(P) publications scheduled for December 2015.