Table of contents
- Main points
- Statistician’s quote
- Future changes
- Understanding GDP
- About the quarterly national accounts
- The quality of the GDP estimate
- Things you need to know about this release
- Headline UK economic indicators
- Historical context
- GDP analysed by output categories, chained volume measures, tables B1 and B2
- GDP analysed by expenditure categories, chained volume measures, Table C2
- GDP implied deflator, Table A1
- GDP analysed by income categories at current prices, Table D
- Balancing GDP
- Gross Domestic Product (GDP) per head, Table P
- Sector accounts, Tables I, J1, J2, J3, K1 and K2
- The households and non-profit institutions serving households (NPISH) sector (Tables J1, J2 and J3)
- Real households and NPISH disposable income
- Private non-financial corporations sector (Tables K1 and K2)
- International comparisons for Quarter 3 (July to Sept) 2016
- Quarterly revisions
- Briefing on revisions to GDP
- Quality and methodology
- A brief explanation of non-monetary gold in national accounts
- Background notes
1. Main points
The reporting period for this release includes Quarter 3 (July to Sept) 2016, and therefore includes data for the whole period after the EU referendum. Since the result, growth in gross domestic product (GDP) has been in line with recent trends.
UK GDP in volume terms was estimated to have increased by 0.6% in Quarter 3 2016, revised up 0.1 percentage points from the second estimate of GDP published on 26 November 2016, due to upward revisions from the output of the business services and finance industries. This is the 15th consecutive quarter of positive growth since Quarter 1 (Jan to Mar) 2013.
Revisions to GDP quarterly volume growths are small compared with the previously published estimate. There are no revisions to any quarters in 2015. There are small revisions to the quarters of 2016; both Quarter 1 2016 and Quarter 2 (Apr to June) 2016 have been revised down by 0.1 percentage points, and Quarter 3 2016 has been revised up by 0.1 percentage points. Further details can be found in the “Briefing on revisions to GDP” section.
Between 2014 and 2015, GDP in volume terms increased by 2.2%, unrevised from the previous estimate. Between Quarter 3 2015 and Quarter 3 2016, GDP in volume terms increased by 2.2%, revised down 0.1 percentage points from the previously published estimate.
GDP per head in volume terms was estimated to have increased by 0.4% between Quarter 2 2016 and Quarter 3 2016. Between 2014 and 2015, GDP per head increased by 1.4%.
GDP in current prices increased by 0.8% between Quarter 2 2016 and Quarter 3 2016, unrevised from the previously published estimate.
The households and non-profit institutions serving households saving ratio was estimated to be 5.6% in Quarter 3 2016 compared with 6.1% in Quarter 2 2016. In 2015, the saving ratio was estimated to be 6.5%.
Real households disposable income decreased by 0.6% in Quarter 3 2016. In 2015, real households disposable income increased by 3.6%.
Back to table of contents2. Statistician’s quote
“Robust consumer demand continued to help the UK economy grow steadily in the third quarter of 2016. Growth was slightly stronger than first thought, though, due to greater output in the financial sector.”
Darren Morgan, Head of GDP
Back to table of contents3. Future changes
From January 2017, we are improving the way we publish economic statistics, with related data grouped together under new "theme" days. This will increase the coherence of our data releases and involve minor changes to the timing of certain publications. For more information see Changes to publication schedule for economic statistics.
Back to table of contents4. Understanding GDP
Gross domestic product (GDP) growth is the main indicator of economic performance. There are 3 approaches used to measure GDP.
Gross value added (GVA) is the sum of goods and services produced within the economy less the value of goods and services used up in the production process (intermediate consumption). The output approach measures GVA at a detailed industry level before aggregating to produce an estimate for the whole economy. GDP (as measured by the output approach) can then be calculated by adding taxes and subtracting subsidies (both only available at whole economy level) to this estimate of total GVA (more information on creating the preliminary estimate of GDP is available on our methods and sources page).
The income approach measures income generated by production in the form of gross operating surplus (profits), compensation of employees (income from employment) and mixed income (self-employment income) for the whole economy.
The expenditure approach is the sum of all final expenditures within the economy, that is, all expenditure on goods and services that are not used up or transformed in the production process, that is, final consumption (not intermediate) for the whole economy.
The third estimate of GDP is based on revised output data, together with updated data from expenditure and income components. In the quarterly national accounts, the output GVA and GDP estimates are balanced with the equivalent income and expenditure approaches to produce headline estimates of GVA and GDP. Further information on all 3 approaches to measuring GDP can be found in the short guide to national accounts.
All data in this bulletin are seasonally adjusted estimates and have had the effect of price changes removed (in other words, the data are deflated), with the exception of income data which are only available in current prices. For further information regarding non-seasonally adjusted data, please refer to the UK Economic Accounts (UKEA). It can be downloaded directly from the UKEA dataset and on the UKEA main aggregates dataset.
Growth for GDP and its components is given between different periods. Latest year-on-previous-year gives the annual growth between one calendar year and the previous. Latest quarter-on-previous-quarter growth gives growth between one quarter and the quarter immediately before it. Latest quarter-on-corresponding-quarter-of-previous-year shows the growth between one quarter and the same quarter a year ago.
In line with National Accounts Revisions Policy, the earliest period open for revision in this release is Quarter 1 (Jan to Mar) 2015.
Back to table of contents5. About the quarterly national accounts
The quarterly national accounts are typically published around 90 days after the end of the quarter. At this stage the data content of this estimate from the output measure of gross domestic product (GDP) has risen to around 91% of the total required for the final output-based estimate. There is also around 90% data content available to produce estimates of GDP from the expenditure approach and around 70% data content from the income approach.
Back to table of contents6. The quality of the GDP estimate
The national accounts are drawn together using data from many different sources. This ensures that the national accounts are comprehensive and provide different perspectives on the economy, for example sales by retailers and purchases by households. One source of information is from business surveys which use information provided directly from UK businesses. These data are subject to many layers of vigorous quality assurance by highly trained personnel, from clarity and confirmation of individual unit data direct from the business contact to scrutiny of data at the macro level. Other sources of data include other government departments and administrative data, including Value Added Tax (VAT) data from HM Revenue and Customs (HMRC) which are subject to quality checks and challenge from ONS. By comparing and contrasting these different sources, the national accounts produce a single picture of the economy which is consistent, coherent and fully integrated.
The production and publication of each gross domestic product (GDP) release is managed by a highly skilled team with a strong emphasis on statistical, analytical and economic debate throughout the production process to publish the headline GDP estimate and components. Although a limited audience have access to GDP data ahead of publication, those involved in the process are selected to ensure each GDP balance achieves a rigorous statistical and economic challenge. A “balancing meeting” is held during each production round where presentations assess GDP and its components against a swathe of external indicators and a focus on GDP headline components. This is attended by senior managers within ONS who challenge the data to ensure consistency and plausibility of the GDP balance. We recognise the importance of transparency and have recently introduced an additional section in our background notes where the balancing adjustments applied – size and the components targeted – are now published.
Accompanying each quarterly and annual production cycle, external quality assurers with particular areas of expertise are invited to challenge and report on the statistical and economic coherence of the headline national account and component dataset. Current assessors include HM Treasury, Bank of England, National Institute of Economic and Social Research, HM Revenue and Customs and Tax Administration Research Centre. Drawing on their personal experience, expertise and subject knowledge, the external quality assurors work in a personal capacity to challenge the synergy of the dataset from a full range of views – from producers, data compilers and from users of the statistics – before final sign-off.
Unlike many short-term indicators that we publish, there is no simple way of measuring the accuracy of GDP. All estimates, by definition, are subject to statistical uncertainty and for many well-established statistics we measure and publish the sampling error and non-sampling error associated with the estimate, using this as an indicator of accuracy. Since sampling is typically done to determine the characteristics of a whole population, the difference between the sample and population values is considered a sampling error. Non-sampling errors are a result of deviations from the true value that are not a function of the sample chosen, including various systematic errors and any other errors that are not due to sampling. The estimate of GDP, however, is currently constructed from a wide variety of data sources, some of which are not based on random samples or do not have published sampling and non-sampling errors available and as such it is very difficult to measure both error aspects and their impact on GDP. While development work continues in this area, like all other G7 national statistical institutes, we don't publish a measure of the sampling error or non-sampling error associated with GDP.
One dimension of measuring accuracy is reliability, which is measured using evidence from analyses of revisions to assess the closeness of early estimates to subsequently estimated values. Many users try to minimise the impact of uncertainty through using the historical experience of revisions as a basis for estimating how confident they are in early releases and predicting how far and in what direction the early release might be revised. Revisions are an inevitable consequence of the trade-off between timeliness and accuracy. The estimate is subject to revisions as more data become available, but between the preliminary and third estimates of GDP, revisions are typically small (around 0.1 to 0.2 percentage points), with the frequency of upward and downward revisions broadly equal. Many different approaches can be used to summarise revisions; the Validation and Quality Assurance section in the Quality and Methodology Information paper analyses the mean average revision and the mean absolute revision for GDP estimates over data publication iterations. In addition to this analysis, Section 14 of the revisions to GDP and components in Blue Books 2014 and 2015 article updates the metrics used to test revisions performance in order to answer the question “Is GDP biased?”
Back to table of contents
7. Things you need to know about this release
As published on 6 December 2016 we identified an error in the way we have processed estimates of trade in non-monetary gold and other precious metals, which affected the UK trade data between January 2015 and September 2016. This error was corrected in the UK Trade release on 9 December 2016, and caused some large revisions to the exports and imports of goods, and therefore the UK trade balance. These revisions also impact the current account balance in the Quarterly Balance of Payments from Quarter 1 (Jan to Mar) 2015 to Quarter 2 (Apr to June) 2016 published today (23 December 2016). There is no impact on total GDP, as the corrections to non-monetary gold and other precious metals in the trade in goods series, and the acquisitions less disposals of valuables offset each other. However, the composition of the expenditure estimate of GDP has changed from what was previously published in the Second Estimate of GDP Quarter 3 (July to Sept) 2016 on 25 November 2016.
Following a quality review, some improvements to the calculation of financial intermediation services indirectly measured (FISIM) chained volume measures (CVM) have been made. These relate to exports of FISIM only, and have been incorporated into the quarterly national accounts for data from Quarter 1 2015. More work will be undertaken, and incorporated in the Blue Book 2017 consistent releases (published on 29 September 2017) for data prior to this period.
We informed users on 25 November 2016 that, following a quality review, a processing error had been identified in the compilation of the estimates for the rail transport industry (49.1-2), which affects the period Quarter 1 1997 to Quarter 2 2016. In line with the National Accounts revision policy, this error has been corrected in the Index of Services and Quarterly National Accounts published on 23 December 2016 for data from Quarter 1 2015. Data prior to 2015 will be corrected when next open for revision with Blue Book 2017 consistent releases due for publication on 29 September 2017.
Back to table of contents8. Headline UK economic indicators
Table 1: Headline economic indicators for the UK, Quarter 3 (July to Sept) 2014 to Quarter 3 2016
| Household saving ratio | Real household disposable income | GDP at current market prices | GDP at chained volume measure | GDP per head | |
| % | %1 | %1 | %1 | %1 | |
| Seasonally adjusted | |||||
| Q3 2014 | 6.1 | -0.3 | 1.1 | 0.8 | 0.6 |
| Q4 2014 | 7.0 | 1.8 | 0.4 | 0.8 | 0.6 |
| Q1 2015 | 6.1 | -0.1 | 0.3 | 0.3 | 0.0 |
| Q2 2015 | 6.6 | 1.5 | 1.5 | 0.5 | 0.3 |
| Q3 2015 | 6.6 | 1.8 | -0.1 | 0.3 | 0.1 |
| Q4 2015 | 6.5 | 0.0 | 0.4 | 0.7 | 0.5 |
| Q1 2016 | 6.1 | 0.1 | 1.5 | 0.3 | 0.2 |
| Q2 2016 | 6.1 | 0.8 | 1.2 | 0.6 | 0.5 |
| Q3 2016 | 5.6 | -0.6 | 0.8 | 0.6 | 0.4 |
| Source: Office for National Statistics | |||||
| Notes: | |||||
| 1. Percentage change on previous quarter. | |||||
| 2. Q1 refers to Quarter 1 (Jan to Mar), Q2 refers to Quarter 2 (Apr to June), Q3 refers to Quarter 3 (July to Sept) and Q4 refers to Quarter 4 (Oct to Dec). | |||||
Download this table Table 1: Headline economic indicators for the UK, Quarter 3 (July to Sept) 2014 to Quarter 3 2016
.xls (29.2 kB)9. Historical context
Figure 1 shows quarterly growths and levels for the chained volume measure of gross domestic product (GDP) between Quarter 3 (July to Sept) 2003 and Quarter 3 2016.
Figure 1: Quarterly growth and levels of GDP for the UK, Table A2
Quarter 4 (Oct to Dec) 2003 to Quarter 3 (July to Sept) 2016
Source: Office for National Statistics
Notes:
- Q1 refers to Quarter 1 (Jan to Mar), Q2 refers to Quarter 2 (Apr to June), Q3 refers to Quarter 3 (July to Sept) and Q4 refers to Quarter 4 (Oct to Dec).
Download this chart Figure 1: Quarterly growth and levels of GDP for the UK, Table A2
Image .csv .xlsAs seen in Figure 1, GDP in the UK grew steadily during the 2000s until a financial market shock affected UK and global economic growth in 2008 and 2009. Economic growth resumed towards the end of 2009; the first 2 to 3 years was at a generally slower rate than the period prior to 2008. From the peak in Quarter 1 (Jan to Mar) 2008 to the trough in Quarter 2 (Apr to June) 2009, GDP decreased by 6.3%. This can be compared with previous economic downturns in the early 1980s and early 1990s, which saw lower levels of impact on GDP. In the early 1990s downturn, GDP decreased by 2.0% from the peak in Quarter 2 1990 to the trough in Quarter 3 1991. In the early 1980s downturn, GDP decreased by 5.4% from the peak in Quarter 2 1979 to the trough in Quarter 1 1981.
From Quarter 3 2009, growth continued to be erratic, with several quarters between 2010 and 2012 recording broadly flat or declining GDP. This 2-year period coincided with special events (for example severe winter weather in Quarter 4 (Oct to Dec) 2010 and the Diamond Jubilee in Quarter 2 2012) that are likely to have affected growth both adversely and positively. Since 2013, GDP has grown steadily, with the economy exceeding pre-downturn peak levels in Quarter 3 2013.
Quarter 3 2016 has shown continued strength with GDP growing by 0.6% compared with the previous quarter and by 2.2% between Quarter 3 2015 and Quarter 3 2016. GDP has now increased for 15 consecutive quarters, breaking a pattern of slow and erratic growth from 2009.
Back to table of contents10. GDP analysed by output categories, chained volume measures, tables B1 and B2
Looking at the main output industrial groupings within gross domestic product (GDP), we find that 3 out of 4 decreased in Quarter 3 (July to Sept) 2016 compared with Quarter 2 (Apr to June) 2016; only services showed an increase while production, construction and agriculture all showed decreases.
Production output decreased by 0.4% in Quarter 3 2016 compared with Quarter 2 2016, revised up 0.1 percentage points from the previously published estimate. Within the production sub-industries, output from mining and quarrying (including oil and gas extraction) increased by 4.3%, manufacturing (the largest component of production) decreased by 0.8% (Figure 2), electricity, gas, steam and air conditioning supply industries decreased by 4.2%, and water supply and sewerage decreased by 0.1%.
When comparing Quarter 3 2016 with Quarter 3 2015, production output increased by 1.1%, revised up 0.1 percentage points from the previously published estimate. Mining and quarrying (including oil and gas extraction) increased by 3.6%, manufacturing rose by 0.5% between these periods, the electricity, gas, steam and air conditioning supply industries decreased by 1.1% and water supply and sewerage increased by 5.2%.
Figure 2: UK manufacturing growth, quarter-on-quarter
Quarter 3 (July to Sept) 2012 to Quarter 3 2016
Source: Office for National Statistics
Notes:
- Q1 refers to Quarter 1 (Jan to Mar), Q2 refers to Quarter 2 (Apr to June), Q3 refers to Quarter 3 (July to Sept) and Q4 refers to Quarter 4 (Oct to Dec).
Download this chart Figure 2: UK manufacturing growth, quarter-on-quarter
Image .csv .xlsConstruction output decreased by 0.8% in Quarter 3 2016 compared with Quarter 2 2016, revised up 0.3 percentage points from the previously published estimate. Revisions were due to the incorporation of late data and re-seasonally adjusting data in the open period. Construction output increased by 1.7% between Quarter 3 2015 and Quarter 3 2016, revised up 1.6 percentage points from the previously published estimate.
The services industries increased by 1.0% in Quarter 3 2016 (Figure 3) compared with Quarter 2 2016, revised up 0.2 percentage points from the previous estimate, marking the 15th consecutive quarter of positive growth. This follows a 0.6% increase in Quarter 2 2016.
Figure 3: UK services growth, quarter-on-quarter
Quarter 3 (July to Sept) 2012 to Quarter 3 2016
Source: Office for National Statistics
Notes:
- Q1 refers to Quarter 1 (Jan to Mar), Q2 refers to Quarter 2 (Apr to June), Q3 refers to Quarter 3 (July to Sept) and Q4 refers to Quarter 4 (Oct to Dec).
Download this chart Figure 3: UK services growth, quarter-on-quarter
Image .csv .xlsOutput of the distribution, hotels and catering industries increased by 1.1% in Quarter 3 2016, this follows an increase of 0.9% in Quarter 2 2016.
Output of the transport, storage and communications industries increased by 2.6% in Quarter 3 2016, this follows an increase of 0.4% in Quarter 2 2016.
Business services and finance industries increased by 0.8% in Quarter 3 2016, this follows an increase of 0.8% in Quarter 2 2016.
Output of the government and other services industries increased by 0.4% in Quarter 3 2016, this follows an increase of 0.1% in Quarter 2 2016.
Further detail on the services industries’ lower level components can be found in the Index of Services statistical bulletin published on 23 December 2016.
Gross value added (GVA) excluding oil and gas extraction increased by 0.6% in Quarter 3 2016, following a 0.7% increase in Quarter 2 2016.
Figure 4 shows the path of GDP and its headline industries (this excludes agriculture, and includes manufacturing which is a sub-component of production) relative to their level of output achieved in Quarter 1 (Jan to Mar) 2008.
Figure 4: UK GDP output components growth, quarter-on-quarter, indexed from Q1 2008 = 100
Quarter 1 (Jan to Mar) 2008 to Quarter 3 (July to Sept) 2016
Source: Office for National Statistics
Notes:
- Q1 refers to Quarter 1 (Jan to Mar), Q2 refers to Quarter 2 (Apr to June), Q3 refers to Quarter 3 (July to Sept) and Q4 refers to Quarter 4 (Oct to Dec).
Download this chart Figure 4: UK GDP output components growth, quarter-on-quarter, indexed from Q1 2008 = 100
Image .csv .xlsIndustries have shown differing trends following the recent economic downturn. The construction, manufacturing and production industries were more acutely affected by the deterioration in economic conditions, with output falling from peak to trough by 17.1%, 12.2% and 10.5% respectively. In contrast, output in the services industry only fell by 4.6%.
Activity began to grow again in 2010, with the manufacturing and the construction industries showing particular strength – but neither industry sustained this growth. Production output fell in both 2011 and 2012, falling below levels seen at the height of the downturn in 2009. Construction output also fell sharply in 2012, with output falling close to its 2009 trough after further contraction in Quarter 1 2013. Since that period construction output has improved and surpassed its pre-downturn peak in Quarter 1 2016. Despite a contraction in the third quarter of 2016 of 0.8%, construction output remains above pre-downturn levels, while the services industries remain the largest and steadiest contributors to overall economic growth.
Figure 5 shows the average compound quarterly growth rate experienced over the 5 years prior to the economic downturn in 2008 to 2009, the average growth rate experienced between Quarter 3 2009 and Quarter 2 2014 (5 years following the downturn), and the current quarterly growth rate observed in the most recent period (Quarter 3 2016). Compound average growth is the rate at which a series would have increased or decreased if it had grown or fallen at a steady rate over a number of periods. This allows the composition of growth in the recent economic recovery to be compared with the long run average.
The UK experienced slightly slower average compound GDP growth in the 5 years following the economic downturn compared with the 5 years prior: this is also true of the services industry. Figure 5 shows that in Quarter 3 2016 total GDP and services outperformed their post-downturn average, but the other components of GDP were more subdued.
It should be noted that the third column, which shows the current quarterly growth rate, is based on only one data point. Consequently, users should use caution when making direct comparisons with the long run averages.
Figure 5: UK GDP quarterly average compound growth by industry
Quarter 1 (Jan to Mar) 2003 to Quarter 4 (Oct to Dec) 2007, Quarter 3 (July to Sept) 2009 to Quarter 2 (Apr to June) 2014, Quarter 3 2016
Source: Office for National Statistics
Notes:
- Q1 refers to Quarter 1 (Jan to Mar), Q2 refers to Quarter 2 (Apr to June), Q3 refers to Quarter 3 (July to Sept) and Q4 refers to Quarter 4 (Oct to Dec).
Download this chart Figure 5: UK GDP quarterly average compound growth by industry
Image .csv .xlsTable AA contains output component growth rates and contributions to growth rates back to Quarter 1 2014.
Back to table of contents11. GDP analysed by expenditure categories, chained volume measures, Table C2
Total national expenditure (the sum of all expenditure by UK residents on goods and services that are not used up or transformed in a productive process) increased by 1.8% in Quarter 3 (July to Sept) 2016. Annually, between 2014 and 2015 total national expenditure increased by 1.9%.
Household final consumption expenditure (HHFCE) increased by 0.7% in Quarter 3 2016, and has increased for 7 consecutive quarters (Figure 6). When compared with the same quarter a year ago, HHFCE has been rising each quarter since Quarter 4 (Oct to Dec) 2011, and was 2.6% higher in Quarter 3 2016 than in the same period a year ago. Between 2014 and 2015, HHFCE increased by 2.5%.
Figure 6: UK household final consumption expenditure growth, quarter-on-quarter
Quarter 3 (July to Sept) 2012 to Quarter 3 2016
Source: Office for National Statistics
Notes:
- Q1 refers to Quarter 1 (Jan to Mar), Q2 refers to Quarter 2 (Apr to June), Q3 refers to Quarter 3 (July to Sept) and Q4 refers to Quarter 4 (Oct to Dec).
Download this chart Figure 6: UK household final consumption expenditure growth, quarter-on-quarter
Image .csv .xlsFigure 7 shows the contribution of different categories of goods and services to quarter on same quarter of previous year growth in UK HHFCE. Growth has remained positive since Quarter 4 2011 and is shown to have been broad-based across both goods and services. While durable and semi-durable goods were the predominant driver of growth in recent periods, in the latest quarter services was the main driver, contributing 1.4 percentage points to HHFCE. Non-durable goods – which made only a small positive contribution this quarter – include items which can only be consumed or used once, such as food products.
Figure 7: Contribution to UK household expenditure growth, quarter-on-same-quarter previous year
Quarter 1 (Jan to Mar) 2008 to Quarter 3 (July to Sept) 2016
Source: Office for National Statistics
Notes:
- Q1 refers to Quarter 1 (Jan to Mar), Q2 refers to Quarter 2 (Apr to June), Q3 refers to Quarter 3 (July to Sept) and Q4 refers to Quarter 4 (Oct to Dec).
Download this chart Figure 7: Contribution to UK household expenditure growth, quarter-on-same-quarter previous year
Image .csv .xlsGovernment final consumption expenditure was flat in Quarter 3 2016, following a 0.1% decrease in Quarter 2 (Apr to June) 2016. Between Quarter 3 2015 and Quarter 3 2016, government final consumption expenditure increased by 0.2%. Between 2014 and 2015, government final consumption expenditure increased by 1.3%.
Non-profit institutions serving households’ (NPISH) final consumption expenditure decreased by 0.4% in Quarter 3 2016, following a 1.7% increase in Quarter 2 2016. Between Quarter 3 2015 and Quarter 3 2016, NPISH final consumption expenditure increased by 3.8%. Annually, NPISH final consumption expenditure increased by 0.8% between 2014 and 2015.
In Quarter 3 2016, gross fixed capital formation (GFCF) was estimated to have increased by 0.9% (Figure 8). Between Quarter 3 2015 and Quarter 3 2016, GFCF increased by 0.5%. GFCF increased by 3.4% between 2014 and 2015. More detail on GFCF, including a breakdown of the GFCF components, can be found in the Business investment statistical bulletin published on 23 December 2016.
Business investment was estimated to have increased by 0.4% in Quarter 3 2016 compared with Quarter 2 2016 and decreased by 2.2% between Quarter 3 2015 and Quarter 3 2016. Annually, business investment increased by 5.1% between 2014 and 2015.
Figure 8: UK gross fixed capital formation growth, quarter-on-quarter
Quarter 3 (July to Sept) 2012 to Quarter 3 2016
Source: Office for National Statistics
Notes:
- Q1 refers to Quarter 1 (Jan to Mar), Q2 refers to Quarter 2 (Apr to June), Q3 refers to Quarter 3 (July to Sept) and Q4 refers to Quarter 4 (Oct to Dec).
Download this chart Figure 8: UK gross fixed capital formation growth, quarter-on-quarter
Image .csv .xlsIncluding the alignment adjustment, the level of inventories increased by £1.6 billion in Quarter 3 2016, following an increase of £0.9 billion in Quarter 2 2016. Excluding the alignment adjustment, the level of inventories decreased by £0.3 billion in Quarter 3 2016, following an increase of £2.1 billion in Quarter 2 2016. More information on the alignment adjustment can be found in the Balancing GDP section of this release.
The trade balance deficit widened from £11.0 billion in Quarter 2 2016 to £16.7 billion in Quarter 3 2016 (Figure 9). The trade position reflects exports minus imports. Following a 1.4% increase in Quarter 2 2016, exports decreased by 2.6% in the latest quarter, while imports increased by 1.4% in Quarter 3 2016 following a 0.4% increase in Quarter 2 2016. Further details can be found in section 5 of the UK Trade: Oct 2016 bulletin.
Exports of goods decreased by 5.1% in Quarter 3 2016, due mainly to a decrease in exports of aircraft, chemicals and unspecified goods. Exports of services increased by 1.0% in Quarter 3 2016, due to increases in insurance, and other business services; this was partially offset by a decrease in financial services. In Quarter 3 2016, imports of goods increased by 3.4%, due to an increase in unspecified goods. Imports of services decreased by 5.3% in Quarter 3 2016, due to a decrease in other business services. Between 2014 and 2015, exports increased by 6.1%, while imports increased by 5.5%.
Figure 9: UK trade balance
Quarter 3 (July to Sept) 2012 to Quarter 3 2016
Source: Office for National Statistics
Notes:
- Q1 refers to Quarter 1 (Jan to Mar), Q2 refers to Quarter 2 (Apr to June), Q3 refers to Quarter 3 (July to Sept) and Q4 refers to Quarter 4 (Oct to Dec).
Download this chart Figure 9: UK trade balance
Image .csv .xlsFigure 10 shows a breakdown of the trade components and their contribution to GDP growth from Quarter 1 (Jan to Mar) 2008 to Quarter 3 2016. The series indicates that in the latest quarter, the UK trade balance has made a negative contribution to GDP growth. When comparing Quarter 3 2015 with Quarter 3 2016, exports of goods decreased by 3.9%, reducing GDP growth by 0.7 percentage points. This was partially offset by 10.1% growth in exports of services, which contributed 1.2 percentage points to GDP growth.
Figure 10: UK net trade components contribution to GDP, quarter-on-same-quarter previous year
Quarter 1 (Jan to Mar) 2008 to Quarter 3 (July to Sept) 2016
Source: Office for National Statistics
Notes:
- Q1 refers to Quarter 1 (Jan to Mar), Q2 refers to Quarter 2 (Apr to June), Q3 refers to Quarter 3 (July to Sept) and Q4 refers to Quarter 4 (Oct to Dec).
Download this chart Figure 10: UK net trade components contribution to GDP, quarter-on-same-quarter previous year
Image .csv .xlsTable AB contains expenditure component growth rates and contribution to growth rates back to Quarter 1 2014.
Figure 11 shows the quarterly contribution of the expenditure components to the growth of GDP in chained volume measures. For Quarter 3 2016, the largest positive contributions to GDP came from gross capital formation, which contributed 1.3 percentage points and household final consumption expenditure contributed 0.5 percentage points, whilst net trade contributed a negative 1.2 percentage points. A further explanation can be found in the Things You Need To Know section of this bulletin.
Figure 11: Expenditure components percentage contribution to UK GDP growth, quarter-on-quarter
Quarter 4 (Oct to Dec) 2014 to Quarter 3 (July to Sept) 2016
Source: Office for National Statistics
Notes:
- Q1 refers to Quarter 1 (Jan to Mar), Q2 refers to Quarter 2 (Apr to June), Q3 refers to Quarter 3 (July to Sept) and Q4 refers to Quarter 4 (Oct to Dec).
Download this chart Figure 11: Expenditure components percentage contribution to UK GDP growth, quarter-on-quarter
Image .csv .xls12. GDP implied deflator, Table A1
The gross domestic product (GDP) implied deflator at market prices for Quarter 3 (July to Sept) 2016 is 1.7% above the same quarter of 2015 (Figure 12). The GDP implied deflator is calculated by dividing current price (nominal) GDP by chained volume (real) GDP and multiplying by 100 to convert to an index. It is not used in the calculation of GDP; the deflators for expenditure components, which are the basis for the implied GDP deflator, are used to calculate nominal GDP, not real GDP.
Table AD contains implied deflator component growth rates back to Quarter 1 (Jan to Mar) 2014.
Figure 12: UK GDP at market prices implied deflator, quarter-on-same-quarter of previous year
Quarter 3 (July to Sept) 2012 to Quarter 3 2016
Source: Office for National Statistics
Notes:
- Q1 refers to Quarter 1 (Jan to Mar), Q2 refers to Quarter 2 (Apr to June), Q3 refers to Quarter 3 (July to Sept) and Q4 refers to Quarter 4 (Oct to Dec).
Download this chart Figure 12: UK GDP at market prices implied deflator, quarter-on-same-quarter of previous year
Image .csv .xls13. GDP analysed by income categories at current prices, Table D
Gross domestic product (GDP) at current market prices increased by 0.8% in Quarter 3 (July to Sept) 2016, following a 1.2% increase in Quarter 2 (Apr to June) 2016. GDP at current market prices increased by 4.0% when compared with Quarter 3 2015. In 2015, GDP at current market prices increased by 2.8%.
Compensation of employees – which includes both wages and salaries, and employers’ social contributions, increased by 1.3% in Quarter 3 2016, following an increase of 2.1% in Quarter 2 2016 (Figure 13). Between Quarter 3 2015 and Quarter 3 2016, compensation of employees increased by 4.5%. In 2015, compensation of employees increased by 3.2%.
Figure 13: UK compensation of employees growth, quarter-on-quarter
Quarter 3 (July to Sept) 2012 to Quarter 3 2016
Source: Office for National Statistics
Notes:
- Q1 refers to Quarter 1 (Jan to Mar), Q2 refers to Quarter 2 (Apr to June), Q3 refers to Quarter 3 (July to Sept) and Q4 refers to Quarter 4 (Oct to Dec).
Download this chart Figure 13: UK compensation of employees growth, quarter-on-quarter
Image .csv .xlsThe gross operating surplus (GOS) of corporations (effectively the profits of companies operating within the UK), including the alignment adjustment, decreased by 0.2% in Quarter 3 2016 compared with the previous quarter, while Quarter 2 2016 decreased by 0.7% (Figure 14). Between 2014 and 2015, the GOS of corporations increased by 1.2%. More information on the alignment adjustment can be found in the Balancing GDP section within this release.
Figure 14: UK gross operating surplus of corporations' growth, quarter-on-quarter
Quarter 3 (July to Sept) 2012 to Quarter 3 2016
Source: Office for National Statisitcs
Notes:
- Q1 refers to Quarter 1 (Jan to Mar), Q2 refers to Quarter 2 (Apr to June), Q3 refers to Quarter 3 (July to Sept) and Q4 refers to Quarter 4 (Oct to Dec).
Download this chart Figure 14: UK gross operating surplus of corporations' growth, quarter-on-quarter
Image .csv .xlsTaxes on products and production less subsidies increased by 0.3% in Quarter 3 2016, following an increase of 1.0% in Quarter 2 2016. Between 2014 and 2015, taxes on products and production less subsidies increased by 3.0%.
Table AC contains income component growth rates and contribution to growth rates back to Quarter 1 (Jan to Mar) 2014.
Figure 15 shows the contribution made by income components to current price GDP. In Quarter 3 2016, compensation of employees contributed a positive 0.7 percentage points, and other income contributed a positive 0.2 percentage points. Taxes on products and production less subsidies and gross operating surplus of corporations both showed flat contributions to GDP.
Figure 15: Income components percentage contribution to UK GDP growth, quarter-on-quarter
Quarter 4 (Oct to Dec) 2014 to Quarter 3 (July to Sept) 2016
Source: Office for National Statistics
Notes:
- Q1 refers to Quarter 1 (Jan to Mar), Q2 refers to Quarter 2 (Apr to June), Q3 refers to Quarter 3 (July to Sept) and Q4 refers to Quarter 4 (Oct to Dec).
Download this chart Figure 15: Income components percentage contribution to UK GDP growth, quarter-on-quarter
Image .csv .xls14. Balancing GDP
Information on the methods we use for balancing the output, income and expenditure approaches to measuring GDP can be found on our website.
The different data content of the 3 approaches dictates the approach taken in balancing quarterly data. In the UK, there are far more data available on output than in the other 2 approaches. However, in order to obtain the best estimate of GDP (the published figure), the estimates from all 3 approaches are reconciled to produce an average. Annually, the estimates from all 3 approaches are reconciled through the creation of input-output supply and use tables for the years for which data are available.
For years in which there is no supply and use balance, a statistical discrepancy exists that reflects the differences between the published headline estimate of GDP and the expenditure and income estimates.
For all periods, the expenditure and income estimates are aligned to the published headline GDP figure. Although annual data is aligned for balanced years, there will still be quarterly differences for balanced and post-balanced years, due to timing and data content issues. These are dealt with by means of explicit alignment adjustments that are applied to specific components (gross operating surplus of private non-financial corporations in the income approach and changes in inventories in expenditure) to align the 3 approaches. As these are purely quarterly discrepancies, the alignments sum to zero over the year and are published explicitly in the GDP statistical bulletins. They are also published as “of which” items within the specific components, to enable users to ascertain the underlying picture.
Alignment adjustments, found in Table M of this release, have a target limit of plus or minus £2,000 million on any quarter. However, in periods where the data sources are particularly difficult to balance, slightly larger alignment adjustments are sometimes needed. To achieve this balance through alignment, balancing adjustments are applied to the expenditure and income components of GDP as required. They are applied to those individual components where data content is particularly weak in a given quarter due to a high level of forecast content, for example.
The size and direction of the quarterly alignment adjustments in Quarter 3 (July to Sept) 2016 indicate that in this quarter, the levels of both expenditure and income were lower than that of output.
Table 2 shows the balancing adjustments applied to the GDP estimates in this publication.
Table 2: Balancing adjustments applied to the quarterly national accounts GDP dataset for Quarter 3 (July to Sept) 2016
| GDP measurement approach and component adjustment applied to | Quarter 1 (Jan to Mar) 2015 | Quarter 2 (Apr to June) 2015 | Quarter 3 (July to Sept) 2015 | Quarter 4 (Oct to Dec) 2015 | Quarter 1 (Jan to Mar) 2016 | Quarter 2 (Apr to June) 2016 | Quarter 3 (July to Sept) 2016 | |
| Expenditure | ||||||||
| HHFCE | ||||||||
| current prices | +£525m | +£200m | +£200m | |||||
| Valuables | ||||||||
| current prices | +£200m | +£600m | ||||||
| chained volume measures | +£200m | +£600m | ||||||
| Change in inventories | ||||||||
| current prices | +£400m | +£400m | +£100m | +£300m | +£300m | |||
| chained volume measures | +£400m | +£400m | +£100m | +£300m | +£300m | |||
| Trade in Services (exports) | ||||||||
| current prices | +£250m | +£250m | +£1000m | +£250m | ||||
| chained volume measures | +£250m | +£250m | +£1000m | +£250m | ||||
| Trade in Services (imports) | ||||||||
| current prices | -£800m | |||||||
| chained volume measures | -£800m | |||||||
| Income | ||||||||
| Gross operating surplus | ||||||||
| current prices | +£1340m | |||||||
| Mixed Income | ||||||||
| current prices | +£390m | |||||||
| Source: Office for National Statistics | ||||||||
Download this table Table 2: Balancing adjustments applied to the quarterly national accounts GDP dataset for Quarter 3 (July to Sept) 2016
.xls (29.7 kB)15. Gross Domestic Product (GDP) per head, Table P
In Quarter 3 (July to Sept) 2016, GDP per head (chained volume measure) increased by 0.4%, compared with Quarter 2 (Apr to June) 2016; this was revised from 0.3% published at the Second Estimate. GDP per head is now 1.5% above the pre-downturn peak in Quarter 1 (Jan to Mar) 2008, having surpassed it in Quarter 3 2015.
In comparison, GDP exceeded the level of its pre-downturn peak in Quarter 3 2013 (unrevised), and is now 8.1% above its pre-downturn peak (Figure 16).
Figure 16: Quarterly growth of GDP and GDP per head for the UK, indexed from Quarter 1 (Jan to Mar) 2008 = 100
Quarter 3 (July to Sept) 2006 to Quarter 3 2016
Source: Office for National Statistics
Notes:
- Q1 refers to Quarter 1 (Jan to Mar), Q2 refers to Quarter 2 (Apr to June), Q3 refers to Quarter 3 (July to Sept) and Q4 refers to Quarter 4 (Oct to Dec).
Download this chart Figure 16: Quarterly growth of GDP and GDP per head for the UK, indexed from Quarter 1 (Jan to Mar) 2008 = 100
Image .csv .xlsBetween Quarter 3 2015 and Quarter 3 2016, GDP per head increased by 1.5% unrevised from the Second Estimate of GDP. Between 2014 and 2015, GDP per head also increased by an unrevised 1.4%, compared with a growth of 2.3% between 2013 and 2014.
GDP per head is calculated by dividing GDP in chained volume measures by the latest population estimates and projections. The population estimates used in this release are those published on 23 June 2016, and the population projections used are those published on 29 October 2015.
Back to table of contents16. Sector accounts, Tables I, J1, J2, J3, K1 and K2
Summary
In Quarter 3 (July to Sept) 2016, the central government, local government, financial corporations and households and non-profit institutions serving households sectors were net borrowers. The public corporations, private non-financial corporations and rest of the world sectors were net lenders (Figure 17).
Figure 17: UK net lending(positive)/net borrowing (negative) by sector
Quarter 3 (July to Sept) 2016
Source: Office for National Statistics
Notes:
- Q1 refers to Quarter 1 (Jan to Mar), Q2 refers to Quarter 2 (Apr to June), Q3 refers to (July to Sept) and Q4 refers to Quarter 4 (Oct to Dec).
Download this chart Figure 17: UK net lending(positive)/net borrowing (negative) by sector
Image .csv .xlsCompared with the previous quarter, public corporations switched from net borrowers to net lenders. All other sectors remain unchanged.
Table I has further detail.
Back to table of contents17. The households and non-profit institutions serving households (NPISH) sector (Tables J1, J2 and J3)
Saving ratio:
The saving ratio for Quarter 3 (July to Sept) 2016 was 5.6%, compared with 6.1% in the previous quarter (Figure 18).
Figure 18: UK household and NPISH saving ratio
Quarter 1 (Jan to Mar) 2012 to Quarter 3 (July to Sept) 2016
Source: Office for National Statistics
Notes:
- Q1 refers to Quarter 1 (Jan to Mar), Q2 refers to Quarter 2 (Apr to June), Q3 refers to Quarter 3 (July to Sept) and Q4 refers to Quarter 4 (Oct to Dec).
Download this chart Figure 18: UK household and NPISH saving ratio
Image .csv .xlsThe fall in the saving ratio primarily reflects rises in final consumption expenditure and taxes on income and wealth, partially offset by rises in employers’ social contributions, wages and salaries and gross operating surplus and mixed income.
Figure 19: UK main household and NPISH saving ratio components
Quarter 4 (Oct to Dec) 2012 to Quarter 3 (July to Sept) 2016
Source: Office for National Statistics
Notes:
- Q1 refers to Quarter 1 (Jan to Mar), Q2 refers to Quarter 2 (Apr to June), Q3 refers to Quarter 3 (July to Sept) and Q4 refers to Quarter 4 (Oct to Dec).
Download this chart Figure 19: UK main household and NPISH saving ratio components
Image .csv .xlsWhat is the saving ratio?
The saving ratio estimates the amount of money households and non-profit institutions serving households (NPISH) have available to save (known as gross saving) as a percentage of their total disposable income (known as total available resources). Both can be found in Table J3 of this release.
Gross saving estimates the difference between households and NPISH total available resources (mainly wages received, revenue of the self-employed, social benefits and net income such as interest on savings and dividends from shares, but excluding taxes on income and wealth) and their current consumption (expenditure on goods and services).
All of the components that make up gross saving and total available resources, and in fact all sector accounts data apart from real households disposable income (RHDI), are estimated in current prices (CP). These are sometimes known as nominal prices, meaning that they include the effects of price changes.
The saving ratio is published in both non-seasonally adjusted (NSA) and seasonally adjusted (SA) formats with the latter removing seasonal effects to allow comparisons over time. However, the saving ratio can be volatile and is sensitive to even relatively small movements to its components, particularly on a quarterly basis. This is because gross saving is a small difference between 2 numbers. It is therefore often revised at successive publications when new or updated data are included.
Back to table of contents18. Real households and NPISH disposable income
The level of real households and NPISH disposable income decreased by 0.6% in Quarter 3 (July to Sept) 2016, following an increase of 0.8% in the previous quarter (Figure 20).
Figure 20: UK real household and NPISH disposable income, quarter-on-quarter
Quarter 4 (Oct to Dec) 2012 to Quarter 3 (July to Sept) 2016
Source: Office for National Statistics
Notes:
- Q1 refers to Quarter 1 (Jan to Mar), Q2 refers to Quarter 2 (Apr to June), Q3 refers to Quarter 3 (July to Sept) and Q4 refers to Quarter 4 (Oct to Dec).
Download this chart Figure 20: UK real household and NPISH disposable income, quarter-on-quarter
Image .csv .xlsThis fall in the latest quarter primarily reflects a rise in taxes on income and wealth and a fall in net social benefits other than transfers in kind, partially offset by rises in wages and salaries and gross operating surplus and mixed income.
Figure 21 shows the main components contributing to the quarterly movement of households and NPISH gross disposable income.
Figure 21: Impact of main components on households and NPISH gross disposable income
Quarter 4 (Oct to Dec) 2012 to Quarter 3 (July to Sept) 2016
Source: Office for National Statistics
Notes:
- Q1 refers to Quarter 1 (Jan to Mar), Q2 refers to Quarter 2 (Apr to June), Q3 refers to Quarter 3 (July to Sept) and Q4 refers to Quarter 4 (Oct to Dec).
Download this chart Figure 21: Impact of main components on households and NPISH gross disposable income
Image .csv .xlsWhat is real households and NPISH disposable income?
There are 2 measures of households and NPISH income, in real terms or in current prices (or nominal as it is often called), and both of these time series can be found in Table J2 of this release.
Gross households and NPISH disposable income (GDI) is the estimate of the total amount of money from income that households and NPISH have available from wages received, revenue of the self-employed, social benefits and net income (such as interest on savings and dividends from shares) less taxes on income and wealth. All the components that make up GDI are estimated in current prices.
However, by adjusting GDI to remove the effects of inflation, we are able to estimate another useful measure of disposable income called real disposable income. This is a measure of real purchasing power of households and NPISH incomes, in terms of the physical quantity of goods and services they would be able to purchase. We use the households and NPISH expenditure deflator (which can be found in Table J2 of this release) to remove the effects of price inflation.
Back to table of contents19. Private non-financial corporations sector (Tables K1 and K2)
Net lending of private non-financial corporations was £11.0 billion in Quarter 3 (July to Sept) 2016, following net lending of £11.4 billion in the previous quarter. This decrease in net lending in the latest quarter was due to a rise in gross capital formation and a fall in gross operating surplus, partially offset by a rise in net property income and other small changes.
For a more detailed coverage of the sector accounts, a new bulletin called Quarterly Sector Accounts is now being released alongside this bulletin covering all institutional sectors.
From March 2017, the sector accounts content contained within this bulletin will move to its new home within the Quarterly Sector Accounts bulletin.
Back to table of contents20. International comparisons for Quarter 3 (July to Sept) 2016
The estimates quoted in this international comparison section are the latest available estimates published by the respective bodies (referenced) at the time of preparation of this statistical bulletin and may subsequently have been revised.
The combined GDP for the Group of Seven (G7) countries increased by 0.6% when comparing Quarter 3 (July to Sept) 2016 with Quarter 2 (Apr to June) 2016, following growth of 0.3% in the previous quarter. There was positive growth in all G7 countries, France and Germany experienced growth of 0.2%. Whilst Italy and Japan experienced growth of 0.3%, the USA and Canada saw growth of 0.8% and 0.9% respectively (Table 3). The European Union (EU28) grew by 0.4% (Figure 22), marking 14 consecutive quarters of positive growth, and in the same period, the group of Euro Area countries (EA19) grew by 0.3%.
G7 GDP is now 8.1% above the pre-economic downturn peak in Quarter 1 (Jan to Mar) 2008 (Figure 23). Italy is the only G7 country with its GDP still below Quarter 1 2008, at 7.7% below its pre-downturn peak, and Canada has the strongest recovery in the G7, at 13.6% above the downturn peak.
Information on the estimates for the USA can be found on the Bureau of Economic Analysis website; information on the estimates for Japan can be found on the Japanese Cabinet Office website. More detailed information for the G7 and the EU countries can be found on the Organisation for Economic Co-operation and Development’s website and Eurostat website, respectively.
Table 3: International GDP growth rate comparisons, chained volume, seasonally adjusted
| Quarter on previous quarter % growth rates | ||||||||||
| EU281 | EA192 | G73 | France | Germany | Italy | UK | Canada | Japan | USA | |
| Q1 2014 | 0.4 | 0.3 | 0.2 | -0.1 | 0.6 | 0.0 | 0.8 | 0.1 | 1.2 | -0.3 |
| Q2 2014 | 0.3 | 0.2 | 0.3 | 0.2 | -0.1 | 0.1 | 0.9 | 1.0 | -1.8 | 1.0 |
| Q3 2014 | 0.5 | 0.4 | 0.7 | 0.4 | 0.3 | 0.0 | 0.8 | 0.5 | -0.2 | 1.2 |
| Q4 2014 | 0.5 | 0.4 | 0.5 | 0.2 | 0.8 | 0.0 | 0.8 | 0.6 | 0.5 | 0.6 |
| Q1 2015 | 0.7 | 0.8 | 0.6 | 0.6 | 0.2 | 0.3 | 0.3 | -0.2 | 1.5 | 0.5 |
| Q2 2015 | 0.4 | 0.4 | 0.4 | 0.0 | 0.5 | 0.3 | 0.5 | -0.1 | -0.1 | 0.6 |
| Q3 2015 | 0.4 | 0.3 | 0.4 | 0.4 | 0.2 | 0.1 | 0.3 | 0.6 | 0.2 | 0.5 |
| Q4 2015 | 0.6 | 0.5 | 0.2 | 0.4 | 0.4 | 0.2 | 0.7 | 0.1 | -0.4 | 0.2 |
| Q1 2016 | 0.5 | 0.5 | 0.4 | 0.6 | 0.7 | 0.4 | 0.3 | 0.7 | 0.7 | 0.2 |
| Q2 2016 | 0.4 | 0.3 | 0.3 | -0.1 | 0.4 | 0.1 | 0.6 | -0.3 | 0.5 | 0.4 |
| Q3 2016 | 0.4 | 0.3 | 0.6 | 0.2 | 0.2 | 0.3 | 0.6 | 0.9 | 0.3 | 0.8 |
| Sources: Office for National Statistics, Organisation for Economic Co-operation and Development, Eurostat, United States Bureau of Economic Analysis, Statistics Japan | ||||||||||
| Notes: | ||||||||||
| 1. EU28 is the European Union. | ||||||||||
| 2. EA19 is the eurozone. | ||||||||||
| 3. G7 is the Group of Seven countries. | ||||||||||
Download this table Table 3: International GDP growth rate comparisons, chained volume, seasonally adjusted
.xls (29.2 kB)
Figure 22: International GDP growth rates, quarter-on-quarter
Quarter 3 (July to Sept) 2006 to Quarter 3 2016
Source: Office for National Statistics
Notes:
- Q1 refers to Quarter 1 (Jan to Mar), Q2 refers to Quarter 2 (Apr to June), Q3 refers to Quarter 3 (July to Sept) and Q4 refers to Quarter 4 (Oct to Dec).
Download this chart Figure 22: International GDP growth rates, quarter-on-quarter
Image .csv .xlsFigure 23 shows GDP for the UK, EU28, EA19 and G7 all indexed to Quarter 1 2008 (the pre-downturn peak in the UK) to allow comparison of each since that period.
Figure 23: International group growth since 2008
Quarter 1 (Jan to Mar) 2008 to Quarter 3 (July to Sept) 2016, Indexed to 2008 Quarter 1 = 100
Source: Office for National Statistics
Notes:
- Q1 refers to Quarter 1 (Jan to Mar), Q2 refers to Quarter 2 (Apr to June), Q3 refers to Quarter 3 (July to Sept) and Q4 refers to Quarter 4 (Oct to Dec).
Download this chart Figure 23: International group growth since 2008
Image .csv .xls21. Quarterly revisions
GDP and components, previously published on 25 November 2016
Figure 24 shows quarterly revisions between latest and previously published estimates of gross domestic product (GDP). Quarter 1 (Jan to Mar) 2015 is the first quarter open for revision in this release.
Figure 24: UK GDP, quarter-on-quarter growth
Quarter 1 (Jan to Mar) 2013 to Quarter 3 (July to Sept) 2016
Source: Office for National Statistics
Notes:
- Q1 refers to Quarter 1 (Jan to Mar), Q2 refers to Quarter 2 (Apr to June), Q3 refers to Quarter 3 (July to Sept) and Q4 refers to Quarter 4 (Oct to Dec).
Download this chart Figure 24: UK GDP, quarter-on-quarter growth
Image .csv .xls22. Briefing on revisions to GDP
The 2015 picture
Annual gross domestic product (GDP) in volume terms was estimated to have increased by 2.2% in 2015 compared with 2014, unrevised from the previously published estimate. There are revisions to the 2015 quarterly levels, in particular to the detailed components of GDP, but there are no revisions to the 2015 headline GDP quarterly growth rates. The revisions to the more detailed components of GDP are mainly due to the planned correction of the processing error identified within the non-monetary gold and other precious metals series of UK trade and incorporating more robust annual data into the estimates. The processing correction of trade in non-monetary gold and other precious metals is explained in detail in the “Things you need to know” section and impact of the annual benchmarks are detailed in this section.
Impact of the 2015 annual benchmarks
This release includes the processing and GDP balancing of the following annual benchmarks:
- Local Government Final Outturn data for England and for Wales (for Financial Year 2015/16)
- Annual International Trade in Services Survey
- Financial Inquiries Surveys
- Regulatory and administrative data for insurance corporations and pension funds
- Association of British Insurers data for industry 65 (Insurance, reinsurance and pension funding, except compulsory social security)
Also please note the International Trade in Services benchmark did not feed in to the UK trade figures published on 9 December 2016 and therefore Quarterly National Accounts Quarter 3 (July to Sept) 2016 is the first opportunity to see the impact of this new data on UK trade.
The impact from the annual benchmarks on the 2015 dataset are presented for each of the affected components of output, expenditure and income in the remainder of this section.
Annual benchmark data changes to output components
In the output measure of GDP, annual benchmarks have been taken on in the financial services industries. This includes regulatory data for current price output of the insurance industry and direct volume measures from the Association of British Insurers. These annual benchmarks impact the insurance and reinsurance (65.1-2), pension funding (65.3) and activities auxiliary to financial services (66) industries. Quarterly revisions to the output measure of GDP in 2015 are small.
Annual benchmark data changes to expenditure components
Trade in goods (TiG): Although not impacted by the annual benchmark data changes, the large revisions are due to the correction of a processing error identified within the “erratics” series, details mentioned previously in this section.
Trade in services (TiS): Revisions to 2015 are mainly due to new, more robust (benchmark), data from the annual International Trade in Services Survey (ITIS) replacing earlier estimates from the smaller quarterly ITIS surveys. Additionally, new annual Financial Inquiries data and new regulatory data have revised insurance services. Annual estimates for both exports and imports chained volume measures, have been revised up in 2015; exports by £3.9 billion and imports by £3.1 billion.
Within exports, quarterly balancing adjustments, to improve the consistency of the quarterly path with the output and income approaches to GDP, contributed £1.75 billion of the total revision. Following on from this, the revised quarterly path needs to be constrained to the new annual level. The impact of the revised annual estimate does not have to be equally apportioned across the 4 quarters as statistical consideration has to be given to the pre-existing quarterly path and the impact of seasonal adjustment. This is why, although the overall annual revision may be upwards, there can still be downwards revisions to some of the quarterly growth rates.
A summary of the revisions is presented in Tables 4 and 5.
Table 4: Summary of revisions to imports of Trade in Services CP and CVM due to new benchmark data
| £ million | ||||||||
| Period | Total revision to imports of services, CP | Of which balancing adjustments | Of which annual benchmark | Total revision to imports of services, CVM | Of which balancing adjustments | Of which annual benchmark | ||
| Q1 2015 | +138 | 0 | +138 | +290 | 0 | +290 | ||
| Q2 2015 | +540 | 0 | +540 | +679 | 0 | +679 | ||
| Q3 2015 | +928 | 0 | +928 | +982 | 0 | +982 | ||
| Q4 2015 | +602 | 0 | +602 | +1 144 | 0 | +1 144 | ||
| Source: Office for National Statistics | ||||||||
| Notes: | ||||||||
| 1. Q1 is Quarter 1 (Jan to Mar), Q2 is Quarter 2 (Apr to June), Q3 is Quarter 3 (July to Sept) and Q4 is Quarter 4 (Oct to Dec). | ||||||||
Download this table Table 4: Summary of revisions to imports of Trade in Services CP and CVM due to new benchmark data
.xls (27.6 kB)
Table 5: Summary of revisions to exports of Trade in Services, CP and CVM due to new benchmark data
| £million | ||||||||
| Period | Total revision to exports of services, CP | Of which balancing adjustments | Of which annual benchmark | Total revision to exports of services, CVM | Of which balancing adjustments | Of which annual benchmark | ||
| Q1 2015 | +1 078 | +250 | +828 | +1 014 | +250 | +764 | ||
| Q2 2015 | +1 692 | +250 | +1 442 | +1 507 | +250 | +1 257 | ||
| Q3 2015 | +520 | +1 000 | -480 | +209 | +1 000 | -791 | ||
| Q4 2015 | +1 087 | +250 | +837 | +1 176 | +250 | +926 | ||
| Source: Office for National Statistics | ||||||||
| Notes: | ||||||||
| 1. Q1 is Quarter 1 (Jan to Mar), Q2 is Quarter 2 (Apr to June), Q3 is Quarter 3 (July to Sept) and Q4 is Quarter 4 (Oct to Dec). | ||||||||
Download this table Table 5: Summary of revisions to exports of Trade in Services, CP and CVM due to new benchmark data
.xls (28.2 kB)General government final consumption expenditure (GGFCE): Within the GGFCE composition, the local government (LG) revisions to current price data between Quarter 2 (Apr to June) 2015 and Quarter 1 (Jan to Mar) 2016 are largely driven by incorporating local government final outturn data for England and for Wales for the financial year ending 2016, replacing earlier forecasts based on budget data. The impact of incorporating this data has had minimal impact on revisions to the levels and growths, with very small differences between provisional and final outturn data.
Household final consumption expenditure (HHFCE): Revisions to 2015 data are mainly due to new data from the Living Costs and Food (LCF) Survey, the Department for Business, Energy and Industrial Strategy (BEIS), and the International Passenger Survey (IPS). New regulatory and administrative data for insurance corporations and pension funds is also a contributing factor to the revisions presented in the Classification of Individual Consumption by Purpose (COICOP) Miscellaneous category (12). A summary of revisions to HHFCE and the contribution to revisions from the Miscellaneous category are presented in Table 6.
Table 6: Summary of revisions to HHFCE due to new benchmark data
| £million | |||||||||||
| Period | Total revision to HHFCE | Total domestic revision | Total net tourism revision (IPS data) | ||||||||
| Of which, revision to 12 Miscellaneous | |||||||||||
| Q1 2015 | -138 | -131 | -28 | -7 | |||||||
| Q2 2015 | -644 | -615 | -54 | -29 | |||||||
| Q3 2015 | -327 | -303 | +20 | -24 | |||||||
| Q4 2015 | -381 | -384 | -89 | +3 | |||||||
| Source: Office for National Statistics | |||||||||||
| Notes: | |||||||||||
| 1. Q1 is Quarter 1 (Jan to Mar), Q2 is Quarter 2 (Apr to June), Q3 is Quarter 3 (July to Sept) and Q4 is Quarter 4 (Oct to Dec). | |||||||||||
Download this table Table 6: Summary of revisions to HHFCE due to new benchmark data
.xls (28.2 kB)Annual benchmark data changes to income components
Financial corporations (FinCos): Revisions to 2015 data are mainly due to new data from the annual Financial Inquiries (FI) Survey replacing earlier estimates from the smaller quarterly financial surveys, with the headline FinCos series being revised up by £3.4 billion in 2015. As noted in the earlier briefing on TiS, the revised quarterly path needs to be constrained to the new annual level. The impact of the revised annual estimate does not have to be equally apportioned across the 4 quarters, as statistical consideration has to be given to the pre-existing quarterly path and the impact of seasonal adjustment. These new data were the main reason for the positive revisions to 2015 quarterly levels (Table 7).
Table 7: Summary of revisions to FinCos, current prices due to new benchmark data
| £million | |
| Period | Total revision to FinCos due to new FI data |
| Q1 2015 | +907 |
| Q2 2015 | +735 |
| Q3 2015 | +1026 |
| Q4 2015 | +780 |
| Source: Office for National Statistics | |
| Notes: | |
| 1. Q1 is Quarter 1 (Jan to Mar), Q2 is Quarter 2 (Apr to June), Q3 is Quarter 3 (July to Sept) and Q4 is Quarter 4 (Oct to Dec). | |
Download this table Table 7: Summary of revisions to FinCos, current prices due to new benchmark data
.xls (27.1 kB)Compensation of employees (CoE): Revisions to CoE (D.1) were mainly downward with an overall annual downward revision of £1.6 billion to 2015. For all quarters of 2015, revisions were primarily due to downward revisions to employers’ social contributions (D.12). The largest contributor to the D.12 downward revisions was funded pension scheme data, which are sourced from the regulatory and administrative data for insurance corporations and pension funds. A summary of the revisions to CoE is presented in Table 8.
Table 8: Summary of revisions to UK Compensation of Employees (CoE) due to new benchmark data
| £million | ||||||||||||||
| Period | Total revision to CoE | Of which, Total Employers’ Social Contributions revision (D.12) | ||||||||||||
| Q1 2015 | -306 | -367 | ||||||||||||
| Q2 2015 | +110 | -30 | ||||||||||||
| Q3 2015 | -978 | -827 | ||||||||||||
| Q4 2015 | -426 | -586 | ||||||||||||
| Source: Office for National Statistics | ||||||||||||||
| Notes: | ||||||||||||||
| 1. Q1 is Quarter 1 (Jan to Mar), Q2 is Quarter 2 (Apr to June), Q3 is Quarter 3 (July to Sept) and Q4 is Quarter 4 (Oct to Dec). | ||||||||||||||
Download this table Table 8: Summary of revisions to UK Compensation of Employees (CoE) due to new benchmark data
.xls (27.6 kB)The latest quarterly headline picture
Table 9 shows quarterly revisions between latest and previously published estimates of GDP. The periods open for revision in this release are Quarter 1 (Jan to Mar) 2015 onwards. Growth rates and revisions have, as usual, been presented to 1 decimal place.
Table 9: Revisions to quarter on quarter percentage change growth rates for GDP
| Period | Quarter-on-quarter previously published | Quarter-on-quarter latest estimate | Total quarter-on-quarter revision |
| % growth | % growth | % growth | |
| Q1 2015 | +0.3 | +0.3 | +0.0 |
| Q2 2015 | +0.5 | +0.5 | +0.0 |
| Q3 2015 | +0.3 | +0.3 | +0.0 |
| Q4 2015 | +0.7 | +0.7 | +0.0 |
| Q1 2016 | +0.4 | +0.3 | -0.1 |
| Q2 2016 | +0.7 | +0.6 | -0.1 |
| Q3 2016 | +0.5 | +0.6 | +0.1 |
| Source: Office for National Statistics | |||
| Notes: | |||
| 1. Q1 is Quarter 1 (Jan to Mar), Q2 is Quarter 2 (Apr to June), Q3 is Quarter 3 (July to Sept) and Q4 is Quarter 4 (Oct to Dec). | |||
Download this table Table 9: Revisions to quarter on quarter percentage change growth rates for GDP
.xls (27.6 kB)In addition to the annual benchmarks which, as discussed previously, contribute to the quarterly revisions, there are also revisions in this release due to the replacement of forecasts with actual survey or external source data and new seasonal adjustment factors. For a fuller picture, the revisions to contributions to GDP growth are presented in Table 10.
Table 10: Revisions to contributions to GDP growth
| Seasonally adjusted | |||||||
| Period | Q1 2015 | Q2 2015 | Q3 2015 | Q4 2015 | Q1 2016 | Q2 2016 | Q3 2016 |
| pp revisions | pp revisions | pp revisions | pp revisions | pp revisions | pp revisions | pp revisions | |
| Household final consumption | |||||||
| expenditure | 0.0 | -0.1 | 0.1 | 0.0 | 0.1 | -0.1 | 0.1 |
| Non-profit institutions serving households | |||||||
| final consumption expenditure | 0.0 | 0.0 | 0.0 | 0.0 | 0.0 | 0.0 | 0.0 |
| General government final consumption expenditure | 0.0 | 0.0 | 0.0 | 0.0 | 0.0 | 0.0 | -0.1 |
| Gross capital formation | 0.0 | -0.6 | -0.1 | -0.7 | 0.3 | -0.2 | 1.3 |
| Exports | 0.3 | 0.1 | -0.1 | 0.5 | -0.9 | 0.7 | -1.0 |
| Imports | 0.2 | -0.2 | 0.0 | -0.2 | 0.0 | -0.3 | 0.9 |
| Net trade | 0.1 | 0.3 | -0.1 | 0.7 | -0.9 | 1.0 | -1.9 |
| GDP at market prices, chained volume measure | 0.0 | 0.0 | 0.0 | 0.0 | -0.1 | -0.1 | 0.1 |
| Compensation of employees | -0.1 | 0.1 | -0.2 | 0.1 | 0.1 | 0.1 | 0.0 |
| Gross operating surplus of corporations | -0.1 | 0.3 | 0.2 | -0.2 | 0.1 | -0.1 | -0.2 |
| Other income | 0.0 | 0.0 | 0.0 | 0.0 | 0.1 | -0.1 | 0.1 |
| Taxes less subsidies | 0.0 | 0.0 | 0.0 | 0.0 | 0.0 | 0.0 | 0.1 |
| GDP at market prices, current prices | -0.1 | 0.3 | 0.0 | -0.1 | 0.3 | -0.3 | 0.0 |
| Source: Office for National Statistics | |||||||
| Notes: | |||||||
| 1. Q1 is Quarter 1 (Jan to Mar), Q2 is Quarter 2 (Apr to June), Q3 is Quarter 3 (July to Sept) and Q4 is Quarter 4 (Oct to Dec). | |||||||
| 2. pp = percentage points. | |||||||
| 3. May not sum due to rounding. | |||||||
| 4. Although shown to 1 dp there are revisions (positive and negative contributions) although these are small. | |||||||
Download this table Table 10: Revisions to contributions to GDP growth
.xls (30.2 kB)Revisions to headline GDP quarter-on-quarter growth, chained volume measures
GDP for Quarter 1 (Jan to Mar) 2015 is unrevised at 0.3%. GDP components were broadly unrevised with a small (0.1 percentage points (pp)) upward contribution from net trade. although this revision was not enough to change the overall GDP growth.
GDP for Quarter 2 (Apr to June) 2015 is unrevised at 0.5%. Within the expenditure components, the large downward revision to gross capital formation (largely attributed to the valuables component) was partially offset by an upward revision to net trade along with smaller upward revision impacts from non-profit institutions serving households and gross fixed capital formation. This offsetting trade in goods and valuables impact has been explained in the “Things you need to know” section. Within the income components, gross operating surplus of corporations was the largest contributor to the revision with financial corporations accounting heavily for this upward revision (see earlier in this section for impact of annual benchmarks).
GDP for Quarter 3 (July to Sept) 2015 is unrevised at 0.3%. Downward revisions to the expenditure components were seen in both gross capital formation and net trade of negative 0.1 pp, with an offsetting upward revision to household final consumption expenditure of 0.1pp. Gross operating surplus of corporations was an upward contributor to the revisions, with financial corporations accounting heavily for this upward revision – which is reflected in the annual benchmark impact discussed earlier. This was offset by a downward revision to compensation of employees of 0.2pp.
GDP for Quarter 4 (Oct to Dec) 2015 is unrevised at 0.7%. The downward revision to gross capital formation of negative 0.7pp is completely offset by an upward revision to net trade of 0.7pp and the GDP neutral impact is explained in the “Things you need to know” section. Gross operating surplus of corporations was a downward contributor to the revisions, with financial corporations accounting heavily for this downward revision. This was offset by an upward revision to compensation of employees of 0.1pp.
GDP for Quarter 1 (Jan to Mar) 2016 was revised down by 0.1pp to 0.3%, with expenditure components contributing most to the downward revision. Net trade was the largest contributor to the revision, being revised down 0.9pp driven by revisions to both trade in goods and trade in services, which was slightly offset by an upward revision to gross capital formation of 0.3pp.
GDP for Quarter 2 (Apr to June) 2016 has been revised down by 0.1 percentage points to 0.6% with downward revisions to HHFCE and gross capital formation but offsetting upward revisions to net trade driven by an upward revision to the fuels commodity within trade in goods.
In Quarter 3 (July to Sept) 2016, the data content for the output approach is more complete than the expenditure and income approaches. Consequently, the expenditure and income growth rates are aligned to the output measure – with the quarterly imbalance being absorbed in the alignment adjustments (the difference between output and expenditure, and output and income on a quarterly basis). Therefore the briefing on this quarter focuses on the output approach.
The revisions to contributions to GDP Quarter 3 2016 growth for the output components are presented in Table 11.
Table 11: Revisions to contributions to GDP Q3 2016
| Seasonally adjusted | |
| Quarter-on-quarter contribution to growth current period | Q3 2016 |
| % revision | |
| Agriculture, forestry and fishing | 0.0 |
| Total production | 0.0 |
| Total services | 0.1 |
| Of which: | |
| Distribution hotels and restaurants | 0.0 |
| Transport storage and communication | 0.0 |
| Business services and finance | 0.1 |
| Government and other services | 0.0 |
| Construction | 0.0 |
| Gross Value Added by category of output, chained volume measures | 0.10 |
| Source: Office for National Statistics | |
| Notes: | |
| 1. May not sum due to rounding. | |
| 2. Q3 is Quarter 3 (July to Sept). | |
Download this table Table 11: Revisions to contributions to GDP Q3 2016
.xls (27.6 kB)GDP for Quarter 3 (July to Sept) 2016 has been revised up by 0.1pp to 0.6%. This is due to upward revisions for the services industries within the output approach to measuring GDP from the business services and finance industries – which was revised up 0.5pp to 0.8%. The largest contributors to the revision were: financial services, insurance, and pensions fund industries (64 to 66). These revisions were mainly due to real data replacing forecasts and upward revisions to insurance survey data.
Table 12 shows revisions to the quarter–on-same-quarter a year ago growth for GDP.
Table 12: Revisions to quarter on same quarter a year ago GDP
| Seasonally adjusted | |||
| Quarter-on-same-quarter-a- year-ago previously published | Quarter-on-same-quarter-a-year-ago latest estimate | Total quarter-on-same-quarter-a- year-ago revision | |
| % growth | % growth | % growth | |
| Q1 2015 | +2.8 | +2.8 | +0.0 |
| Q2 2015 | +2.4 | +2.4 | +0.0 |
| Q3 2015 | +1.9 | +1.8 | -0.1 |
| Q4 2015 | +1.7 | +1.7 | +0.0 |
| Q1 2016 | +1.9 | +1.8 | -0.1 |
| Q2 2016 | +2.1 | +2.0 | -0.1 |
| Q3 2016 | +2.3 | +2.2 | -0.1 |
| Source: Office for National Statistics | |||
| Notes: | |||
| 1. Q1 is Quarter 1 (Jan to Mar), Q2 is Quarter 2 (Apr to June), Q3 is Quarter 3 (July to Sept) and Q4 is Quarter 4 (Oct to Dec). | |||
Download this table Table 12: Revisions to quarter on same quarter a year ago GDP
.xls (27.1 kB)The revisions for the quarter-on-same-quarter a year ago growths for GDP in 2016 are due to revisions in both 2016 and 2015, while the revisions for the quarter-on-same-quarter a year ago growths for GDP in 2015 are due to revisions in 2015, as 2014 has been unrevised in this release. The revisions to contributions to GDP growth are presented in Table 13.
Table 13: Revisions to contributions to GDP growth
| seasonally adjusted, revision % | |||||||
| Q1 2015 | Q2 2015 | Q3 2015 | Q4 2015 | Q1 2016 | Q2 2016 | Q3 2016 | |
| quarter-on-same-quarter -a-year-ago revisions to contributions to growth, expenditure components, current period | |||||||
| Household final consumption | |||||||
| expenditure | 0.0 | -0.1 | -0.1 | -0.1 | 0.0 | 0.0 | 0.0 |
| Non-profit institutions serving households | |||||||
| final consumption expenditure | 0.0 | 0.0 | 0.0 | 0.0 | 0.0 | 0.0 | 0.0 |
| General government final consumption expenditure | 0.0 | 0.0 | 0.0 | -0.1 | -0.1 | -0.1 | -0.1 |
| Gross capital formation | 1.6 | 0.7 | -0.1 | -1.5 | -1.1 | -0.7 | 0.8 |
| Exports | 0.3 | 0.4 | 0.3 | 0.8 | -0.4 | 0.2 | -0.7 |
| Imports | 0.2 | 0.0 | 0.0 | -0.1 | -0.3 | -0.4 | 0.5 |
| Net trade | 0.1 | 0.4 | 0.3 | 0.9 | -0.1 | 0.7 | -1.2 |
| GDP at market prices, chained volume measure | 0.0 | 0.0 | -0.1 | 0.0 | -0.1 | -0.1 | -0.1 |
| quarter-on-same-quarter -a-year-ago revisions to contributions to growth, income components, current period | |||||||
| Compensation of employees | -0.1 | 0.0 | -0.2 | -0.1 | 0.1 | 0.1 | 0.3 |
| Gross operating surplus of corporations | -0.1 | 0.2 | 0.4 | 0.2 | 0.4 | 0.0 | -0.4 |
| Other income | 0.0 | 0.0 | 0.0 | 0.0 | 0.1 | 0.0 | 0.0 |
| Taxes less subsidies | 0.0 | 0.0 | 0.0 | 0.0 | 0.0 | 0.0 | 0.1 |
| GDP at market prices, current prices | -0.1 | 0.2 | 0.2 | 0.1 | 0.5 | 0.0 | 0.0 |
| Source: Office for National Statistics | |||||||
| Notes: | |||||||
| 1. Q1 is Quarter 1 (Jan to Mar), Q2 is Quarter 2 (Apr to June), Q3 is Quarter 3 (July to Sept) and Q4 is Quarter 4 (Oct to Dec). | |||||||
| 2. May not sum due to rounding. | |||||||
Download this table Table 13: Revisions to contributions to GDP growth
.xls (29.7 kB)Detailed revisions for the 3 GDP approaches
Output revisions are shown in Table AE, expenditure revisions are shown in Table AF and income revisions are shown in Table AG.
Sector accounts revisions, previously published 30 September 2016
Sector accounts revisions are shown in Table AH.
Back to table of contents23. Quality and methodology
The Quality and Methodology Information report for this statistical bulletin contains important information on:
- the strengths and limitations of the data and how it compares with related data
- users and uses of the data
- how the output was created
- the quality of the output including the accuracy of the data
24. A brief explanation of non-monetary gold in national accounts
Introduction
Non-monetary gold (NMG) is an erratic series that is a component of trade in goods and services; it also appears within gross capital formation (GCF) as valuables. There have been some large revisions to this series recently. This section explains why neither the erratic path of NMG nor revisions to trade in NMG have an impact on gross domestic product (GDP) – the effect is GDP neutral.
What is Non-Monetary Gold?
Gold may be held as a reserve asset by a monetary authority. If so, this gold is classified as monetary gold and is recorded in the financial account. However, others may hold gold such as jewellery as a store of wealth. Gold that is not held as a reserve asset by a monetary authority is classified as NMG. When gold is held in an allocated account, full legal ownership of the physical gold itself is given to the account owner. In this instance, transactions involving the gold feed into trade in goods or valuables.
Trade in NMG (that is, gold bullion, gold coin, unwrought or semi-manufactured gold and scrap) is included within the erratic component of UK net exports (Exports (X) minus Imports (M)). Whereas, trade in finished manufactures of gold (for example, jewellery) are included elsewhere in net exports as trade in goods.
Acquisitions less Disposals of Valuables
Acquisitions less disposals of valuables are non-financial assets that are not used up in production or consumption, do not deteriorate (physically) over time under normal conditions, and are acquired and held primarily as stores of value in the expectation that their value will increase over time. Valuables consist of works of art, precious metals (including NMG), and stones and articles of jewellery fashioned out of said materials.
GDP Neutrality
Trade in existing NMG (gold that is already being held as a valuable) tends to be a very volatile series despite being smoothed via a moving average. This trade in NMG is GDP neutral (not impacting GDP) as explained through the mechanisms in this section. It should be noted that, while the trade of existing NMG itself is GDP neutral, there are separate costs of ownership transfer on valuables, which are treated as intermediate consumption in the national accounts.
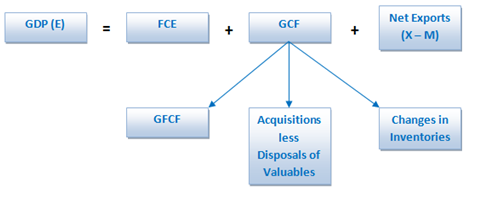
The expenditure method of measuring GDP (GDP (E)) is made up of final consumption expenditure (FCE), GCF, and net exports. GCF is subdivided into gross fixed capital formation (GFCF), acquisitions less disposals of valuables, and changes in inventories.
From this explanation; in calculating GDP (E), exports of NMG have a positive impact on net exports whilst imports have a negative impact. However, when NMG is exported there is a corresponding decrease in GCF (valuables) held within the UK; the opposite can be said for importing NMG. When NMG is imported there is a corresponding increase in GCF (valuables) held within the UK.
For example, suppose that a resident that is not a monetary authority purchases an amount of gold equivalent to £1 million and the gold is purchased from a foreign party. Imported gold is seen as an acquisition of a valuable as the gold enters the UK; however, £1 million is subtracted from GDP due to the import. As the value of the gold acquisition and the import cancel out, the net effect is a GDP neutral impact on UK GDP. The opposite can be said for exporting gold abroad; if £1 million worth of gold was sold to a foreign party then this is a disposal of gold equal to £1 million (a reduction in acquisitions less disposals of valuables of £1 million) yet £1 million is added to UK GDP via the transaction (an increase in net exports of £1 million).
Back to table of contents