Table of contents
- Main points
- Summary
- Understanding this release
- The latest public sector net borrowing position
- The latest public sector net debt position
- Net borrowing and debt statistics compared with OBR forecast
- International comparisons of borrowing and debt
- Public sector net cash requirement
- Central government receipts and expenditure
- Recent events and forthcoming methodological changes
- Revisions since previous bulletin
- New to the bulletin
- Consultation with users
- Changes to publication schedule for economic statistics
- Background notes
1. Main points
The data in this bulletin presents the latest fiscal position of the UK public sector as at 31 August 2016 and so includes 2 months of post-EU referendum data. However, estimates for the latest period always contain a substantial forecast element and the figures have to be considered in this light.
Public sector net borrowing (excluding public sector banks) decreased by £4.9 billion to £33.8 billion in the current financial year-to-date (April to August 2016), compared with the same period in 2015.
Public sector net borrowing (excluding public sector banks) decreased by £0.9 billion to £10.5 billion in August 2016, compared with August 2015.
Public sector net debt (excluding public sector banks) at the end of August 2016 was £1,621.5 billion, equivalent to 83.6% of gross domestic product (GDP); an increase of £52.0 billion compared with August 2015.
Central government net cash requirement decreased by £7.1 billion to £19.4 billion in the current financial year-to-date (April to August 2016), compared with the same period in 2015.
Due to the volatility of the monthly data, the cumulative financial year-to-date borrowing figures provide a better indication of the progress of the public finances than the individual months.
EU government debt and deficit
On 15 July 2016, we published the latest UK Government Debt and Deficit for Eurostat statistical bulletin which reported that:
- general government deficit (Maastricht borrowing) in the financial year ending March 2016 (April 2015 to March 2016) was £74.5 billion, equivalent to 4.0% of GDP
- general government gross debt (Maastricht debt) at the end of March 2016 was £1,649.2 billion, equivalent to 87.7% of GDP
This publication reports that Maastricht borrowing in the financial year ending March 2016 has been revised upward by £2.1 billion to £76.6 billion (equivalent to 4.1% of GDP). Similarly, Maastricht debt at the end of March 2016 has been revised upward by £2.7 billion to £1,651.9 billion (equivalent to 87.9% of GDP).
Please refer to section 7, International comparisons of borrowing and debt for further detail.
Back to table of contents2. Summary
This section provides a summary of the main messages of this statistical bulletin which you may find helpful. You may also like to receive Twitter updates by following @frasermunropsf. We recently published an article titled The debt and deficit of the UK public sector explained which you may also find useful.
The data in this bulletin presents the latest fiscal position of the UK public sector as at 31 August 2016 and so includes 2 months of post-EU referendum (23 June 2016) data. However, estimates for the latest period always contain a substantial forecast element and the figures have to be considered in this light.
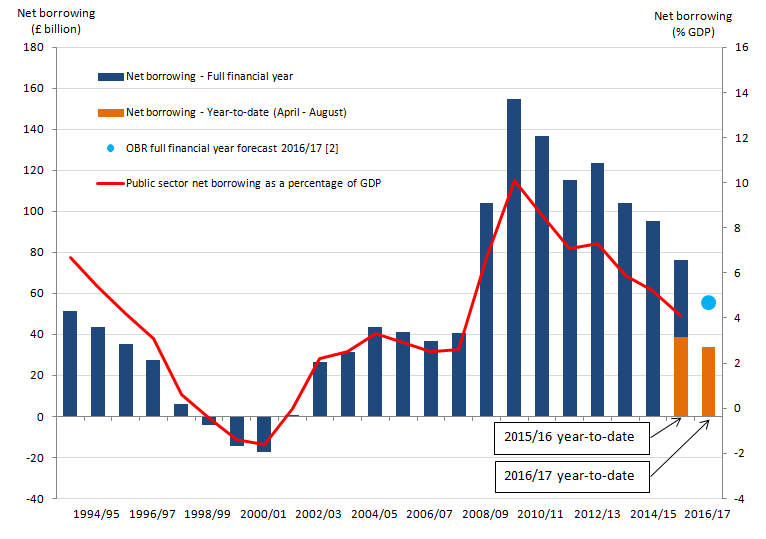
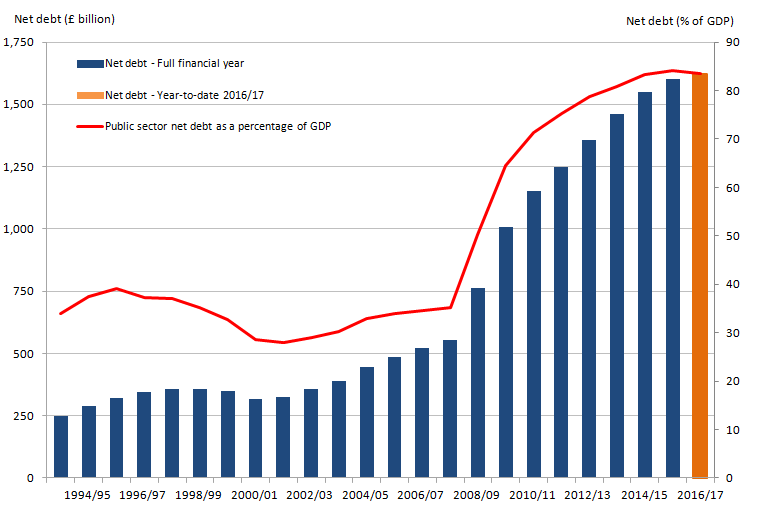
Figure 1: The amount borrowed by the public sector has been falling since the peak in the financial year1 ending March 2010
UK public sector borrowing, April 1993 to August 2016
Source: Office for National Statistics
Notes:
- Financial year 2016/17 represents financial year ending 2017 (April 2016 to March 2017).
- OBR full financial year forecast for public sector net borrowing excluding public sector banks from March 2016 Economic and Fiscal Outlook (EFO).
Download this image Figure 1: The amount borrowed by the public sector has been falling since the peak in the financial year^1^ ending March 2010
.png (35.1 kB) .xls (59.9 kB)
Public sector borrowing (or deficit)
In August 2016, the public sector spent more money than it received in taxes and other income. This meant it had to borrow £10.5 billion to balance the books.
Of this £10.5 billion, £7.6 billion related to the cost of the “day-to-day” activities of the public sector (the current budget deficit), while £2.9 billion related to the spending on infrastructure (net investment).
In the current financial year-to-date (April to August 2016), the public sector borrowed £33.8 billion. This was £4.9 billion lower than in the previous financial year-to-date (April to August 2015).
Annual borrowing has generally been falling since the peak in the financial year ending March 2010 (April 2009 to March 2010).
In the financial year ending March 2016 (April 2015 to March 2016), the public sector borrowed £76.5 billion. This was £18.9 billion lower than in the previous financial year and less than half of that in the financial year ending March 2010 (both in terms of £ billion and percentage of GDP).
The Office for Budget Responsibility (OBR), which produces economic and fiscal forecasts for government, recorded that the public sector would borrow £72.2 billion during the financial year ending March 2016. So, based on the latest estimate, borrowing in financial year ending March 2016 is £4.3 billion higher than OBR predicted. However the estimates for the financial year ending March 2016 may still be subject to further revision as elements of provisional data are replaced with finalised and audited data.
OBR have estimated that the public sector will borrow £55.5 billion during the financial year ending March 2017; a reduction of £21.0 billion on the financial year ending March 2016.
Income and spending by central government
Central government’s income and spending make the largest contribution to the amount borrowed by the public sector. In the current financial year-to-date (April to August 2016), central government received £264.6 billion in income. This was around 4% higher than in the previous financial year-to-date (April to August 2015), largely due to receiving more Income Tax, Corporation Tax and National Insurance contributions, along with taxes on production such as VAT and Stamp Duty, compared with the previous year.
Over the same period (April to August 2016), central government spent £291.7 billion; roughly the same as in the equivalent period in the previous financial year. Of this amount, just below two-thirds was spent by central government departments (such as health, education and defence), around a third on social benefits (such as pensions, unemployment payments, Child Benefit and Maternity Pay) with the remaining being spent on capital investment and interest on the government’s outstanding debt.
Debt
While deficit represents the difference between income and spending over a period of time, debt represents the total amount of money owed at a point in time. Debt has been built up by successive government administrations over many years. When the government borrows, this adds to the debt total. So reducing the deficit is not the same as reducing the debt.
The amount of money owed by the government to the private sector stood at £1.6 trillion at the end of August 2016, which equates to 83.6% of the value of all the goods and services currently produced by the UK economy in a year (or GDP).
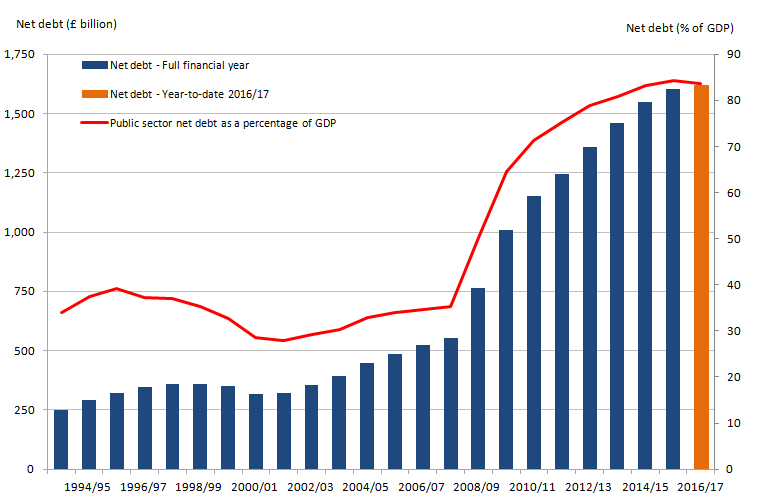
Figure 2 : Public sector debt increased rapidly following the banking crisis in the financial year1 ending March 2008
UK public sector debt, March 1994 to August 2016
Source: Office for National Statistics
Notes:
- Financial year 2016/17 represents financial year ending 2017 (April 2016 to March 2017).
Download this image Figure 2 : Public sector debt increased rapidly following the banking crisis in the financial year^1^ ending March 2008
.png (33.3 kB) .xls (39.9 kB)
3. Understanding this release
This statistical bulletin provides important information on the UK government financial position. It enables government, the public, economists and financial analysts to monitor public sector expenditure, receipts, investments, borrowing and debt. By comparing these data with forecasts from the Office for Budget Responsibility (OBR) the current UK fiscal position can be evaluated.
Table 8: Terms to help you understand this release, located in the background notes of this bulletin, is intended to provide you with the important terms needed to understand the data within this bulletin. We recently published an article titled The debt and deficit of the UK public sector explained which you may also find useful.
Headline public sector finances data
This release presents the first estimate of August 2016 public sector finances, along with the financial year-to-date, April to August 2016. While public sector finance data are available on a monthly basis, due to the volatility of the monthly time series, it is often more informative to look at the financial year-to-date or complete financial year data in order to discern underlying patterns. Estimates are revised over time as additional data becomes available.
Table 1 summarises the latest headline public sector finances measures, comparing the latest month and cumulative totals for the financial year-to-date, with the equivalent period in the previous financial year.
Table 1: Headline public sector finances data, by month and full financial year
| UK, excluding public sector banks | £ billion1 (not seasonally adjusted) | |||||
| August | Financial year-to-date7 | |||||
| 2016 | 2015 | Change | 2016/178 | 2015/168 | Change | |
| Current budget deficit2 | 7.6 | 9.0 | -1.4 | 22.9 | 28.2 | -5.3 |
| Net investment 3 | 2.9 | 2.5 | 0.5 | 10.9 | 10.5 | 0.4 |
| Net borrowing 4 | 10.5 | 11.5 | -0.9 | 33.8 | 38.7 | -4.9 |
| Net debt 5 | 1,621.5 | 1,569.5 | 52.0 | 1,621.5 | 1,569.5 | 52.0 |
| Net debt as a percentage of annual GDP6 | 83.6 | 83.6 | 0.0 | 83.6 | 83.6 | 0.0 |
| Source: Office for National Statistics | ||||||
| Notes: | ||||||
| 1. Unless otherwise stated. | ||||||
| 2. Current budget deficit is the difference between current expenditure (including depreciation) and current receipts. | ||||||
| 3. Net investment is gross investment (net capital formation plus net capital transfers) less depreciation. | ||||||
| 4. Net borrowing is current budget deficit plus net investment. | ||||||
| 5. Net debt is financial liabilities (for loans, deposits, currency and debt securities) less liquid assets. | ||||||
| 6. GDP at current market price. | ||||||
| 7. Financial year-to-date refers to the period from April to August | ||||||
| 8. 2016/17 refers to financial year ending in March 2017 and 2015/16 refers to financial year ending in March 2016. | ||||||
Download this table Table 1: Headline public sector finances data, by month and full financial year
.xls (33.8 kB)Time series for each component are available in Table PSA1 in the Public Sector Finances Tables 1 to 10: Appendix A dataset.
How the public sector finances fit together
Figure 3 illustrates how the difference in income (often referred to as current receipts) and spending (often referred to as current expenditure) lead to the accumulation of debt.
The headline measures of current budget deficit, net borrowing, net cash requirement and net debt are highlighted in the diagram as they provide the important indicators for the performance of the UK public finances.
When expenditure is greater than income, the public sector runs a deficit, known as the current budget deficit. Net borrowing is made up of the current budget deficit plus net investment (spending on capital less capital receipts). The diagram shows how net borrowing contributes to the change in net debt.
The net cash requirement is closely related to net debt (the amount owed). It is important because it represents the cash needed to be raised from the financial markets to service the government’s borrowing deficit. Changes in net debt between 2 points in time are normally similar to the net cash requirement for the intervening period, though the relationship is not an exact one.
Figure 3: Changes in public sector finances (excluding public sector banks) financial year to date ending 2017 (£ billion)

Source: Office for National Statistics
Notes:
- Cash transactions in (non-financing) financial assets which do not impact on net borrowing.
- Timing differences between cash and accrued data.
- Revaluation of foreign currency debt (for example foreign currency) Debt issuances or redemptions above/below debt valuation (for example Bond premia/discounts and capital uplifts). Changes in volume of debt not due to transactions (for example Sector reclassification).
Download this image Figure 3: Changes in public sector finances (excluding public sector banks) financial year to date ending 2017 (£ billion)
.png (128.5 kB) .xls (41.5 kB)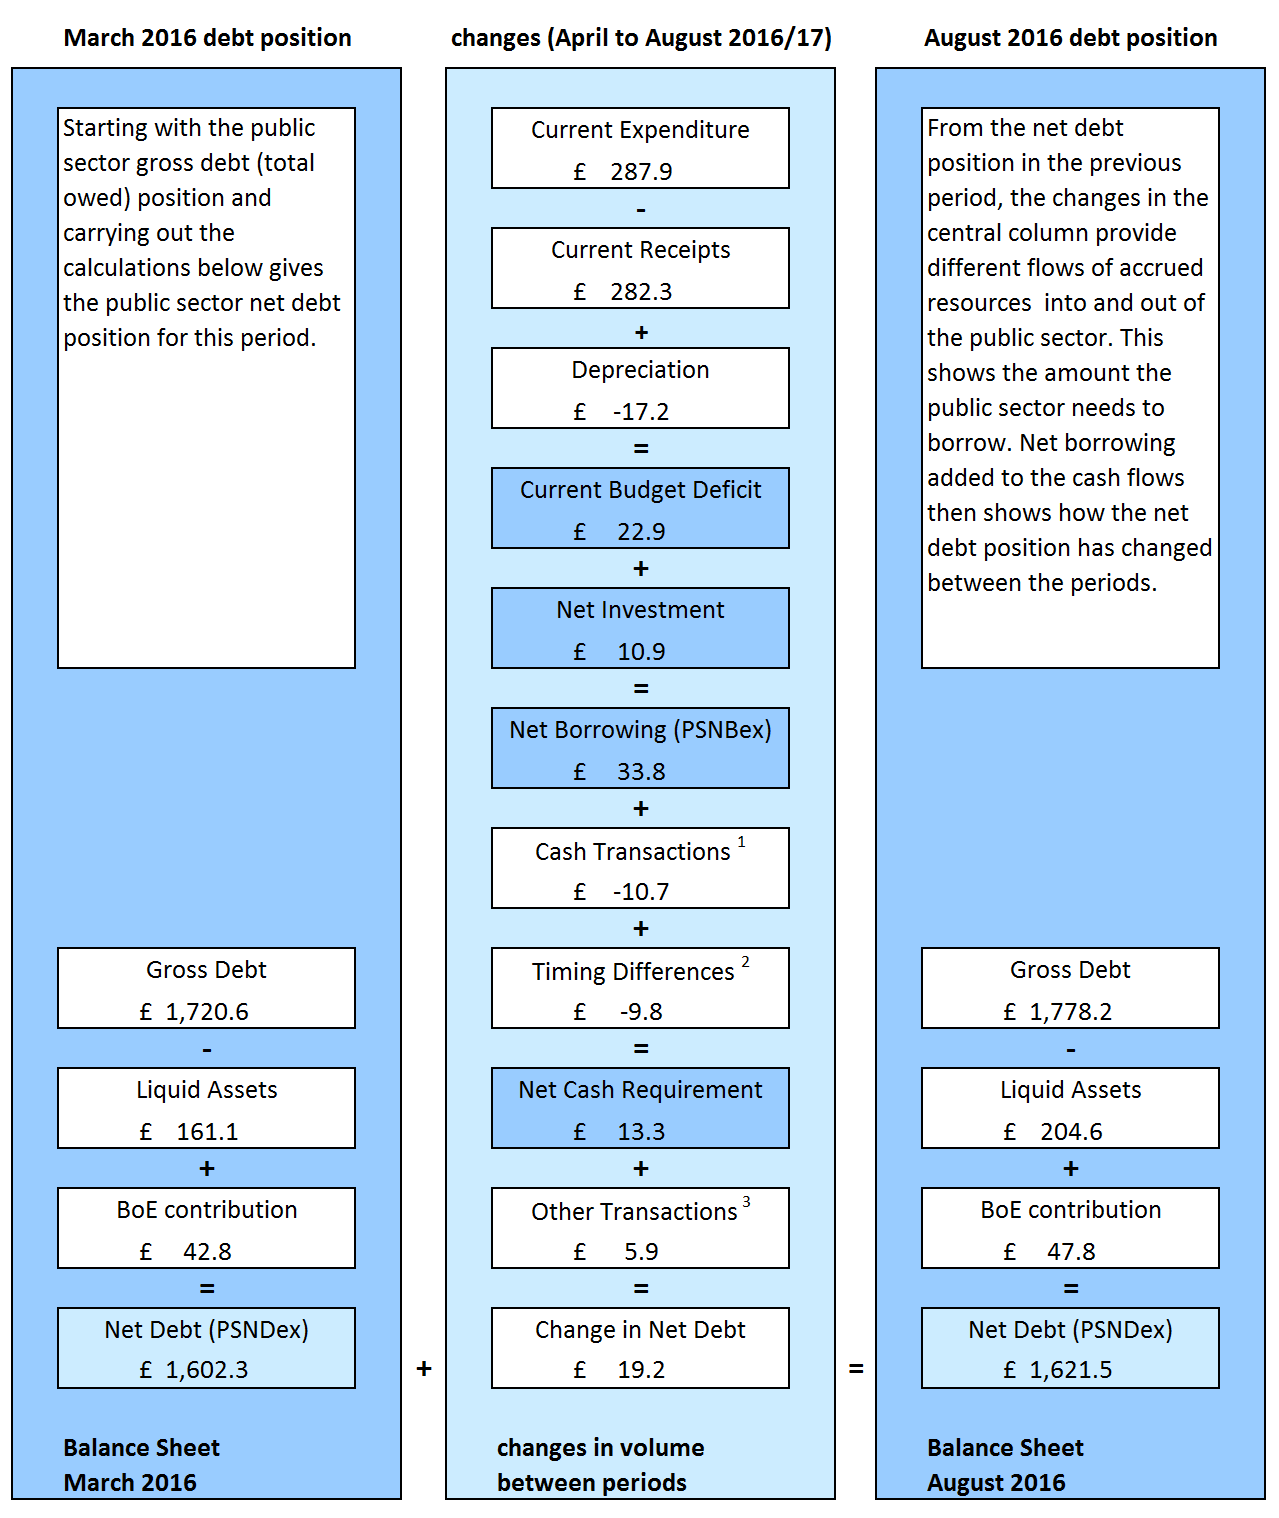
4. The latest public sector net borrowing position
In the UK, the public sector consists of 5 sub-sectors: central government, local government, public non-financial corporations, Bank of England and public financial corporations (that is, public sector banks).
Table 2 summarises the current monthly and financial year-to-date borrowing position of each of these sub-sectors along with the public sector aggregates.
Full time series for these data can be found in Table PSA2 in the Public Sector Finances Tables 1 to 10: Appendix A dataset.
Table 2: Sub-sector breakdown of public sector net borrowing
| UK | £ billion (not seasonally adjusted) | |||||
| August | Financial year-to-date1 | |||||
| 2016 | 2015 | Change | 2016/172 | 2015/162 | Change | |
| General government | 11.5 | 12.1 | -0.6 | 33.1 | 38.0 | -4.9 |
| of which | ||||||
| Central government | 9.6 | 10.0 | -0.4 | 35.3 | 42.1 | -6.8 |
| Local government | 1.9 | 2.1 | -0.2 | -2.2 | -4.0 | 1.8 |
| Public non-financial corporations | 0.1 | 0.2 | -0.1 | 0.9 | 1.2 | -0.3 |
| Bank of England | -1.1 | -0.9 | -0.2 | -0.2 | -0.5 | 0.4 |
| Public sector ex (PSNB ex) | 10.5 | 11.5 | -0.9 | 33.8 | 38.7 | -4.9 |
| Public financial corporations | -0.5 | -0.5 | 0.0 | -2.5 | -2.8 | 0.3 |
| Public sector (PSNB) | 10.1 | 11.0 | -0.9 | 31.3 | 35.9 | -4.6 |
| Source: Office for National Statistics | ||||||
| Notes: | ||||||
| 1. Financial year-to-date refers to the period from April to August. | ||||||
| 2. 2016/17 refers to financial year ending in March 2017 and 2015/16 refers to financial year ending in March 2016. | ||||||
Download this table Table 2: Sub-sector breakdown of public sector net borrowing
.xls (33.3 kB)Figure 4 illustrates public sector net borrowing excluding public sector banks (PSNB ex) for the last 23 financial years. For all but 3 years in the period the public sector has been in deficit and had to borrow to fund the gap between expenditure and revenue.
Figure 4: Public sector net borrowing excluding public sector banks; the financial year ending 1994 to the financial year ending 20171
UK, all data excluding public sector banks

Source: Office for National Statistics
Notes:
- Financial year 2016/17 represents financial year ending 2017 (April 2016 to March 2017).
- OBR full financial year forecast for public sector net borrowing excluding public sector banks from March 2016 Economic and Fiscal Outlook (EFO).
Download this image Figure 4: Public sector net borrowing excluding public sector banks; the financial year ending 1994 to the financial year ending 2017^1^
.png (37.2 kB) .xls (62.5 kB)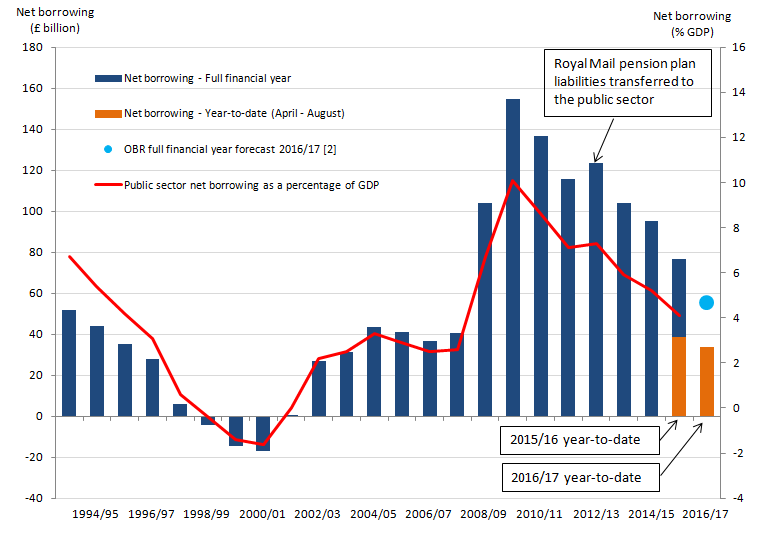
PSNB ex peaked in the financial year ending March 2010 (April 2009 to March 2010) as the effects of the economic downturn impacted on the public finances (reducing tax receipts while expenditure continued to increase).
In the financial year ending March 2016 (April 2015 to March 2016), the public sector borrowed £76.5 billion. This was £18.9 billion lower than in the previous financial year. These are not final figures and may be revised over the coming months as provisional data are replaced with finalised and audited data.
This latest estimate suggests that borrowing in the financial year ending March 2016 is less than half of that in the financial year ending March 2010; both in terms of £ billion (Table PSA2) and percentage of GDP (Table PSA5A).
PSNB ex has reduced since the financial year ending March 2010, although remained higher than before the financial year ending March 2008 (April 2007 to March 2008) and the 2007 global financial market shock.
PSNB ex in the financial year ending March 2013 (April 2012 to March 2013) was higher than in the previous financial year largely as a result of the recording of an £8.9 billion payable capital transfer in April 2012, as recognition that the liabilities transferred from the Royal Mail Pension Plan exceeded the assets transferred.
Net borrowing for the financial year-to-date (April to August 2016)
Due to the volatility of the monthly data, the cumulative financial year-to-date borrowing figures provide a better indication of the progress of the public finances than the individual months.
In the financial year-to-date (April to August 2016), public sector net borrowing excluding public sector banks (PSNB ex) was £33.8 billion; a decrease of £4.9 billion, or 12.7% compared with the same period in 2015.
In this period, there was a £6.8 billion decrease in central government net borrowing, along with a £0.3 billion decrease in the net borrowing of public corporations and a £1.8 billion increase (or decrease in surplus) in local government net borrowing.
Over the same period, Bank of England (BoE) net borrowing was £0.4 billion higher than in the previous financial year-to-date, almost entirely due to differences in the size of Asset Purchase Facility (APF) transfers to central government. The combined net borrowing of central government and the BoE in the financial year-to-date was £6.4 billion lower than in the previous financial year.
Central government receipts for the financial year-to-date (April to August 2016) were £264.6 billion, an increase of £11.1 billion, or 4.4%, compared with the same period in the previous financial year. Of which:
- social (National Insurance) contributions increased by £3.6 billion, or 7.8%, to £49.7 billion
- Income Tax-related payments increased by £2.6 billion, or 3.9%, to £68.0 billion
- VAT receipts increased by £1.8 billion, or 3.4%, to £55.3 billion
- Corporation Tax increased* by £0.9 billion, or 5.2%, to £18.7 billion
- interest & dividend payments increased by £0.8 billion, or 10.3%, to £8.3 billion
- Stamp Duty on land and property increased by £0.5 billion, or 10.1%, to £5.1 billion
The first payment under the Bank Corporation Tax surcharge scheme was received in July 2016 and this payment of £0.3 billion was recorded under central government receipts within Corporation Tax.
Central government expenditure (current and capital) for the financial year-to-date (April to August 2016) was £291.7 billion, an increase of £3.7 billion, or 1.3%, compared with the same period in the previous financial year. Of which:
- central government net investment (capital expenditure) increased by £1.5 billion, or 11.8%, to £14.2 billion; largely as a result of an increase in capital transfers to central government and other sectors and an increase in gross capital formation
- debt interest increased by £1.1 billion, or 5.1%, to £22.5 billion; of this £22.5 billion, £5.8 billion is the interest payable to the Bank of England Asset Purchase Facility on its gilt holdings (see Table PSA9 in Table PSA1 in the Public Sector Finances Tables 1 to 10: Appendix A dataset) which are PSNB ex neutral
- net social benefits (mainly pension payments) increased by £0.9 billion, or 1.1%, to £85.6 billion; largely as a result of increases in state pension payments (within National Insurance Fund benefits) and public sector pension contributions
- other current expenditure (mainly departmental spending) increased by £0.2 billion, or 0.1%, to £169.3 billion; largely as a result of increases in departmental spending on goods and services, being offset by decreases in transfers to local government
Local government net borrowing (LGNB) for the financial year-to-date (April to August 2016) was estimated to be in surplus of £2.2 billion, a £1.8 billion decrease in surplus on the same period in the previous financial year. This decrease in surplus was largely due to decreases in grants received from central government, particularly in April, being partially offset by increases in tax receipts and decreases in expenditure on goods and services.
In September 2016, detailed budget data were incorporated into the estimation of LGNB, replacing estimates that were previously based on forecasts produced by the Office for Budget Responsibility in March 2016. Administrative source data are used for central government to local government transfers.
Detailed time series for each of the expenditure and revenue component series of local government net borrowing are presented in Tables PSA6G to 6K in the Public Sector Finances Tables 1 to 10: Appendix A dataset.
Public corporations’ net borrowing (PCNB) for the financial year-to-date (April to August 2016) was estimated to be £0.9 billion, a decrease of £0.3 billion on the same period in the previous financial year.
Public corporations data for April to August 2016 are provisional estimates calculated by ONS based on OBR forecasts.
Net borrowing in August 2016
In August 2016, public sector net borrowing (excluding public sector banks) was £10.5 billion; a decrease of £0.9 billion, or 8.1% compared with August 2015.
This decrease in borrowing was largely due to a decrease in central government net borrowing of £0.4 billion; along with decreases of £0.2 billion, £0.1 billion and £0.2 billion in local government, public corporations and Bank of England’s net borrowing respectively.
The data for the latest month of every release contains some forecast data. The initial outturn estimates for the early months of the financial year contain more forecast data than other months, as profiles of tax receipts and departmental spending on OSCAR and local government spending are provisional. This means that the data for these months are typically more prone to revision than other months and can be subject to sizeable revisions in later months.
Central government receipts in August 2016 were £49.8 billion, an increase of £3.3 billion, or 7.1%, compared with August 2015. Of this:
- Income Tax-related payments increased by £1.5 billion, or 12.0%, to £13.6 billion
- Social (National Insurance) contributions increased by £0.8 billion, or 8.2%, to £9.9 billion
- Tobacco Tax increased by £0.3 billion, or 73.7%, to £0.8 billion
- Corporation Tax increased by £0.2 billion, or 15.1%, to £1.6 billion
- VAT receipts increased by £0.1 billion, or 0.7%, to £11.0 billion
- Stamp Duty on land and property increased by £0.1 billion, or 14.3%, to £1.1 billion
Central government expenditure (current and capital) in August 2016 was £57.7 billion, an increase of £2.8 billion, or 5.1%, compared with August 2015. Of this:
- other current expenditure (mainly departmental spending) increased by £0.8 billion, or 2.6%, to £33.0 billion; largely as a result of an increase in departmental spending on goods and services and contributions to the EU
- debt interest in August 2016 increased by £0.7 billion, or 17.9%, to £4.7 billion; of this £4.7 billion, £1.2 billion is the net interest paid to the Asset Purchase Facility Fund (APF) on its gilt holdings (see Table PSA9 in the Public Sector Finances Tables 1 to 10: Appendix A dataset) which are PSNB ex neutral
- net social benefits (mainly pension payments) increased by £0.7 billion, or 4.4%, to £17.4 billion; largely as a result of increases in social assistance payments, public sector pension payments and state pension payments (within National Insurance Fund benefits)
- central government net investment (capital expenditure) increased by £0.5 billion, or 23.9%, to £2.6 billion; largely as a result of increases in gross capital formation
Detailed time series for each of the expenditure and revenue component series of central government net borrowing are presented in Tables PSA6B to 6F in the Public Sector Finances Tables 1 to 10: Appendix A dataset.
In August 2016, local government net borrowing (LGNB) was estimated to be £1.9 billion; a decrease of £0.2 billion compared with August 2015.
Local government data for August 2016 are initial estimates based on detailed budget data for the financial year ending March 2017. Administrative source data are used for central government to local government transfers.
Detailed time series for each of the expenditure and revenue component series of local government net borrowing are presented in Tables PSA6G to 6K in the Public Sector Finances Tables 1 to 10: Appendix A dataset.
In August 2016, it was estimated that public corporations’ net borrowing (PCNB) was £0.1 billion, a decrease of £0.1 billion compared with August 2015.
Public corporations data for August 2016 are provisional estimates calculated by ONS based on OBR forecasts.
Back to table of contents5. The latest public sector net debt position
Public sector net debt excluding public sector banks (PSND ex) represents the amount of money the public sector owes to UK private sector organisations and overseas institutions, largely as a result of government financial liabilities on the bonds (gilts) and Treasury bills it has issued.
While deficit represents the difference between income and spending over a period of time, debt represents the total amount of money owed at a point in time. This debt has been built up by successive government administrations over many years. When the government borrows (that is, runs a deficit), this adds to the debt total. So reducing the deficit is not the same as reducing the debt.
At the end of August 2016, PSND ex stood at £1,621.5 billion; an increase of £52.0 billion compared with August 2015. This increase in net debt is a result of:
- £71.6 billion of public sector net borrowing
- plus £7.8 billion in timing differences between cash flows for gilt interest payments and the accrued gilt interest flows
- less £27.4 billion in net cash transactions related to acquisition or disposal of financial assets of equivalent value (for example loans) and timing of recording
Figure 5 illustrates public sector net debt excluding banking groups (PSND ex) from the financial year ending March 1994 to date.
Figure 5: Public sector net debt excluding public sector banks; the financial year ending 1994 to financial year ending 20171
UK, all data excluding public sector banks
Source: Office for National Statistics
Notes:
- Financial year 2016/17 represents financial year ending 2017 (April 2016 to March 2017).
Download this image Figure 5: Public sector net debt excluding public sector banks; the financial year ending 1994 to financial year ending 2017^1^
.png (34.7 kB) .xls (39.9 kB)
The increases in debt between the financial year ending March 2009 (April 2008 to March 2009) and the financial year ending March 2011 (April 2010 to March 2011) were larger than in the early part of the decade, as the economic downturn meant public sector net borrowing excluding public sector banks (PSNB ex) increased. Since then it has continued to increase but at a slower rate.
For the purposes of UK fiscal policy, net debt is defined as total gross financial liabilities less liquid financial assets, where liquid assets are cash and short-term assets which can be released for cash at short notice and without significant loss. These liquid assets mainly comprise foreign exchange reserves and bank deposits.
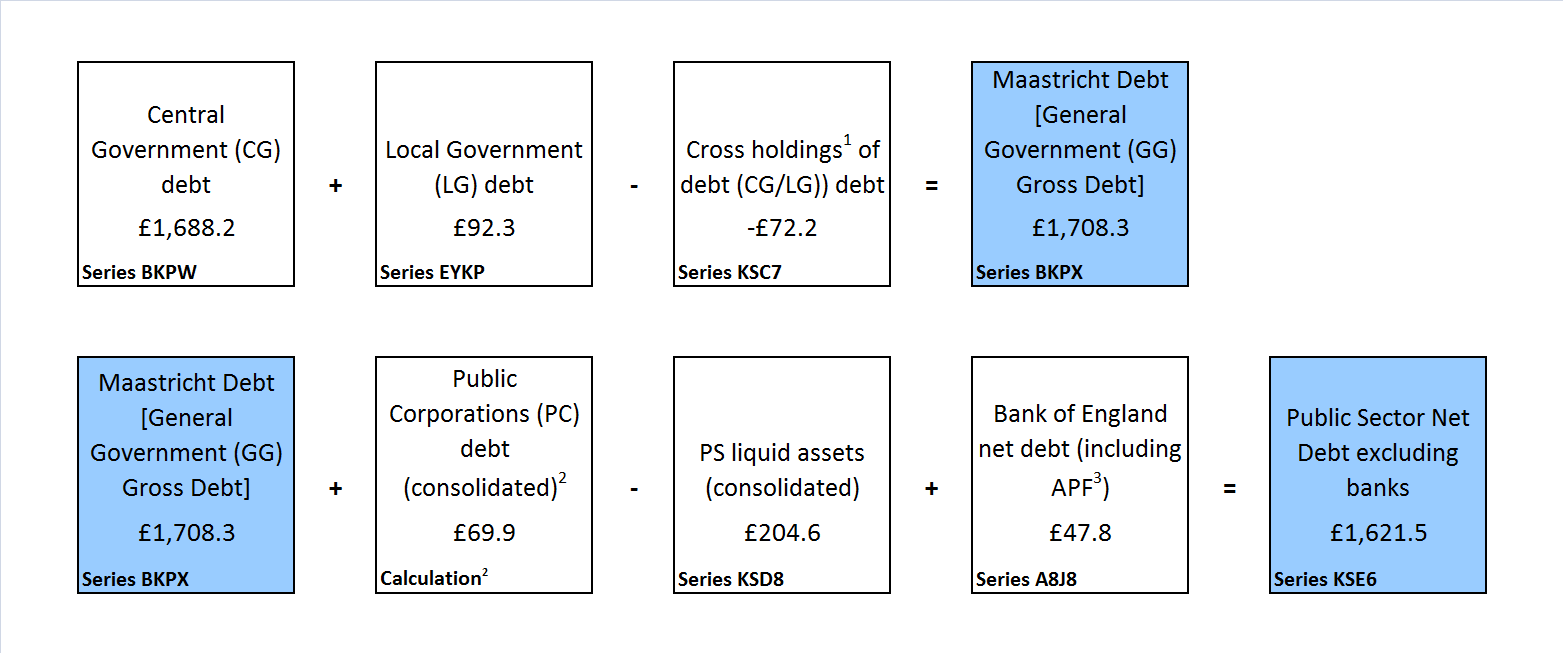
Figure 6 presents public sector debt (excluding public sector banks) at the end of August 2016 by sub-sector. Time series for each of these component series are presented in Tables PSA8A to D in the Public Sector Finances Tables 1 to 10: Appendix A dataset.
Figure 6: Sub-sector split of public sector net debt excluding public sector banks at August 2016 (£ billion)
Source: Office for National Statistics
Notes:
- Cross-holdings between sub-sectors are removed in calculating public sector net debt, gross debt and liquid assets.
- Public corporations' debt (consolidated) = non-financial PC gross debt (EYYD) less CG/NFPCs' gross debt (KSC8) less LG/NFPCs' cross holdings of debt (KSC9).
- APF - Bank of England Asset Purchase Facility.
Download this image Figure 6: Sub-sector split of public sector net debt excluding public sector banks at August 2016 (£ billion)
.png (49.9 kB) .xls (165.9 kB)
Changes in net debt between 2 points in time are normally similar to the net cash requirement for the intervening period, though the relationship is not an exact one because the net cash requirement reflects actual prices paid, while the net debt is at nominal prices. For instance, gilts are recorded in net debt at their redemption (or face) value, but they are often issued at a different price due to premia or discounts being applied. The net cash requirement will reflect the actual issuance and redemption prices, but net debt only ever records the face (or nominal) value.
Net cash requirement is discussed further in Section 8 of this bulletin.
Back to table of contents6. Net borrowing and debt statistics compared with OBR forecast
The Office for Budget Responsibility (OBR) normally produces forecasts of the public finances twice a year (normally in March and December). The latest OBR forecast was published on 16 March 2016.
Figure 7, Table 3 and Table 4 enable users to compare emerging data against the OBR forecasts. Caution should be taken when comparing public finance data with OBR figures for the full financial year, as data are not finalised until after the financial year ends. Initial estimates soon after the end of the financial year can be subject to sizeable revisions in later months. In addition, in-year timing effects on spending and receipts can affect year-to-date comparisons with previous years.
There can also be some methodological differences between OBR forecasts and outturn data. In its latest publication, OBR published a table within their Economic and Fiscal Outlook Supplementary Fiscal Tables – March 2016 titled “Table: 2.45 Items included in OBR forecasts that ONS have not yet included in outturn”.
Figure 7 illustrates the public sector net borrowing excluding public sector banks (PSNB ex) for the sixth provisional estimate of the complete financial year ending March 2016 (April 2015 to March 2016), along with the first provisional estimate of the current financial year-to-date (April to August 2016). These are not final figures and may be revised as provisional data are replaced with finalised and audited data.
Figure 7: Cumulative public sector net borrowing by month
UK, all data excluding public sector banks
Source: Office for National Statistics
Notes:
- 1 For the financial year ending 2016 (April 2015 to March 2016) and the financial year ending 2017 (April 2016 to March 2017).
- OBR full financial year forecast for public sector net borrowing excluding public sector banks from March 2016 Economic and Fiscal Outlook (EFO).
Download this chart Figure 7: Cumulative public sector net borrowing by month
Image .csv .xlsPublic sector net borrowing (excluding public sector banks) decreased by £18.9 billion to £76.5 billion in the financial year ending March 2016 (April 2015 to March 2016), compared with the previous financial year. By comparison, the OBR forecast for the financial year ending March 2016 (April 2015 to March 2016) was £72.2 billion which is £4.3 billion below the latest outturn estimate.
In the current financial year-to-date (April to August 2016), public sector net borrowing (excluding public sector banks) decreased by £4.9 billion to £33.8 billion compared with the same period in 2015.
OBR have estimated that the public sector will borrow £55.5 billion during the financial year ending March 2017 (April 2016 to March 2017); a reduction of £21.0 billion on the provisional outturn for the financial year ending March 2016 (April 2015 to March 2016).
Table 3 compares the year-to-date (April to August 2016) estimate of the main public sector fiscal aggregates with the same period in the previous financial year. It contrasts these data with the percentage change between the latest full year outturn data for the financial year ending March 2016 (April 2015 to March 2016) and the OBR forecast for the financial year ending March 2017 (April 2016 to March 2017), as published in March 2016.
Table 3: Public sector latest outturn estimates vs Office for Budget Responsibility (OBR) forecasts
| UK, excluding public sector banks | £ billion1 (not seasonally adjusted) | ||||||
| Financial year-to-date7 | Full financial year8 | ||||||
| 2016/178 | 2015/168 | Increase/Decrease % | 2016/17 OBR Forecast9 | 2015/16 Outturn | Forecast Increase/Decrease % | ||
| Current budget deficit2 | 22.9 | 28.2 | -18.9 | 19.1 | 43.1 | -55.7 | |
| Net investment3 | 10.9 | 10.5 | 4.3 | 36.4 | 33.4 | 9.0 | |
| Net borrowing 4 | 33.8 | 38.7 | -12.7 | 55.5 | 76.5 | -27.4 | |
| Net debt 5 | 1,621.5 | 1,569.5 | 3.3 | 1,638.0 | 1,602.3 | 2.2 | |
| Net debt as a percentage of GDP6 | 83.6 | 83.6 | NA | 82.6 | 84.2 | NA | |
| Source: Office for National Statistics | |||||||
| Notes: | |||||||
| 1. Unless otherwise stated. | |||||||
| 2. Current budget deficit is the difference between current expenditure (including depreciation) and current receipts. | |||||||
| 3. Net investment is gross investment (net capital formation plus net capital transfers) less depreciation. | |||||||
| 4. Net borrowing is current budget deficit plus net investment. | |||||||
| 5. Net debt is financial liabilities (for loans, deposits, currency and debt securities) less liquid assets. | |||||||
| 6. GDP at current market price. | |||||||
| 7. Financial year-to-date refers to the period from April to August. | |||||||
| 8. 2016/17 refers to financial year ending in March 2017 and 2015/16 refers to financial year ending in March 2016. | |||||||
| 9. All OBR figures are from the OBR Economic and Fiscal Outlook published in March 2016. | |||||||
Download this table Table 3: Public sector latest outturn estimates vs Office for Budget Responsibility (OBR) forecasts
.xls (34.3 kB)Table 4 presents the sixth provisional estimate of public sector net borrowing split by sub-sector for the complete financial year ending March 2016 (April 2015 to March 2016) along with the corresponding OBR forecast; published in Table 2.38 (General government transactions by economic category) of the Economic and Fiscal Outlook Supplementary Fiscal Tables - March 2016.
Table 4: Public sector provisional net borrowing estimates vs OBR forecasts
| UK, excluding public sector banks | £ billion (not seasonally adjusted) | ||||
| Full financial year 2015/161 | |||||
| ONS | OBR | Difference | |||
| Central government | 70.6 | 69.3 | 1.3 | ||
| Local government | 6.1 | 3.8 | 2.3 | ||
| Public corporations2 | -0.2 | -1.0 | 0.8 | ||
| Public sector | 76.5 | 72.2 | 4.3 | ||
| Source: Office for National Statistics (ONS) and The Office of Budget Responsibility (OBR) | |||||
| Notes: | |||||
| 1. Full financial year ending 2016 (April 2015 to March 2016) | |||||
| 2. Includes Bank of England | |||||
Download this table Table 4: Public sector provisional net borrowing estimates vs OBR forecasts
.xls (27.1 kB)On the same day as this bulletin is released, the OBR publishes a commentary on the latest figures and how these reflect on its forecasts. The OBR provides this commentary to help users interpret the differences between the latest outturn data and the OBR forecasts by providing contextual information about assumptions made during the OBR’s forecasting process.
Back to table of contents7. International comparisons of borrowing and debt
The UK government debt and deficit for Eurostat statistical bulletin is published quarterly (in January, April, July and November each year), to coincide with when the UK and other European Union member states are required to report on their deficit (or net borrowing) and debt to the European Commission.
On 15 July 2016, we published the latest UK Government Debt and Deficit for Eurostat statistical bulletin: The data used to produce the 15 July 2016 publication are consistent with those used in the production of the public sector finances statistical bulletin published on 21 June 2016.
In the publication of 15 July 2016 we reported that:
- general government deficit (Maastricht borrowing) in the financial year ending March 2016 (April 2015 to March 2016) was £74.5 billion, equivalent to 4.0% of GDP; a decrease of £16.2 billion compared with the financial year ending March 2015
- general government gross debt (Maastricht debt) at the end of March 2016 was £1,649.2 billion, equivalent to 87.7% of GDP; an increase of £47.5 billion compared with the end of the financial year ending March 2015
The latest public sector finances data in this bulletin report that:
- general government net borrowing in the financial year ending March 2016 (April 2015 to March 2016) was £76.6 billion, equivalent to 4.1% of GDP; an upward revision of £2.1 billion since the 15 July 2016 publication
- general government gross debt at the end of March 2016 was £1,651.9 billion, equivalent to 87.9% of GDP, an upward revision of £2.7 billion or 0.2 percentage point of GDP since the 15 July 2016 publication
It is important to note that the GDP measure, used as the denominator in the calculation of the debt ratios in the UK government debt and deficit for Eurostat statistical bulletin, differs from that used within the public sector finances statistical bulletin.
An article, The use of GDP in public sector fiscal ratio statistics explains that for debt figures reported in the monthly public sector finances, a 12 month GDP total centred on the month is employed, while in the UK government debt and deficit for Eurostat statistical bulletin the total GDP for the preceding 12 months is used.
Back to table of contents8. Public sector net cash requirement
Net cash requirement is a measure of how much cash the government needs to borrow (or lend) to balance its accounts. In very broad terms, net cash requirement equates to the change in the level of debt.
Central government net cash requirement is reconciled against the change in central government net debt in Table REC3 in the Public Sector Finances Tables 1 to 10: Appendix A dataset.
The public sector net cash requirement excluding public sector banks (PSNCR ex) follows a similar trend to that of public sector net borrowing by peaking in the financial year ending March 2010, though in recent years transfers from the Asset Purchase Facility have had a substantial impact on PSNCR ex but are PSNB ex neutral.
PSNCR ex in the current financial year-to-date (April to August 2016) was £13.3 billion; £6.2 billion, or 31.9% lower than in the same period in 2015.
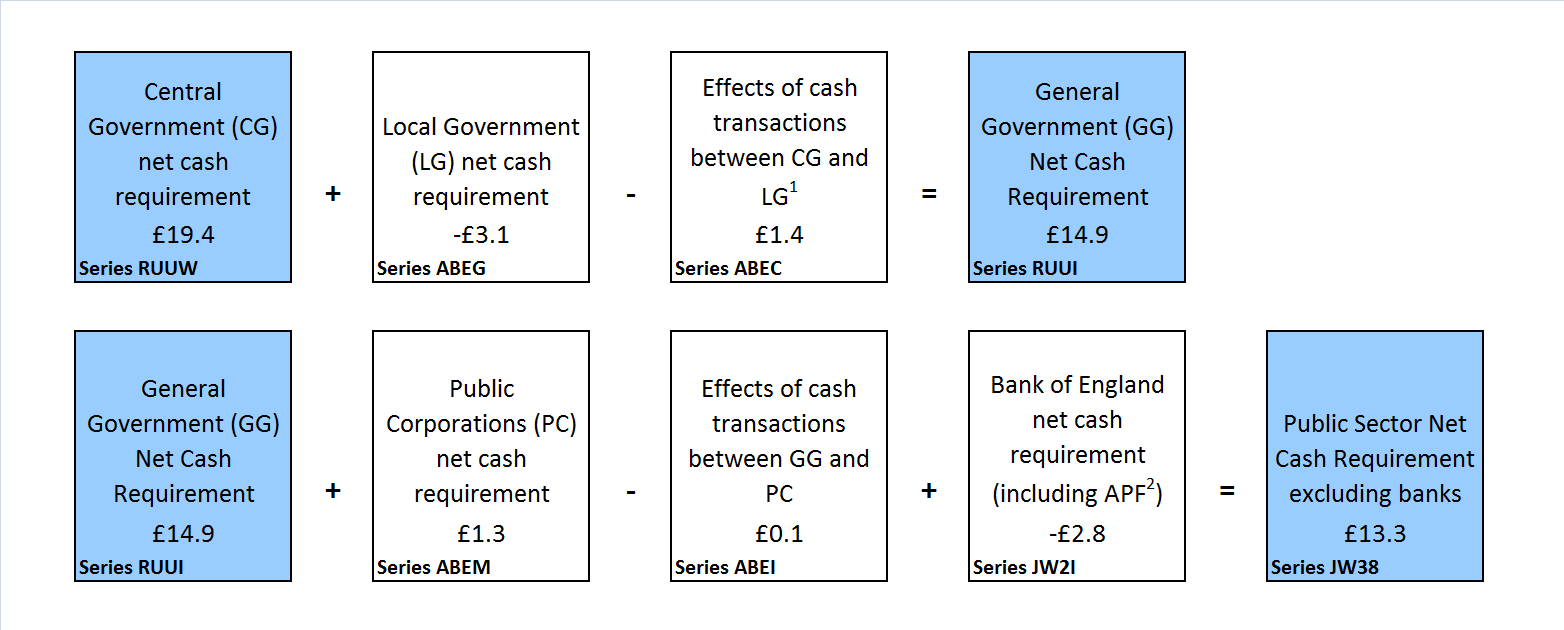
Figure 8 presents public sector cash requirement by sub-sector for the financial year-to-date (April to August 2016). Time series for each of these component series are presented in Table PSA7A in the Public Sector Finances Tables 1 to 10: Appendix A dataset.
Figure 8: Sub-sector split of public sector net cash requirement excluding public sector banks, financial year to date (April to August) ending 2017 (£ billion)
UK, all data excluding public sector banks
Source: Office for National Statistics
Notes:
- Effects of cash transactions between sub-sectors are removed in calculating public sector total net cash requirement (and consolidated expenditure and income totals).
- APF - Bank of England Asset Purchase Facility.
Download this image Figure 8: Sub-sector split of public sector net cash requirement excluding public sector banks, financial year to date (April to August) ending 2017 (£ billion)
.png (48.4 kB) .xls (152.6 kB)
Central government net cash requirement (CGNCR) is a focus for some users, as it provides an indication of how many gilts (government bonds) the Debt Management Office may issue to meet the government’s borrowing requirements.
In the current financial year-to-date (April to August 2016), CGNCR was £19.4 billion; £7.1 billion, or 26.7% lower than in the same period in 2015.
Cash transfers from the Asset Purchase Facility (APF) were £0.6 billion higher in the current financial year-to-date (April to August 2016), than in the same period in the previous financial year-to-date. Without the impact of these transfers, CGNCR would have been £6.4 billion lower in the current financial year-to-date than in the same period in the previous year.
Recent events impacting on CGNCR
For the current financial year, ending March 2017 (April 2016 to March 2017) the following event has reduced the CGNCR to date:
- the transfers between the Bank of England Asset Purchase Facility Fund (BEAPFF) and central government
In the financial year ending March 2016 (April 2015 to March 2016) the following events reduced the CGNCR:
- the transfers between the Bank of England Asset Purchase Facility Fund (BEAPFF) and central government
- the sale of shares in Lloyds Banking Group
- the sale of shares in Eurostar
- the sale of shares in Royal Mail
- the sale of shares in Royal Bank of Scotland
- the sale of UK Asset Resolution Limited (UKAR) assets
- the re-imbursement of support payments made to Icesave
In the financial year ending March 2015 (April 2014 to March 2015) the following events reduced the CGNCR:
- the transfers between the BEAPFF and central government
- the sale of shares in Lloyds Banking Group
In the financial year ending March 2014 (April 2013 to March 2014) the following events reduced the CGNCR:
- the transfers between the BEAPFF and central government
- the sale of shares in Lloyds Banking Group
- the sale of shares in Royal Mail
In the financial year ending March 2013 (April 2012 to March 2013) the following events reduced the CGNCR:
- the transfers between the BEAPFF and central government
- the Royal Mail Pension Plan transfer and subsequent sale of assets
- the transfer of the Special Liquidity Scheme final profits between Bank of England and central government
- the 4G Spectrum sale
Public sector net cash requirement
Although the central government net cash requirement is the largest part of the public sector net cash requirement excluding public sector banks (PSNCR ex), the total public sector net cash requirement (PSNCR) can be very different. The reason is that the PSNCR includes the net cash requirement of the public sector banking groups. In recent years, the public sector banking groups have recorded large cash surpluses which have had a substantial impact on the public sector net cash requirement.
Back to table of contents9. Central government receipts and expenditure
Current receipts
The government receives income mainly from taxes but also from National Insurance contributions, interest and dividends, fines and rent.
As cash receipts are generally accrued back to earlier periods when the economic activity took place, the first monthly estimate for receipts is by nature provisional, and must include a substantial amount of forecast data.
Central government receipts follow a strong cyclical pattern over the year, with high receipts in April, July, October and January due to quarterly Corporation Tax returns being accrued to these months.
In both January and July (to a lesser extent) accrued receipts are particularly high due to receipts from quarterly Corporation Tax combining with those from Income Tax self-assessment. The revenue raised through Income Tax self-assessment, as well as primarily affecting January and July receipts, also tends to lead to high receipts in the following month (March and November respectively), although to a lesser degree.
Pay as you earn (PAYE) tends to vary little throughout the financial year on a monthly basis (excluding bonus months).
In recent years transfers from both the Bank of England Asset Purchase Facility Fund (BEAPFF) and the Special Liquidity Scheme (SLS) have boosted central government receipts. These transfers to central government have no impact on public sector borrowing due to the central government receipts being offset by the payments from the Bank of England.
Current expenditure
Current expenditure is the government’s spending on activities such as: social benefits (mainly pension payments), interest payments and other current expenditure including government departmental spending (excluding spending on capital assets).
Trends in central government current expenditure can be affected by monthly changes in debt interest payments, which can be volatile as they depend on the movements in the Retail Prices Index. Excluding debt interest makes this statistic less volatile.
There is however one regular peak in net social benefits, which are higher in November than in other months due to the annual payment of the winter fuel allowance.
Year-on-year growth in net social benefits is affected by the uprating of benefits to compensate for inflation based on the Consumer Prices Index (CPI).
For recent years these are: 2.7% in the financial year ending March 2015; 1.2% in the financial year ending March 2016 and -0.1% for the financial year ending March 2017 (meaning that the rates have remained frozen). These apply to benefits for pensioners (apart from the State Pension). Most benefits for people of working age are frozen for the financial year ending March 2017.
However, for State Pensions, the largest component within net social benefits, there is a “triple guarantee” that means that they are uprated by the highest of the CPI, increases in earnings or 2.5%. For the financial year ending March 2017, they were uprated by the rise in annual earnings which was 2.9%.
It can be difficult to compare the profile of monthly central government expenditure even when excluding both debt interest and net social benefits.
For the 4 years since the financial year ending March 2014, there have been continual changes to the profile of central government grants to local government.
In the financial year ending March 2016, the Revenue Support Grant (the main general grant paid to local authorities in England) was paid with a third of the total in April and the remainder in equal instalments in all the other months, whereas, in the financial year ending March 2015, more than half of it was paid in April with the bulk of the remaining balance paid in February and March. This financial year (ending March 2017) the monthly pattern of grants has changed again and is much flatter ¬¬– with 10% being paid in April and the remainder flat though the year. The overall level is also lower than last year.
Current budget deficit
The gap between current expenditure and current receipts (having taken account of depreciation) is referred to as the current budget. When current expenditure is greater than current receipts (income), the public sector runs a current budget deficit.
In August 2016, the central government current budget deficit was £7.0 billion, a decrease of £0.9 billion, or 11.5% compared with August 2015.
The central government current budget deficit in the current financial year-to-date (April to August 2016) was £21.0 billion; which was £8.3 billion, or 28.3% lower than in the same period in 2015.
Figure 9 illustrates that the central government current budget deficit (as a percentage of GDP) has reduced since the financial year ending March 2010 (April 2009 to March 2010), but is still larger than before the global financial shock.
Figure 9: Central government receipts, expenditure and current budget deficit1 as a percentage of GDP by financial year; the financial year ending 1994 to the financial year ending 20162
UK, all data excluding public sector banks
Source: Office for National Statistics
Notes:
- Current budget deficit is receipts minus expenditure but also includes the effects of depreciation.
- Financial year 2015/16 represents the financial year ending 2016 (April 2015 to March 2016).
Download this chart Figure 9: Central government receipts, expenditure and current budget deficit^1^ as a percentage of GDP by financial year; the financial year ending 1994 to the financial year ending 2016^2^
Image .csv .xlsIn recent years the current budget has been in deficit in most months. January and July tend to be surplus months as these are the 2 months with the highest receipts.
Net investment
Net investment represents the government’s spending on capital assets, like infrastructure projects, property and IT equipment, both as grants and by public sector bodies themselves minus capital receipts from the sale of capital assets.
In the financial year-to-date (April to August 2016), central government’s net investment was £14.2 billion. This represents an increase of £1.5 billion, or 11.8%, on the same period in the previous year and is largely due to a decrease in capital transfers to central government from other sectors.
Central government net investment is difficult to predict in terms of its monthly profile as it includes some large capital grants (such as those to local authorities and education institutions) and can include some large capital acquisitions or disposals, all of which vary from year to year. Net investment in the last quarter of the financial year is usually markedly higher than that in the previous 3 quarters.
Central government net investment includes the direct acquisition minus disposal of capital assets (such as buildings, vehicles, computing infrastructure) by central government. It also includes capital grants to and from the private sector and other parts of the public sector. Capital grants are varied in nature and cover payments made to assist in the acquisition of a capital asset, payments made as a result of the disposal of a capital asset, transfers in ownership of a capital asset and the unreciprocated cancellation of a liability (that is conceding a debt will not be repaid).
The sum of net investment (spending on capital less capital receipts) and the current budget deficit constitute net borrowing.
Back to table of contents10. Recent events and forthcoming methodological changes
Classification decisions
Each quarter we publish a forward workplan outlining the classification assessments we expect to undertake over the coming 12 months. To supplement this, each month a classifications update is published which announces classification decisions made, and includes expected implementation points (for different statistics) where possible.
Classification decisions are reflected in the public sector finances at the first available opportunity and, where necessary outlined in this section of the statistical bulletin.
Bank of England Asset Purchase Facility Fund (BEAPFF)
The BEAPFF (often abbreviated to APF) currently holds government securities (gilts) on which it earns interest, and pays interest on the reserves created by the Bank of England to finance it. These interest flows are reflected in both the public sector net cash requirement (PSNCR ex) and the public sector net borrowing (PSNB ex) although the interest received on gilts is internal to the public sector whereas the financing interest paid external. In addition to these interest flows there are regular transfers of excess cash in the APF to the Exchequer. These flows are internal to the public sector and so do not affect PSNB ex.
In August 2016, there were no transfers from the BEAPFF to HM Treasury, bringing the total money transferred to HM Treasury under the APF scheme to £5.0 billion in this financial year-to-date (April to August 2016).
The Bank of England entrepreneurial income for the financial year ending March 2016 (April 2015 to March 2016) was calculated as £11.9 billion. This is the total amount of dividend transfers that can impact on central government net borrowing in the financial year ending March 2017 (April 2016 to March 2017).
The net liabilities of the APF increase public sector net debt (PSND ex) as shown in Table 8D in the Public Sector Finances Tables 1 to 10: Appendix A dataset.
The treatment of the recently announced Monetary Policy Committee economic package in public sector finances statistics
On 3 August 2016, the Monetary Policy Committee (MPC) voted to introduce a package of measures to support the economy. This package comprised:
- a 25 basis point cut in Bank Rate to 0.25%
- a new Term Funding Scheme to reinforce the pass-through of the cut in Bank Rate
- the purchase of up to £10 billion of UK corporate bonds
- an expansion of the asset purchase scheme for UK government bonds of £60 billion
The £60 billion expansion of the APF will take the total stock of government bond purchases to £435 billion. On top of this, the APF may purchase up to £10 billion of corporate bonds. The flows and liabilities related to the government bonds will be recorded in the same way as for the existing bond holdings with the impact on public sector net debt being limited to the difference between the purchase price of the bonds and their face value. However, any private sector corporate bonds purchased will lead to an increase in public sector net debt equal to the total purchase price of the bonds as the bonds are not liabilities of the public sector.
For more detail of transactions relating to the Asset Purchase Facility, see Table PSA9 in the Public Sector Finances Tables 1 to 10: Appendix A dataset.
We are currently considering the correct statistical treatment of the transactions, assets and liabilities of the Term Funding Scheme, in accordance with international statistical rules and the principles laid down during the 2013 PSF Review. We will announce the methodological treatment to be applied to the Term Funding Scheme in next month’s bulletin.
Housing associations
The reclassification of English private registered providers of social housing (referred to in this bulletin as housing associations) from the private to the public corporation sector was reflected in public sector finances for the first time in the January 2016 statistical bulletin. This reclassification, announced on 30 October 2015, affects over 1,500 bodies providing social housing and applies back to July 2008 when the controls in the Housing and Regeneration Act 2008 came into force.
It is important to realise that current estimates of the impact of the reclassification of housing associations are preliminary estimates which may be updated when new data become available or methodological improvements are made. At present, we are actively seeking alternative data sources to investigate the impact of smaller providers on net borrowing, net cash requirement and net debt.
We are also doing further work to test the assumptions that have been made in compiling the estimates. These were:
- all housing association debt is assumed to be held by the private sector – the Quarterly Survey of Private Registered Providers for March 2015 showed that banks, building societies and capital markets contributed 99% to agreed sources of funding
- the Global Accounts are collected for the entire financial year – monthly transactions were estimated by dividing the financial year figure by 12
- providers which own less than 250 properties (less than 2% of the total stock) are assumed to have no net debt and not be investing in new properties
- providers owning or managing between 250 and 1,000 properties are assumed to have the same gross debt per 1,000 properties as those owning or managing between 1,000 and 2,500 homes
- the relative impact of small providers on the accounts is assumed to be constant between financial year ending March 2009 and financial year ending March 2015
This reclassification has been introduced in public sector finances before implementation in the Quarterly National Accounts and Blue Book publications. Any work to improve the methods and data sources used in these estimates will be reflected in the National Accounts publications at the time the reclassification is implemented.
Back to table of contents11. Revisions since previous bulletin
In publishing monthly estimates, it is necessary that a range of different types of data sources are used. A summary of the different sources used and the implications this has for data revisions is provided in the document Sources summary and their timing.
The Public Sector Finances Revision Policy provides information of when users of the statistics published in the public sector finances and UK government debt and deficit for Eurosts statistical bulletins should expect to see methodological and data related revisions.
More detail of the methodology and sources employed can be found in the Public Sector Finances Methodological Guide.
Revisions tend to be the result of both updated data sources and methodology changes. This month the reported revisions are largely the result of methodology changes, though in recent periods a proportion of revisions are attributed to updated data sources.
Table 6 summarises revisions between the data contained in this bulletin and the previous publication.
Changes to methodology introduced in this bulletin
This bulletin introduces methodology changes in 3 broad areas:
- changes to central government debt calculations as a result of the work done by Office for National Statistics (ONS) and HM Treasury to understand and itemise the non-cash drivers to net debt
- changes to public sector fiscal measure ratios as a percentage of GDP as a result of a new method for estimating GDP in periods where no outturn data are yet available
- changes to local government net cash requirement data as a result of improvements made to the method used for estimating monthly local government cash data
Methodological changes to net debt
In December 2014, we introduced a new table (REC3), as an Experimental Statistic, showing the relationship between central government net cash requirement and central government net debt.
We improved the detail of this table in June 2015, but advised you that the ONS and HM Treasury were continuing to work together to fully understand the data sources feeding into the central government net cash requirement and net debt so as to provide you with clarity on non-cash drivers to net debt and as a quality assurance tool for the monthly production of this bulletin.
This work has now reached a conclusion and a new and more detailed reconciliation table between central government net cash requirement and central government net debt can be found in this bulletin (REC3 Reconciliation of Central Government Net Cash Requirement and Changes in Net Debt).
This investigative work identified a number of changes that needed to be made to estimates of central government gross debt and public sector net debt (both PSND and PSND ex). These changes have been made in this bulletin and are:
- inclusion of bonds issued by London and Continental Railways, now held by Department for Transport; which were missing from central government net debt but partially included (wrongly) in public corporations’ net debt
- inclusion of all repurchase agreements (repos) between the official reserves and overseas institutions as well as non-bank UK institutions; as previously only some of the liabilities relating to repos had been included in net debt
- adjustments to National Savings and Investments (NS&I) outstanding balances to remove any liabilities that had not crystallised at the end of the reporting period; as previously some liabilities which crystallised in the days immediately following the reporting month were being included in net debt
- inclusion in recent periods of some imputed finance leases for on-balance sheet public-private partnerships that had previously been missing
Table 5 provides information on the magnitude of the impact of each of the above improvements on the estimates of central government net debt.
In last month’s bulletin we provided provisional indications of the impact we expected the implementation of these methodological changes to have on net debt. These indicative figures have changed during the process of implementation and quality assurance so that the final revisions reported here are lower than those initial estimates provided.
Table 5: Revisions to central government gross debt
| UK | £ million | |||||
| End of period | Revision to central government gross debt (BKPW) | of which | ||||
| National Savings | Official Reserves | London Continental Railway | Financial Leases | Other | ||
| 1997/98 | -1 | 0 | 0 | 0 | 0 | -1 |
| 1998/99 | 2,650 | 0 | 0 | 2,650 | 0 | 0 |
| 1999/00 | 3,066 | 0 | 231 | 2,835 | 0 | 0 |
| 2000/01 | 3,477 | 0 | 355 | 3,122 | 0 | 0 |
| 2001/02 | 3,110 | 0 | -240 | 3,350 | 0 | 0 |
| 2002/03 | 5,723 | 0 | 1,048 | 4,675 | 0 | 0 |
| 2003/04 | 1,749 | 0 | 585 | 1,164 | 0 | 0 |
| 2004/05 | 2,184 | 0 | 1,107 | 1,077 | 0 | 0 |
| 2005/06 | -195 | -1,412 | 403 | 814 | 0 | 0 |
| 2006/07 | -1,155 | -1,557 | -412 | 814 | 0 | 0 |
| 2007/08 | -2,527 | -1,567 | 728 | -1,688 | 0 | 0 |
| 2008/09 | -1,503 | -756 | 955 | -1,702 | 0 | 0 |
| 2009/10 | 2,640 | -860 | -250 | 3,750 | 0 | 0 |
| 2010/11 | 1,848 | -1,113 | 211 | 2,750 | 0 | 0 |
| 2011/12 | 3,977 | -858 | 2,085 | 2,750 | 0 | 0 |
| 2012/13 | 4,820 | -536 | 2,606 | 2,750 | 0 | 0 |
| 2013/14 | 1,083 | -916 | -751 | 2,750 | 0 | 0 |
| 2014/15 | 2,316 | -332 | -101 | 2,750 | 0 | -1 |
| 2015/16 | 2,408 | -591 | -251 | 2,750 | 498 | 2 |
| April 2016 | 7,300 | -556 | 4,608 | 2,750 | 498 | 0 |
| May 2016 | 4,655 | -574 | 1,981 | 2,750 | 498 | 0 |
| June 2016 | 4,936 | -609 | 2,297 | 2,750 | 498 | 0 |
| July 2016 | 8,212 | -608 | 5,572 | 2,750 | 498 | 0 |
| Source: Office for National Statistics | ||||||
Download this table Table 5: Revisions to central government gross debt
.xls (28.7 kB)Methodological changes to net debt and borrowing as a percentage of GDP
Following our user consultation concerning the use of public sector fiscal statistics presented as ratios of gross domestic product (GDP), this month we have introduced a minor methodological change to the way we estimate GDP for periods where GDP has not yet been published.
This methodology change is to move from the current method of using forecasted annual growth rates published by the Office for Budget Responsibility (OBR) to using OBR’s forecasted quarterly growth rates.
In principle the methodological change applies to any fiscal statistics in the bulletin presented as a percentage of GDP. However, in practice the only revisions in this bulletin are to public sector net debt as a percentage of GDP as this uses a centred GDP which requires GDP estimates for periods where GDP has not yet been published. Net borrowing as a percentage of GDP uses GDP estimates for the period of time to which the borrowing relates and GDP outturn estimates are available for the latest year (financial year ending March 2016) for which we publish net borrowing as a percentage of GDP.
The new methodology is described in detail in a methodology paper titled The use of GDP in public sector fiscal ratio statistics published on 21 September 2016.
Methodological changes to local government cash data
We have been working with the Department for Communities and Local Government to review the methodology used to calculate local government net cash requirement (LGNCR).
The local government cash data are collected from all local authorities in the UK on a quarterly basis and from a sample of local authorities on a monthly basis. The outcome of the review is a new method for calculating many of the component series, which makes better use of the available data at any given point in time.
As previously announced, we are introducing this new method in the August 2016 bulletin with revisions applying from April 2012 onwards.
The impact of the methodological change, in the financial year ending March 2016, has been to revise LGNCR upwards by £0.7 billion, however the total impact was less than £0.1 billion for the 3 financial years affected prior to that.
Other methodological changes
In addition to the above changes, the investigative work into the reconciliation between central government net cash requirement and central government net debt identified changes required to the implementation of the reclassification of London and Continental Railways which impact not on net debt but on net borrowing.
These changes lead to revisions to central government current expenditure within interest payable, interest receivable and subsidies, and revisions to central government capital expenditure within capital transfers from central government.
These changes are largely, but not entirely, offset by equal and opposite changes in the public corporations’ accounts.
More information is published on our website on the 2009 reclassification of London and Continental Railways (LCR) from the public corporations subsector to the central government subsector.
Revisions to Public sector net borrowing excluding public sector banks (PSNB ex)
Each quarter (March, June, September and December) public sector finance data are aligned to the data reported in the UK government debt and deficit for Eurostat statistical bulletin to take advantage of the more detailed quarterly data underpinning the latter publication (see background note 12 for further details).
As a result of this alignment process, this month we report revisions to PSNB ex extending back to the financial year ending March 2005.
Table 6 summarises revisions between the data contained in this bulletin and the previous publication.
Revisions to PSNB ex in the current financial year-to-date (April to July 2016)
The provisional estimate of PSNB ex in the current financial year-to-date has been revised down by £0.5 billion as a result of a £1.1 billion decrease in central government borrowing, partially offset by a £0.7 billion increase in local government net borrowing. In addition, estimates of public corporations' net borrowing have been revised down by £0.1 billion over the same period.
Central government net borrowing
Over April to July 2016, estimates of the central government current receipts (including taxes) were collectively revised up by £1.2 billion. Of this, estimates of VAT, social contributions (National Insurance) and Income Tax interest were increased by increased by £0.7 billion, £0.5 billion and £0.3 billion respectively; while interest & divided receipts were revised downward by £0.5 billion.
Over the same period, estimates of current expenditure have been revised down by £0.1 billion, almost entirely due to decreases across the “other current expenditure” category.
The downward revisions to both receipts and expenditure meant that the current budget deficit in the financial year-to-date was reduced by £1.4 billion.
Upward revisions to capital transfers to central government from other sectors of £0.4 billion were partially offset by downward revisions of gross capital formation of £0.2 billion, resulting in an increase of £0.3 billion to the estimate of net investment.
An increase of £1.4 billion in the current account combined with the £0.3 billion increase in the capital account meant that central government net borrowing in the financial year-to-date was reduced by £1.1 billion compared with the previous estimate published on 19 August 2016.
Public corporations' net borrowing
In the current financial year-to-date (April to July 2016), public corporations' net borrowing (PCNB) was revised down by £0.1 billion.
Estimates of gross operating surplus (in the current account), along with gross fixed capital formation and capital transfers from local government to public corporations (in the capital account) have been replaced by revised estimates.
Local government net borrowing
In the current financial year-to-date (April to July 2016), local government net borrowing (LGNB) was revised up by £0.7 billion. This revision is spread across a few components and is due to updated source data.
Detailed budget data have now been incorporated into the estimation of LGNB, replacing estimates that were previously based on forecasts produced by the Office for Budget Responsibility in March 2016.
Additionally provisional estimates of both capital and current transfers from central to local government being replaced by revised estimates.
Revisions to PSNB ex in financial year ending March 2016
Many of the methodological changes introduced this month are largely offsetting between the central government and public corporations’ accounts and in most cases do not impact net borrowing at the public sector level.
In the financial year ending March 2016, CGNB was revised upwards by £0.1 billion, however, LGNB was revised down by £1.6 billion and PCNB was revised downwards by £0.6 billion.
Revisions to local government net borrowing are spread across a few components and are due to updated source data.
Local government current expenditure on goods and services was revised up by £1.7 billion. This is due to replacing previous budget estimates with provisional outturn data.
The local government components for gross capital formation and subsidies were each revised up by £0.6 billion. In both cases, this is due to updated source data, specifically the final outturn data for capital expenditure in England and provisional outturn data in Scotland.
Grants received by local authorities have been revised up, which offsets the effect of the revisions described above. Again, this is due to updated source data. There are smaller revisions in other components.
Revisions to public corporations’ borrowing are spread across a few components and are due to updated source data. Current receipts increased by £0.3 billion, largely due to an increase in the estimate of gross operating surplus of £0.6 billion partially offset by a decrease in the estimate of interest and dividends (net) from public sector of £0.3 billion. In the same period the estimate of net investment fell by £0.3 billion. This increase in current receipts and decrease in capital expenditure led to a £0.6 billion decrease in the estimate of PCND in the financial year ending March 2016.
Revisions to PSNB ex in the financial year ending March 2015
Finalised outturn data from central government departments covering the financial years ending March 2015 has been incorporated into this month’s publication. In the central government account “other current expenditure” has increased by £1.2 billion (largely as a result of final consumption expenditure increasing by £1.8 billion), while net investment has increased by £1.8 billion (largely as a result of gross fixed capital formation increasing by £2.3 billion).
In the financial year ending March 2015, LGNB was revised up by £0.7 billion, largely due to updated data for central government grants paid to local authorities.
Revisions to PSNB ex in earlier financial years
Between the financial years ending March 2000 and March 2014, there are revisions to central government and public corporations’ net borrowing. These revisions are almost entirely due to the methodological revisions for London and Continental Railway described earlier in this section. In most years these revisions offset, but in the financial years ending March 2005 to March 2008 they do not offset and PSNB ex has been revised downward by £0.2 billion, £0.6 billion, £0.5 billion and £0.4 billion respectively.
Public sector net debt excluding public sector banks (PSND ex)
PSND ex shows revisions back to 1999. PSND ex at the end of July 2016 was revised upward by £9.0 billion. Of this revision £8.2 billion was the result of the methodology improvements to central government gross debt described earlier in this section and £0.8 billion as a result of updated data sources.
PSND ex at the end of March 2016 was revised upward by £1.5 billion. The methodology improvements to central government gross debt account for an upward revision of £2.4 billion, which has been offset by a £0.3 billion upward revision to liquid assets and a £0.6 billion downward revision to public corporations’ gross debt.
Public sector net cash requirement excluding public sector banks (PSNCR ex)
In the current financial year-to-date (April to July 2016), PSNCR ex was revised down by £3.4 billion. Of this, central government net cash requirement was revised down by £3.6 billion due to the inclusion of new Network Rail data replacing previous forecasts, partially offset by an increase of £0.3 billion in local government cash data as a result of the methodological improvements described earlier in this section.
The changes to the treatment of National Savings and Investments (NS&I) data have resulted in revisions to public corporations’ net cash requirement (PCNCR). These changes extend back to the financial year ending March 2006 and range between a fall of £1.4 billion in the financial year ending March 2006 to an increase of £0.8 billion in the financial year ending March 2009. Between the financial year ending March 2006 and the financial year ending March 2016, the total impact on PCNCR was a fall of £1.2 billion.
Table 6: Revisions between this bulletin and the previous bulletin
| UK, previous bulletin refers to the PSF bulletin published on 19 August 2016 | ||||||||
| £ billion1 (not seasonally adjusted) | ||||||||
| Net Borrowing | ||||||||
| Period | CG2 | LG3 | NFPCs4 | BoE5 | PSNB ex6 | PSND ex7 | PSND % of GDP | PSNCR ex8 |
| 1997/98 | 0.0 | 0.0 | 0.0 | 0.0 | 0.0 | 0.0 | 0.0 | 0.0 |
| 1998/99 | 0.0 | 0.0 | 0.0 | 0.0 | 0.0 | 0.0 | 0.0 | 0.0 |
| 1999/00 | 0.0 | 0.0 | -0.1 | 0.0 | 0.0 | 0.2 | 0.0 | 0.0 |
| 2000/01 | 0.0 | 0.0 | 0.0 | 0.0 | 0.0 | 0.3 | 0.0 | 0.0 |
| 2001/02 | -0.3 | 0.0 | 0.3 | 0.0 | 0.0 | -0.2 | 0.0 | 0.0 |
| 2002/03 | -0.3 | 0.0 | 0.3 | 0.0 | 0.0 | 1.0 | 0.1 | 0.0 |
| 2003/04 | -0.2 | 0.0 | 0.2 | 0.0 | 0.0 | -3.2 | -0.2 | 0.0 |
| 2004/05 | -0.2 | 0.0 | 0.0 | 0.0 | -0.2 | -2.7 | -0.2 | 0.0 |
| 2005/06 | -1.1 | 0.0 | 0.6 | 0.0 | -0.6 | -4.8 | -0.3 | -1.4 |
| 2006/07 | -0.7 | 0.0 | 0.2 | 0.0 | -0.5 | -5.7 | -0.4 | -0.2 |
| 2007/08 | 0.2 | 0.0 | -0.6 | 0.0 | -0.4 | -7.1 | -0.5 | 0.0 |
| 2008/09 | 0.2 | 0.0 | -0.1 | 0.0 | 0.1 | -6.1 | -0.4 | 0.8 |
| 2009/10 | -3.9 | 0.0 | 3.9 | 0.0 | 0.1 | 2.6 | 0.2 | -0.1 |
| 2010/11 | 0.2 | 0.0 | -0.3 | 0.0 | -0.1 | 1.8 | 0.1 | -0.2 |
| 2011/12 | 0.2 | 0.0 | -0.2 | 0.0 | -0.1 | 4.0 | 0.3 | 0.3 |
| 2012/13 | 0.2 | 0.0 | -0.1 | 0.0 | 0.2 | 4.8 | 0.3 | 0.3 |
| 2013/14 | 0.1 | 0.0 | -0.1 | 0.0 | 0.1 | 1.1 | 0.0 | -0.4 |
| 2014/15 | 2.9 | 0.7 | 0.0 | 0.0 | 3.6 | 2.1 | 0.1 | 0.5 |
| 2015/16 | 0.1 | 1.6 | -0.6 | 0.0 | 1.2 | 1.6 | 0.5 | 0.1 |
| 2016/17 ytd10 | -1.1 | 0.7 | -0.1 | 0.0 | -0.5 | 9.0 | 0.5 | -3.4 |
| 2016 April11 | 0.0 | 0.5 | 0.0 | 0.0 | 0.5 | 7.5 | 0.7 | -0.3 |
| 2016 May11 | 0.0 | 0.1 | 0.0 | 0.0 | 0.1 | 5.3 | 0.5 | -1.0 |
| 2016 June11 | -0.4 | 0.2 | 0.0 | 0.0 | -0.2 | 5.3 | 0.4 | -1.7 |
| 2016 July11 | -0.8 | -0.1 | -0.1 | 0.0 | -1.0 | 9.0 | 0.5 | -0.3 |
| Source: Office for National Statistics | ||||||||
| Notes: | ||||||||
| 1. Unless otherwise stated. | ||||||||
| 2. Central government. | ||||||||
| 3. Local government. | ||||||||
| 4. Non-financial public corporations. | ||||||||
| 5. Bank of England. | ||||||||
| 6. Public sector net borrowing excluding public sector banks. | ||||||||
| 7. Public sector net debt excluding public sector banks. | ||||||||
| 8. Public sector cash requirement excluding public sector banks. | ||||||||
| 9. 2015/16 represents financial year ending 2016 (April 2015 to March 2016). | ||||||||
| 10. ytd = Year-to-date, April to July 2016. | ||||||||
| 11. Monthly revisions are in part due to the quarterly practise of aligning the monthly public sector finances with quarterly datasets. The alignment process and the impact on monthly data is set out in the public sector finances revision policy. Year to date figures are unaffected. | ||||||||
Download this table Table 6: Revisions between this bulletin and the previous bulletin
.xls (36.9 kB)To provide an insight into the drivers of the historical revisions between publications, this bulletin presents 3 revisions tables:
- Table PSA1R complements PSA1 and provides a revisions summary (between the current and previous publication) to headline statistics in this release
- Table PSA2R complements PSA2 and provides the revisions (between the current and previous publication) to net borrowing by sector
- Table PSA6R complements PSA6B and provides the revisions (between the current and previous publication) to the components of central government net borrowing
Tables PSA1R and PSA6R are published in the Public Sector Finances Tables 1 to 10: Appendix A dataset.
In addition, the Revisions analysis for Public Sector Finances: Appendix C dataset presents a statistical analysis of several main components of the central government account (current receipts, current expenditure, net borrowing and net cash requirement) to determine whether their average revisions are statistically significant.
Back to table of contents12. New to the bulletin
Public sector current receipts dataset
In response to your feedback, this month we have introduced a new dataset titled “Public sector current receipts: appendix D”, providing a breakdown of public sector income by month, financial year-to-date and full financial year. The dataset includes additional detail to that previously published in the monthly statistical bulletin which we hope you will find useful.
We welcome your comments on ways in which the Public sector finances statistical bulletin and the associated tables might be improved. Please email: public.sector.accounts@ons.gov.uk
Presentation of UK net contributions to the EU
Table PSA6E, in the Public Sector Finances Tables 1 to 10: Appendix A dataset, provides detailed information on central government current expenditure, including UK contributions to the EU.
The UK government's official contributions to the EU consist of customs duties, sugar levies and payments which are calculated based on UK VAT and gross national income (GNI) levels. In addition to this, the UK is entitled to receive an abatement, (often referred to as a "rebate" or "correction"), which is the mechanism that is applied to lower the UK's contribution to the EU budget, by reimbursing 66% of the country's budgetary imbalance (the difference between payments and receipts).
Previously the abatement (series FKKL) was not presented separately in the public sector finances but was included as a component of “current transfers received from abroad” (series NMDL). With this publication we are improving clarity around the different components of the UK net contributions to the EU by showing both the abatement and the UK net contributions to the EU separately in Table PSA6E.
The abatement is now shown as a separate series and recorded as a component of “UK contributions to the EU” (series M9LH), which has been re-titled “UK net contributions to the EU”. In this presentation “UK net contributions to EU“(series M9LH) is equal to the “UK gross contributions to EU” (series DIIR), less “abatement” (series FKKL). “Current transfers received from abroad” (series NMDL) now excludes the abatement and has been footnoted to reflect this change.
These changes are presentational only and have no impact on net borrowing.
Back to table of contents13. Consultation with users
As part of our continuous engagement strategy, we welcome your feedback on ways in which this bulletin can be improved. Please email: public.sector.accounts@ons.gov.uk
UK Statistics Authority assessment of public sector finances
Alongside monitoring the production and publication of official statistics, the UK Statistics Authority's statutory function is to prepare, adopt and publish a Code of Practice for Official Statistics (in consultation with others as appropriate), setting out the standards that the Statistics Authority expects official statistics to meet. The Statistics Authority also determines whether official statistics comply with the Code and, if so, designates them with the quality mark “National Statistics”. The process of determining compliance with the Code and designation as National Statistics is known as “Assessment”.
On 8 November 2015, the UK Statistics Authority published its latest assessment report of public sector finances. The report confirmed the National Statistics status of the public sector finances bulletin subject to certain requirements being met.
Back to table of contents14. Changes to publication schedule for economic statistics
From January 2017 we are improving the way we publish economic statistics, with related data grouped together under new "theme" days. This will increase the coherence of our data releases and involve minor changes to the timing of certain publications. For more information see Changes to publication schedule for economic statistics.
Back to table of contents