Table of contents
- Main points
- Collaboration
- Acknowledgements
- What is natural capital?
- Why produce natural capital accounts?
- What is included in this bulletin?
- Structure of the publication and key terminology
- Annual service flow estimates
- Service flow estimates by category of natural capital
- Asset value estimates
- Asset value by category of natural capital
- Methodology – building the natural capital estimates
- Methodology by category of natural capital
- Appendix 1
1. Main points
Natural assets provide a wide range of environmental services that make human life possible: the food we eat, the water we drink and less visible services such as climate regulation and the inspiration we take from wildlife and the natural environment.
Office for National Statistics (ONS) and the Department for Environment, Food and Rural Affairs (Defra) have been developing methods to value these services, aiming to highlight the relative importance of services provided by the UK’s natural assets.
In 2014, services provided by the environment played a key role in supporting the incomes of certain UK industries; 16% of profits from agricultural production can be attributed to services provided from our natural resources; 37% for public water supply; and 87% for fish production.
The value of wind energy to the power generation industry has grown by 233% since 2007, while the value of abstracting non-renewable sources including oil, gas and minerals fell from £189 billion to £23 billion.
In 2014, UK natural capital assets supplying cultural (recreation) and regulating (air filtration) services made up the largest proportion of the natural capital assets currently measured.
Back to table of contents2. Collaboration
This publication is produced in partnership with the Department for Environment, Food and Rural Affairs.
Department for Environment Food and Rural Affairs

Download this image Department for Environment Food and Rural Affairs
.png (9.3 kB)
3. Acknowledgements
This bulletin has benefitted from the valuable contributions made by Rocky Harris, Colin Smith, Julian Harlow (Department for Environment, Food and Rural Affairs), Geoff Bright (ONS) and Natural Capital Committee members Diane Coyle and Colin Mayer. We would also like to thank Giles Atkinson (LSE), Sheila Ward and Richard Haw (Forestry Commission), Pat Snowdon (Forest Research) and Rebecca Clarke (Natural England) for their continued assistance and support in developing these accounts.
Back to table of contents4. What is natural capital?
Natural capital refers to the stock of our physical natural resources and the ecosystem services that these resources provide. The UN System of Environmental-Economic Accounting – Central Framework (SEEA-CF) defines environmental assets as: “the naturally occurring living (biotic) and non-living (abiotic) components of the Earth, together constituting the biophysical environment, which may provide benefits to humanity”.
These benefits can be thought of as ecosystem services. Ecosystems are the dynamic complex of plant, animal and micro-organism communities all of which function together1. Ecosystems provide many services which contribute to human well-being, such as food, water, air filtration and recreation. Ecosystem services are important to measure as they provide the link between the ecosystem itself, known as the ecosystem asset, and the benefits received by society.
Notes from the What is natural capital? section:
- Millennium Ecosystem Assessment (2005)
5. Why produce natural capital accounts?
Natural capital accounts offer a consistent way of looking at the significance of nature and can help identify drivers of ecosystem change.
Typically, key indicators of long-term living standards have only included stocks of produced capital (for example, buildings, machinery, infrastructure, etc.). In recent years several reports have highlighted the need to adopt a broader definition of wealth, including natural capital1.
The development of monetary valuation aide this integration further, as economic and environmental data are presented in a consistent unit.
The valuation estimates in this paper aim to raise awareness of the economic significance of natural capital, and provide a basis on which changes in value of components of the UK’s natural can be recorded. In time, this information could help develop an aggregate indicator of sustainability2.
A number of habitat accounts, such as woodland and freshwater, are also in development. This bulletin provides a snapshot of the progress made by the ONS and Defra in the overall development of the accounts. More information on the natural capital programme of work can be found on the natural capital accounts webpage.
Notes from the Why produce natural capital accounts? section:
- Including natural capital (for example, the Stiglitz Commission (2009), World Bank (2006, 2011), Inclusive Wealth Report (2012)).
- As envisaged in the Office for National Statistics (ONS) June 2013 paper, Towards Wealth Accounting – Natural Capital within Comprehensive Wealth).
6. What is included in this bulletin?
This article presents monetary estimates for select components of UK natural capital for the years 2007 to 2014. This work builds on the estimates published in the 2014 ONS publication: UK Natural Capital — Initial and partial monetary estimates.
Since this publication there has been substantial development of the methods used previously, as well as the addition of estimates for some categories of natural capital not previously included. However, the methodology is still experimental and there are still a number of services not currently measured. Therefore estimates should not be interpreted as the total value of UK natural capital.
Table 1 presents a broad-based list of services provided by UK natural capital, and indicates which of these services have been included in this paper and which are yet to be developed. Definitions of ecosystem service types are contained in Appendix 1.
Table 1: Environmental services included in this publication1
| Provisioning | Regulating | Cultural |
| Products such as food, water, fibre and fuel | Benefits such as water purification, climate regulation, noise and air pollution reduction and flood hazard reduction | Non-material benefits, for example recreational enjoyment and aesthetic experience |
| Included | Included | Included |
| Agricultural production | Carbon Sequestration | Recreation (day trips by UK residents) |
| Water for public water supply | *New* Air Pollution Removal (Particulate matter and sulphur dioxide) | |
| Fish | ||
| Timber | ||
| Oil | ||
| Gas | ||
| Coal | ||
| Minerals | ||
| *New* Hydro power | ||
| *New* Wind power (major power producers only) | ||
| Not included | Not included | Not included |
| Wild animals | Air pollution removal (other pollutants) | Scientific and educational interactions |
| Wind plants | Waste water cleaning | Heritage and aesthetic interactions |
| Other renewable energy sources, | Mediation of smell, noise and visual pollution, solid wastes | Symbolism of certain plants and animals |
| Water not for public water supply | Flood, erosion and landslide protection, water flow control, temperature regulation | Value place on nature simply existing |
| Lifecycle regulation | Overnight visits and visits by non-residents | |
| Water condition regulation | Physical and mental health | |
| Pollination and seed dispersal | ||
| Source: Office for National Statistics | ||
| Notes: | ||
| 1. The breakdown provided has been adapted from the Common Classification of Ecosystem Services (CICES) developed by the European Environment Agency. | ||
Download this table Table 1: Environmental services included in this publication^1^
.xls (29.2 kB)7. Structure of the publication and key terminology
The service flows from the UK’s environmental assets are presented first in this bulletin, followed by the asset values. A detailed methodology is then provided.
The natural capital accounts draw on the structures and definitions used in the System of National Accounts (SNA) – the statistical framework that underpins established economic statistics, such as gross domestic product (GDP). To help understand the publication a number of key terms are defined.
Table 2: Main terms used in this publication
| Term | Definition |
| Service flows | The physical or monetary return stemming directly from the natural capital asset itself. |
| Further details on the methods used to compile the flow estimates by category of natural capital can be found in the methodology section. | |
| Asset Values | The service flows form the basis of the respective asset values. |
| Asset value estimates are calculated using a Net Present Value (NPV) approach. This valuation method first discounts the stream of expected service flows over the life of the asset. The discounted services flows are then aggregated to produce the asset value estimate. | |
| Resource Rent | Interpreted as the value of industry income which can be attributed directly to natural capital. |
| It is calculated as the annual return (output) left after all costs of production and fixed capital returns have been deducted and adjustments for specific taxes and subsidies have been made. Further details are given in the methodology section of this paper. | |
| Also called the residual value approach, in this publication it is used to calculate estimates for energy, minerals, agriculture, fish and public water supply. | |
| Source: Office for National Statistics | |
Download this table Table 2: Main terms used in this publication
.xls (27.6 kB)8. Annual service flow estimates
This section presents information on the estimated value of annual service flows provided by the UK natural environment. Updates to existing flow estimates comprise those for:
- oil and gas
- minerals
- public water supply
- timber
- agricultural biomass
- fish
- carbon sequestration
- recreation services
In addition to the existing set of annual flow estimates, the list has been expanded with the addition of estimates for the following environmental services:
- hydro power
- wind power
- air pollution removal
It should be noted that the list of environmental services presented above is by no means exhaustive and future estimates will look to expand the number currently presented. The valuation of services related to flood regulation is an area we are currently investigating and some discussion on scope and possible methods are given in the recent publication.
Valuation of annual environmental service flows
Unless otherwise stated, annual ecosystem service flow estimates are calculated as a resource rent. Annual ecosystem service flow estimates for timber, carbon sequestration, air pollution removal and recreation are not calculated as a resource rent. Full details on the approach used for each type of environmental service flow are provided in the methodology section of this publication.
Price basis
Unless otherwise stated, the prices used in the resource rent calculations are deflated using the ONS GDP deflator to convert them into constant 2014 prices.
Back to table of contents9. Service flow estimates by category of natural capital
Oil and Gas
Estimates for the environmental services provisioned from the UK’s oil and gas reserves are based on the methodology published by the Office for National Statistics (ONS) in June 2013.
Between 2007 and 2014, the annual value of provisioning services supplied from UK oil and gas reserves declined from £17.5 billion to £7.1 billion. The majority of the decrease occurred between 2011 and 2014 with annual service flow values falling approximately 71%.
High volatility in energy prices can help explain part of the movements in service flow values over the period. After peaking at over $140 (c. £75) a barrel in mid-2008, Brent crude oil prices dropped sharply over the next year before recovering to approximately $100 (c. £60) per barrel in 2010 to 2011. Oil prices commenced a gradual downward trend thereafter, which intensified through the latter half of 2014. The natural gas price trajectory was similarly volatile over the 2007 to 2014 period.
Figure 1: Annual value of provisioning service flows provided from UK oil and gas reserves
(2014 prices), 2007 to 2014
Source: Office for Budget Responsibility, Office for National Statistics
Download this chart Figure 1: Annual value of provisioning service flows provided from UK oil and gas reserves
Image .csv .xlsThe flow estimates are calculated using data on oil and gas production and prices produced by the Oil and Gas Authority (published by the Office for Budget).
The marked decline in provisioning service values between 2011 and 2014 was driven by a gradual rise in the operating costs of oil and gas producers over the timeframe, together with a decrease in revenues due to falling prices.
Coal and peat
The established resource rent approach is applied for the Standard Industrial Classification (SIC) subdivision: “Mining of coal and lignite” and “Extraction of peat” in the calculation of services flows related to UK coal resources, and peat resources respectively. Negative resource rents are derived for both categories for the years 2007 to 2014. The negative resource rents for coal can be attributed to a range of factors such as the broad decline in coal prices and the competitive nature of the market.
Peat production has fallen steadily and continues to diminish. This is because environmental concerns over peat extraction mean that no new planning permissions for peat are granted.
Minerals
Figure 2 presents value estimates for environmental flows from categories of UK mineral resources. Estimates are presented for those minerals categories where data is available to calculate associated flow values. These comprise estimates for: sandstone, limestone and dolomite, chalk, igneous rock, salt, sand and gravel, and potash.
Figure 2: Annual value of environmental flows from selected UK mineral deposits
(2014 prices), 2007 to 2014
Source: British Geological Survey's (BGS) United Kingdom Minerals Yearbook
Download this chart Figure 2: Annual value of environmental flows from selected UK mineral deposits
Image .csv .xlsService flows from limestone and dolomite, and sand and gravel deposits in the UK had the highest value throughout the 2007 to 2014 period. In 2014, flows of limestone and dolomite had an estimated value of £62 million (up from £25 million 2007), while sand and gravel flows had an estimated value of £61 million (up from £30 million in 2007).
Annual flows from UK potash deposits experienced the highest change in value between 2007 and 2014, recording a more than nine-fold increase from £2 million to £21 million. The change was overwhelmingly price driven. After hitting multi-decade lows in 2007, potash prices rose sharply between 2008 and 2009, and remained at or above these price levels throughout much of the remaining period.
Rises in the value of flows across the selected mineral classes were primarily price-driven, with the associated physical flows (extraction) largely declining over the 2007 to 2014 period: sandstone (negative 26%); limestone and dolomite (negative 23%), chalk (negative 56%), igneous rock (negative 26%), salt (negative 16%), sand and gravel (negative 34%). Production for potash was the exception, rising 40% between 2007 and 2014.
Annual flows for the minerals presented are approximate and estimated using physical and monetary production data published in the British Geological Survey’s (BGS) United Kingdom Minerals Yearbook publication. The value data are combined with a general resource rent ratios calculated for the Mining and quarrying industry subclass: Other mining and quarrying. The general decline in flow values for the selected minerals between 2009 and 2010 was largely driven by a combination of lower output values and relatively higher production costs across the industry.
Timber production
The following section presents estimated annual values for ecosystem service flows supplied from UK timber resources.
Figure 3: Annual value of ecosystem services from the provision of timber
UK, (2014 prices), 2007 to 2014
Source: Forestry Commission, Office for National Statistics
Download this chart Figure 3: Annual value of ecosystem services from the provision of timber
Image .csv .xlsIn 2014, the annual value of ecosystem services provided from UK timber resources was an estimated £0.23 billion. This is 70% higher than the value of ecosystem service flows recorded in 2007 (£0.13 billion).
The provision of timber is an important service supplied by woodlands. The residual approach to valuation is not used to compile flow estimates for timber. Instead, values are estimated by multiplying the amount of timber physically removed (harvested) from woodland by the stumpage price – the price paid to buy standing timber.
The rise in the service flow values over the 2007 to 2014 period can attributed to an increase in the stumpage price (up 31%) and an increase in the volume of timber being removed from woodland (also up 31%), displayed in table 3.
Table 3: Volume of timber removed (physical flow of timber removed), thousand cubic metres overbark, UK, 2007 to 2014
| 2007 | 2008 | 2009 | 2010 | 2011 | 2012 | 2013 | 2014 | |
| Removals (‘000 M³ Overbark) | 10,048 | 9,491 | 9,765 | 10,717 | 11,600 | 11,635 | 12,556 | 13,104 |
| Source: Forestry Commission, Office for National Statistics | ||||||||
Download this table Table 3: Volume of timber removed (physical flow of timber removed), thousand cubic metres overbark, UK, 2007 to 2014
.xls (27.1 kB)The estimates presented in this section relate only to UK woodland trees used for timber production in this period. This differs from previous estimates, which applied a value to all woodland trees in the UK under the assumption that they could all be potentially harvested for timber.
While the latter approach is a useful measure of the UK’s capacity to produce timber1, it is inconsistent with the approach used to value other services, such as carbon sequestration, pollution removal and recreation.
Water
Environmental service flow estimates in this context relate to the value of water abstracted from the environment for use as part of the public water supply. Service flow values are included within industry revenues for Water collection, treatment and supply, and isolated using the residual value approach.
Figure 4: Annual value of ecosystem service flows related to water abstracted for public use
UK, (2014 prices), 2007 to 2014
Source: Office for National Statistics
Download this chart Figure 4: Annual value of ecosystem service flows related to water abstracted for public use
Image .csv .xlsThe value of annual ecosystem services related to the provision of water has ranged between £0.7 billion and £1.5 billion over the 2007 to 2014 period.
Estimates are based on resource rents calculated for the Industry subdivision class: Water collection, treatment and supply. When compared to a measure of profit for this industry, ecosystem services represented approximately 37% of gross operating surplus in 2014, which is largely in line with the proportion recorded in 2007 (36%).
The downward trend in ecosystem service values during the first half of the period was linked to the industry’s capital stocks. A combination of higher capital depreciation costs, and higher returns on capital relative to industry output between 2008 and 2011 reduced resource rent sizes over the period. The fall was compounded by the increasingly negative net effect — throughout the full period — of adjusting for industry taxes and subsidies, when calculating annual resource rents.
In contrast, the rise in annual ecosystem service values after 2011 coincided with a broad-based increase in water prices across the industry. Prices of public water in England and Wales are regulated by the Ofwat2. In 2013, average water bills rose by 3.5%.
In physical volumes terms, the 8% decline in ecosystem service values from 2007 to 2014 was accompanied by a reduction in the water abstracted from the environment for public supply. For example, at a regional level, over the same period, annual water abstraction rates for England and Wales fell 3.9% from 5.98 billion cubic meters (bm3) to 5.75 bm3 (Defra).
Agricultural biomass
The following section presents the estimated annual values of biomass provided, which supports agricultural industry production.
Figure 5: Annual value of ecosystem service flows provided to agricultural production
UK, (2014 prices), 2007 to 2014
Source: Office for National Statistics
Download this chart Figure 5: Annual value of ecosystem service flows provided to agricultural production
Image .csv .xlsThere was a wide variation in estimates of the value of biomass provision to UK agricultural production between 2007 to 2014 period, with values averaging £0.9 billion per annum. When compared to agriculture industry profits, biomass provisioning flow values represented approximately 16% of gross operating surplus in 2014.
Relatively high production and capital costs in 2007, weighed heavily on the value of ecosystem service flows in that year. Similarly in 2009, an increase in production costs led to a sharp decrease in the value, and this was combined with industry subsidy adjustments due to a sharp depreciation in the pound sterling rate against the euro boosting the value of farming subsidies received from the EU.
Large deviations away from “normal” climate conditions can also significantly impact agricultural production volumes (physical), and in turn revenues. For instance, 2014 was a good year for crop production with the favourable weather conditions leading to some of the highest yields on record (Defra, 2014). However, a limitation of using exchange values – as used in the residual value model – is that service flow valuations can be susceptible to the impact of short-term market volatility. For instance, the positive impact on revenues for higher production volumes in 2014 was partly offset by a fall in prices following the increase in supply.
Agricultural production in this instance relates to the industrial classification sub-division “crop and animal production, hunting and related service activities”. Hunting and related services are likely to be small.
These estimates focus on the farmland as an ecosystem and the services it provides, which is different to a standard agriculture account, which would include the contribution of human inputs into the agricultural production values. The estimates in this section will eventually feed into farmland ecosystem accounts, however, at present only physical accounts have been developed.
Fish
The following section presents estimates for the value of fish provisioned from the environment to the UK fishing and aquaculture industry.
Figure 6: Annual value of ecosystem service flows provided to fisheries
UK, (2014 prices), 2007 to 2014
Source: Office for National Statistics
Download this chart Figure 6: Annual value of ecosystem service flows provided to fisheries
Image .csv .xlsBetween 2007 and 2014, the estimated annual value of fish provisioning to the UK Fishing and aquaculture industry rose 9% from £0.35 billion to £0.38 billion, and averaged £0.36 billion across the period.
The sharp rise in fish provisioning values between 2009 and 2010 was largely driven by a relative year-to-year fall in industry costs of production.
The increase in fish provisioning values between 2013 and 2014 (up 19%) came against a backdrop of rising catch quotas for certain fish species. According to the Marine Management Organisation (MMO) the quantity of pelagic3 fish landings rose by 49% in 2014, following a significant increase in the UK mackerel quota. Landings of this species rose 76% from 164 thousand tonnes in 2013 to 288 thousand tonnes in 2014. This pushed pelagic species share of total volumes to around 60% of all landings by UK boats in 2014.
The ecosystem service values presented above are calculated using a resource rent based on the industry subclass Fishing and aquaculture. Marine fishing has by far the largest share of industry output, representing 84% in 2014. When compared to industry profits ecosystem services represented approximately 87% of gross operating surplus in 2014, compared to 85% in 2007.
Hydro power
The following section presents initial estimates of the service value provided by the environment to support the production of hydro power. The ecosystem service in this context relates to the natural flow of water from the environment that is harnessed and used to generate electricity. Due to data limitations, estimates could only be produced for the time period 2010 to 2014.
Figure 7: Annual value of hydrological ecosystem services to hydropower
UK, (2014 prices), 2010 to 2014
Source: Department for Business Energy and Industrial Strategy (BEIS), Office for National Statistics
Download this chart Figure 7: Annual value of hydrological ecosystem services to hydropower
Image .csv .xlsBetween 2010 and 2014, the estimated annual value of hydrological ecosystem services provided to the hydro power industry averaged £0.37 billion, and ranged between an estimated £0.24 billion and £0.53 billion.
Service flow estimates are calculated using the residual value approach to determine the resource rent. The underlying data is sourced from the publically available annual financial statements of the respective hydropower suppliers. Annual output values are based on the revenues received from the sale of electricity produced from hydro power resources. No adjustment is currently made to reflect the impact of taxes and subsidies on revenues. As a result, current estimates may be overestimated. This will be a focus for future research.
The monetary value of ecosystem services provided by the environment to hydropower producers is dependent on several factors, including the energy production volumes, energy prices and industry costs of production.
Rainfall levels can significantly influence the volume of energy produced at hydropower plants. For instance, high rainfall levels in 2011 resulted in a year-on-year rise in the electricity generated from natural flows annually, from 2,694 gigawatt hours4 (GWh) in 2010 to 4,578 GWh in 2011.
The fall in ecosystem service values between 2011 and 2012 was due to sharp increases in production costs across major hydropower producers, and a drop in the volume of hydropower supplied from natural flows.
Hydropower plants located in Scotland support the vast majority of the UK’s hydro electricity supply. In 2015, Scotland possessed approximately 94% of the UK’s hydroelectric production capacity.
Wind power
The following section presents initial estimates of the service value provided by the environment in the production of wind power. Ecosystem services in this context relate to the provision of wind energy from the environment that is harnessed and used to generate electricity. Due to data limitations, estimates could only be produced for the time period 2010 to 2014.
Figure 8: Annual value of ecosystem services to wind power producers
UK, (2014 prices), 2010 to 2014
Source: Department for Business Energy and Industrial Strategy (BEIS), Office for National Statistics
Download this chart Figure 8: Annual value of ecosystem services to wind power producers
Image .csv .xlsThe estimated annual value of ecosystem services provided to the wind power industry rose from approximately £0.55 billion in 2010 to £1.8 billion in 2014. This represents over a three-fold increase in the value of annual ecosystem services over the five-year period.
The sharp rise in values over the period was primarily driven by the rapid growth in capacity. Between 2010 and 2014, the energy production capacity of major power producers5 more than doubled (up 105%) from 4358MW to 8931MW6 (DUKES, 2015). This is on the back of considerable investment in both onshore and offshore wind power infrastructure over the preceding five years. The increased investment facilitated a significant increase (226%) in the annual amounts of electricity supplied from UK wind power sources over the same timeframe, from 8,208GWh in 2010 to 26,763GWh in 2014.
Changes in average annual wind speeds also strongly influence the volume of energy produced from wind power sources. For instance, the relatively high wind speeds in 2011, after particularly low average wind speeds in 2010, helped support a 56% increase in wind energy generation between the two years. The decline in annual flow values after 2011 can be partly attributed to a general increase in industry costs of production relative to revenues.
The list of firms supplying electricity from wind power sources is taken from the Department for Business, Energy and Industrial Strategy’s DUKES publication. It should be noted that the current scope only includes the wind energy supplied by “major power providers”. This represents approximately 86% of total capacity. Future estimates for wind would look to include data from other generators as well as other wind energy technologies not included on the list, such as wind pumps.
Air filtration – pollution removal
This section provides flow values estimates for the ecosystem service of removing two pollutant types from the atmosphere: particulate matter10 (PM10) and sulphur dioxide (SO2). Estimates are for the years 2006 and 2012.
Figure 9: Annual value of pollution removal services
UK, (2012 prices), 2006 and 2012
Source: AECOM
Download this chart Figure 9: Annual value of pollution removal services
Image .csv .xlsThe estimated total annual values of PM10 and SO2 absorption by the UK environment in 2006 and 2012 are £5.01 billion and £4.51 billion respectively (of which PM10 accounts for 99.9%). This represents a 10.0% decrease in annual service flow values over the period.
The flow values presented in this section are calculated by estimating the amount of PM10 and SO2 removed by vegetation in different habitats. The results are then combined with air quality damage cost guidance published by Defra, which is based on avoided mortality and morbidity.
Between 2006 and 2012 the total tonnes of pollutants absorbed fell by 21%. This is reflected in the reduction in the value of annual service flows between the two periods. There are several reasons for this decrease, including the amount of “dry” and “wet” days in a year. On “dry” days more pollutant is removed; there were 16 more “dry” days in 2006 than in 2012.
The approach for quantifying the physical flows of air quality regulation services provided by UK natural capital resources was based on a model set out in Powe and Willis (2004). Further details can be found in the methodology section.
These estimates will shortly be revised and the scope will be expanded to include the value of additional pollutants such as ozone (O3) and nitrogen dioxide (NO2).
Carbon sequestration
The following section presents experimental monetary estimates for the value ecosystem services related to carbon sequestration.
As shown in Figure 10, the estimated annual value to the UK of ecosystem service flows related to carbon sequestration recorded a steady rise between 2007 and 2014, increasing approximately 18% from £1.41 billion to £1.70 billion.
Figure 10: Annual value of ecosystem service flows related to carbon sequestration
UK, (2014 prices), 2007 to 2014
Source: Department for Business Energy and Industrial Strategy (BEIS), Office for National Statistics
Download this chart Figure 10: Annual value of ecosystem service flows related to carbon sequestration
Image .csv .xlsThe methodology underpinning the estimates combines data on the physical changes in the Land use, land use change and forestry (LULUCF) sector7 within the UK greenhouse gas inventory, with information on the non-traded price of carbon8. Further details are included in the methodology section.
The rise in service values over the 2007 to 2014 period was due to a combination of rising carbon sequestration rates, particularly in the Grassland subcategory of LULUCF, and an increase in the carbon price.
Carbon sequestration rates in the context of these estimates relate only to the carbon removed from the atmosphere by UK terrestrial ecosystems. Due to data constraints, values related to carbon sequestration by marine ecosystems, including those intertidal areas such as Coastal Margins, have been omitted from current estimates. As a result, annual flow values related to carbon sequestration services are likely to be an underestimate.
There have been a number of revisions to the methodology underpinning the carbon sequestration estimates since the last release. The changes stem from an improvement in our understanding of carbon flow statistics. For example, we have better targeted, and expanded the scope of, carbon sequestration activities within the habitat sub classes of the LULUCF sector. The approach to identifying carbon sequestration activities within the LULUCF sector remains under development and the estimates are experimental at this stage. Feedback from experts in this field of environmental accounting would be most welcomed. Full details of the revised approach can be found in the Methodology section.
Recreational services
The following section presents the estimated annual value of recreational services provided by the natural environment in the UK.
In 2014, the annual value of recreational services provided by nature was estimated at £6.5 billion. This is 17% lower than the value of ecosystem service flows recorded in 2009 (£7.8 billion).
Figure 11: Annual value of recreational service flows
UK, (2014 prices), 2009 to 2014
Source: Natural England, Ricardo, Office for National Statistics
Download this chart Figure 11: Annual value of recreational service flows
Image .csv .xlsThe fall in service flow values over time is largely due to a decline in expenditure on admission fees, parking and transport tickets; all fell significantly over the period. Expenditures on fuel (including taxis) roughly remained flat over the same period.
Table 4 provides the physical change in visits to the natural environment. The number of visits and the amount of time spent in the natural environment increased between 2009 and 2014, while the amount of time spent travelling to places in nature remained relatively unchanged.
Table 4: Number of visits and time spent in or travelling to the natural environment (physical flow of recreational services), UK, 2009 to 2014
| 2009 | 2010 | 2011 | 2012 | 2013 | 2014 | |
| UK visits (scaled on the basis of population, millions) | 3,409 | 2,972 | 3,249 | 3,393 | 3,486 | 3,713 |
| Total time (million hours) | 6,844 | 6,017 | 6,680 | 7,164 | 7,171 | 7,463 |
| Travel time (million hours) | 2,938 | 2,607 | 2,781 | 2,745 | 2,885 | 2,909 |
| Site time (million hours) | 3,906 | 3,409 | 3,899 | 4,418 | 4,286 | 4,554 |
| Source: Natural England, Ricardo AEA | ||||||
Download this table Table 4: Number of visits and time spent in or travelling to the natural environment (physical flow of recreational services), UK, 2009 to 2014
.xls (26.6 kB)By only using travel expenditure, the value of recreational services provided by the natural environment is heavily underestimated. This is because visits which have incurred no cost, such as short walks in local parks, are not captured. In previous ONS estimates, these trips were captured through the inclusion of a time value estimate component.
The recreation estimates have been developed further by Ricardo AEA, who also reviewed various different methods of valuing recreation. The review found that including time presents significant challenges, since the choice of method can significantly affect results.
For comparison purposes, figure 12 presents annual flow estimates when using the previous ONS approach, which included both travel and site time, and used wages to determine the value. It also shows annual flow estimates when only travel time is included and the Department for Transport’s Webtag estimates are used to determine the value. A significant variation in results can be seen when presented in this format.
Figure 12: A comparison of annual recreational service flow values, when estimated using different approaches
UK, (2014 prices), 2009 to 2014
Source: Natural England, Ricardo, Office for National Statistics
Download this chart Figure 12: A comparison of annual recreational service flow values, when estimated using different approaches
Image .csv .xlsFor more information regarding these approaches please see the cultural services report.
Notes from the Service flow estimates by category of natural capital section:
- Estimates using this approach continues to be published in our UK Environmental Account publications.
- The Water Services Regulation Authority.
- Pelagic fish inhabit the water column, neither near the bottom nor the shore, of coasts, open oceans, and lakes (US Department of Commerce).
- Gigawatt hours is a measure of the energy supplied in a year.
- Defined as firms for whom the main business is the generation of electricity for sale.
- Digest of UK Energy Statistics.
- DECC, Final UK greenhouse gas emissions national statistics
- Carbon Valuation in UK Policy Appraisal: A Revised Approach, p.119, Annex 4
10. Asset value estimates
Assets in this context can be viewed as the stock of natural capital that produces the flows of beneficial goods and services to people over time.
The asset values are estimated by capitalising the annual flow of services from the natural resource that are expected to take place over a projected period. This period is known as the asset life. The annual environmental service flows reported in the previous section provide the basis for the projected flows. Under this valuation approach, a change in a given natural capital’s asset value can be interpreted as a reduction or increase in the ability to provide the associated environmental services into the future.
Many of the environmental services presented in this bulletin are produced from renewable resources. For instance, for wind and hydro the natural resource is the climate, while for carbon sequestration and air pollution removal the resource is our vegetation. This makes it difficult to quantify the expected life of the associated assets as the service will be provided indefinitely.
Due to this, unless otherwise stated, the asset value estimates assume a maximum asset life of 50 years for renewable assets and 25 years for non-renewable (depletable) assets. These asset lives are working assumptions, which may well understate the values given to the respective elements of natural capital. The assumptions will be revisited as part of future work.
Full details of the valuation approach used for each category of natural capital presented are provided in the Methodology section of this publication.
Back to table of contents11. Asset value by category of natural capital
This section presents asset values as at 2007 and 2014, and associated changes over the period, by category of natural capital. The reference tables that accompany this release provide the full time series in a structure similar to standard asset accounts.
Table 5 presents the estimated opening (at end 2007) and closing (as at end 2014) asset values by category of natural capital and the associated ecosystem service category. The change in asset values between the opening and closing stock is presented in figure 13.
Table 5: Asset value by category environmental service, UK type, (£ billion, 2014 prices), 2007 and 2014
| Associated environmental service type | Natural Capital asset category | Opening stock, year end 2007 | Closing stock, year end 2014 |
| Provisioning services | Agricultural biomass | 14.9 | 32.4 |
| Fish | 7.9 | 9.1 | |
| Timber | 3.3 | 4.2 | |
| Water | 31.9 | 29.2 | |
| Minerals | 1.6 | 3.7 | |
| Oil, gas and coal | 190.2 | 22.6 | |
| Wind energy | 11.0 | 45.3 | |
| Hydropower | 10.2 | 9.2 | |
| Regulating services | Carbon Sequestration | 51.1 | 60.7 |
| Air pollution removal** | 129.0 | 114.2 | |
| Cultural services | Recreation | 213.5 | 166.3 |
| Source: Office for National Statistics | |||
Download this table Table 5: Asset value by category environmental service, UK type, (£ billion, 2014 prices), 2007 and 2014
.xls (50.7 kB)Within the current set of environmental services presented, the capitalised value of assets associated with the supply of regulating services represented the largest portion of the total asset value — 37% in 2014 up from 27% in 2007. Whereas, capital values for provisioning services represented 28% in 2014 (down from 41% in 2007) and cultural services represented 35% in 2014 (up from 32% in 2007).
The asset value of recreation services has consistently formed the largest component of the estimates presented. The asset value of recreation services has fallen by 22% between 2007 (£213.5 billion) and 2014 (£166.3 billion). This decrease is a reflection of falling expenditure spent on recreational visits to the natural environment.
The asset value of UK oil and gas resources decreased significantly over the 2007 to 2014 period, declining from £189.8 billion in 2007 to £22.6 billion in 2014. The extreme fall is due to deterioration in the projected profitability of the industry, and thus the value of the ecosystem service.
The methodology used to produce the oil and gas asset value estimates relies on Office for Budget Responsibility forecasts of oil and gas production and prices, and the incomes and expenditures derived from these. Since 2007, the economic outlook for UK oil and gas industry profits has worsened considerably following the global economic downturn and a sharp increase in the supply of oil.
Oil and Gas asset values are based on the net present value (NPV) of projected flows. Within the model, profits generated from oil and gas assets are projected to experience continued downward pressure over the medium term owing to the lag between energy price falls (reducing revenues) and the ability of extractors to reduce production costs.
It should also be noted, however, that some decline in the value of UK oil and gas assets would be expected, given the depletable nature of the resource. Like mineral resources, oil and gas resources are non-renewable. Without new discoveries, each year the physical stock of the resource shrinks as more is extracted and used within the global economy.
Figure 13: Change in asset values between the opening stock and closing stock
UK, (2014 prices), 2007 and 2014
Source: Office for National Statistics
Download this chart Figure 13: Change in asset values between the opening stock and closing stock
Image .csv .xlsThe asset value attributed to the air filtration services (air pollution removal and carbon sequestration) form the next largest components of the natural capital estimate. The asset value of air pollution removal declined from £129.0 billion to £114.2 billion, between 2007 and 2014, whilst the asset value of carbon sequestration services rose from £51.1 billion in 2007 to £60.7 billion in 2014.
The change in air pollution removal estimates reflects a change in the amount of pollution absorbed, whereas the change in carbon sequestration reflects a combination of changes in both the projected carbon price and projected carbon sequestration rates.
Additionally, as mentioned in the annual flows section, air pollution removal services are undervalued at present as values are limited to the removal of PM10 and SO2. Further work will be conducted over the next year to expand the list of air pollutants captured in the estimates.
The asset values related to the ecosystem services provided to agriculture, timber and fisheries industries all increased between 2007 and 2014. These changes can broadly be attributed to rising value of output in these industries. For instance, an increase in production volumes by UK fisheries was supported by a rise in the capture quotas for selected fish stocks. Price increases also contributed to the upward change asset values, most notably for the timber and fish.
A fall in the asset value of water provisioning services between 2007 and 2010 was accompanied by an 8% decrease in water abstracted for public supply over the same timeframe. A broad-based rise in water prices across the industry through the latter part of the period saw asset values recover; the asset value in 2007 (£31.9 billion) was largely in line with the estimated value for 2014 (£29.2 billion).
In recent years, the asset value of energy generated by wind power has formed an increasingly significant component of the natural capital estimates. Its value has more than quadrupled between 2007 and 2014, from £11.0 billion to £45.3 billion. Conversely, the asset value of energy generated by hydro power from natural water flows has decreased by 10% over the same period.
Aggregated UK natural capital estimates
Summing these components of natural capital provides a partial estimate of the total stock of natural capital in the UK. This is displayed in figure 14. It should be noted that the list of natural capital components is by no means exhaustive and future estimates will look to expand the number of natural capital assets currently presented.
The partial estimate of UK natural capital was £664.48 billion in 2007. This compares with £497.0 billion in 2014. The decrease between 2007 and 2014 can largely be attributed to falling asset value of oil and gas, and recreation services, although this was partly offset by increases in the asset values of other categories of natural capital including wind and carbon sequestration.
Figure 14: Partial estimation of the value of UK natural capital
UK, (2014 prices), 2007 and 2014
Source: Office for National Statistics
Download this chart Figure 14: Partial estimation of the value of UK natural capital
Image .csv .xls12. Methodology – building the natural capital estimates
This section describes the methodology used to develop monetary estimates for UK natural capital. It begins by discussing the broader approach to valuation and the overarching assumptions made. This is followed by a more detailed description of the specific methodologies used to value the individual components of natural capital.
These estimates broadly accord with the United Nations (UN) System of Environmental-Economic Accounting Central Framework and System of Environmental-Economic Accounting Experimental Ecosystem Accounting principles, which are in turn part of the wider framework of the System of National Accounts. As the UN guidance is still under development, ONS and Defra published a summary of the principles underlying the accounts in August 2014. In consultation with others, we have since developed our thinking in a number of areas and the intention is to publish a revised summary of principles in January 2016.
The methodologies outlined are still under development and subject to future review. By providing full details of each methodology, users of the statistics will fully understand the data underpinning the estimates and the assumptions applied. Furthermore, it is hoped that the methodologies that are more experimental in nature will potentially provide a platform on which practitioners can build and develop robust methods of valuing natural capital. We welcome feedback regarding any of the approaches to valuation presented.
Valuation of natural capital
The net present value (NPV) approach is recommended by the System of Environmental-Economic Accounts (SEEA) and it is used here to value categories of UK natural capital profiled. The NPV approach provides a widely accepted methodology for estimating the value of a given natural capital asset. The logic of the NPV approach involves estimating the stream of services that are expected to be generated over the life of the asset. These values are then discounted back to the present accounting period. This provides an estimate of the capital value of the asset relating to that service at a given point in time. There are four main aspects of the NPV method:
- Annual values of the services provided in constant prices.
- Pattern of expected future flows of values.
- Time period over which the flows of values are expected to be generated.
- Choice of discount rate.
1. Valuation of the annual services provided in constant prices
As noted in previous sections, a variety of approaches are used to value the annual service flows. For oil and gas, coal, minerals, peat, water, agricultural biomass, fish and hydro and wind power, a “residual value” resource rent approach is used.
The resource rent can be interpreted as the annual return stemming directly from the natural capital asset itself, that is, the surplus value accruing to the extractor or user of a natural capital asset calculated after all costs and normal returns have been taken into account.
A residual value approach is used to isolate the resource rent component from the gross annual return (output) of the extractor or user. Using this method, the residual return (resource rent) attributable to the natural capital asset itself can be identified.
The steps involved in calculating the resource rent are given in table 6 below. It should be noted that this is a high-level overview. Variations of this approach are applied depending on the category of natural capital under assessment. More detailed asset specific descriptions are presented later in this section.
Table 6: Derivation of resource rent
| Output | ||
| Less | Operating costs | |
| Intermediate consumption | ||
| Compensation of employees | ||
| Other taxes on production PLUS other subsidies on production | ||
| Equals | Gross operating surplus – SNA basis | |
| Less | Specific subsidies on extraction | |
| Plus | Specific taxes on extraction | |
| Equals | Gross operating surplus – resource rent derivation | |
| Less | User costs of produced assets (consumption of fixed capital + return to produced assets) | |
| Equals | Resource rent | |
| Source: Office for National Statistics | ||
Download this table Table 6: Derivation of resource rent
.xls (28.2 kB)The “return to produced assets” is calculated using the nominal ten-year government bond yield published the Bank of England, and deflated using the gross domestic product (GDP) deflator to produce the real yield. This is applicable to all categories of natural capital where a “resource rent” approach to estimation is used. It should be noted that this rate is relatively conservative compared to those expected in certain markets, such as oil abstraction and water supply, and could overstate the resulting resource rent estimates.
For timber, carbon sequestration, air pollution removal and recreation services, other approaches are used. The approach taken in each case is described in more detail later in this section.
The estimates presented in this paper are in 2014 prices, unless otherwise stated. Prices used for the resource rent calculations are deflated using the ONS GDP deflator to convert them into 2014 prices.
2. Pattern of expected future flows of services
A key factor in the valuation of natural capital is determining the expected pattern of future flows of services. These paths are not observed and hence assumptions concerning the flows must be made, generally as a projection of the latest trends. A more basic way to estimate the expected flows is to assume that the current flow (averaged over recent years) is constant over the asset life, but this might not be the case. In some cases more information is available on future expected levels of services in non-monetary terms or future unit prices. Where there are readily available official projections, these have been taken into account, but otherwise the default assumption in these estimates is that the value of the services is constant over time.
This paper assumes constant service values throughout the asset life, except for the estimates for oil and gas flows and carbon sequestration, where official projections are used.
The pattern of expected service values is assumed to be constant based on averages over the latest 5 years, up to and including the reference year in question. This is set out in figure 16 below.
Figure 16: Equation to calculate future service values

Notes:
- Where SV = service value and t = reference year
Download this image Figure 16: Equation to calculate future service values
.png (6.5 kB)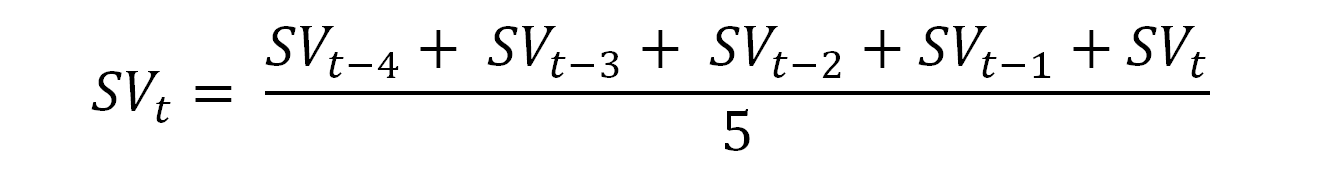
3. Asset life
The asset life is the expected time over which the services from a natural resource are expected to be provided. An estimate of the asset life is a key component in the NPV model because it determines the expected term over which the service flows from an asset should be discounted. This publication takes one of three approaches when determining the life of a natural capital asset.
- Non-renewable natural capital assets: Where a sufficient level of information on the expected asset lives is available for example oil and gas assets, a specific asset life is applied in the calculations. This method is preferable because it takes into account factors such as forecasted prices, costs and extraction rates.
- Non-renewable natural capital assets: Where a sufficient level of information on their respective asset lives is not available, for example, mineral assets, a 25-year asset life is assumed.
- All other natural capital assets: A 50-year asset life is applied to all assets that fall within this category of natural capital.
4. Choice of discount rate
A discount rate is required to convert the expected stream of service flows into a current period estimate of the overall value. A discount rate expresses a time preference – the preference for the owner of an asset to receive income now rather than in the future. It also reflects the owner’s attitude to risk. The use of discount rates in NPV calculations can be interpreted as an expected rate of return on the environmental assets.
Based on an extensive review by external consultants, ONS and Defra use the discount rate set out in the HM Treasury Green Book (2003, page 100). In line with guidance set out in the document, estimates presented in this publication assume a 3.5% discount rate for flows projected out to 30 years, declining to 3.0% thereafter.
Back to table of contents13. Methodology by category of natural capital
Table 6 provides a broad overview of the steps involved in calculating a resource rent using a residual value approach. While this method forms the overarching basis to producing many of the estimates presented in this publication, slight adjustments to the method are required for individual service flows. The following section provides an in depth explanation of the adjustments made for each service, together with more detail where the resource rent approach has not been used.
Agricultural biomass, Water and Fish
The residual value approach to determining resource rent as set out in the previous section is used to estimate monetary values related to the following services: Agricultural biomass, Water and Fish.
Data constraints mean that estimates are currently based on the Standard Industrial Classification (SIC) 2007 subdivision classes associated with the respective services. Annual output and cost data for the respective SIC subdivision classes is sourced from the ONS National Accounts. This comprises the following data sets:
- gross operating surplus
- taxes and subsidies
- net (produced) capital stocks
- depreciation
A 50-year asset life is assumed for each when calculating asset value estimates. The expected resource rent averaged over the previous five years in constant prices is then assumed to be constant for the life of the asset.
Agricultural biomass
Agricultural biomass relate to the value of crops and fodder provided to support agricultural production in the UK.
They are based on data for the SIC subdivision class: Crop and animal production, hunting and related service activities.
As outlined in Table (6), the gross operating surplus is adjusted for taxes (added back in) and subsidies (removed). Changes in the allocation of subsidies to the Agricultural Industry1 in 2005 resulted in a distortion to the net taxes and subsidies values source data set for 2007 and 2008. This is relevant as the resource rents for both years would be based on a retrospective five-year rolling average, for example, 2007 would be based on the 2003 to 2007 average. To address this, a ratio based on the rolling five-year average of post 2005 net taxes and subsides was used when calculating resource rents for 2007 and 2008.
It should be noted that owner-occupier farms whose “wages” would not necessarily be recorded under compensation of employees have not been fully accounted for at present. As a result, resource rents for the reference period covered may be overestimated as notional “wages” (essentially paid out of the profit of the farm) have not been taken out of the calculation. Further work in this area will need to take into account changes in the diversity and productivity of the farming sector.
Water
Water estimates relate to the value of ecosystem services related to water abstracted for public water supply.
Estimates are based on resource rents calculated for the SIC subdivision class: Water collection, treatment and supply.
The definition of this industry subdivision states: “the collection, treatment and distribution of water for domestic and industrial needs. Collection of water from various sources, as well as distribution by various means is included”. A limitation of this approach, therefore, is that the calculated resource rent is not purely related to water supply, but also includes the process of treating the water.
While it is assumed that the industry division used is an appropriate basis for calculating the value accruing from water supply, future work is required to better value of the range of service relating to water provided by the natural environment.
Fish
The estimates relate to the value of fish provisioning services provided to fishing and aquaculture activities in the UK.
The ecosystem service values for this category of natural capital are calculated using a resource rent based approach on the industry subdivision: Fishing and aquaculture.
Marine fishing is by far the dominant economic activity within the industry, representing 84% of total output in 2014.
Minerals
The residual value approach to determining resource rent, as set out in the previous section, is used to estimate monetary values related to all categories of UK mineral assets.
In the absence of detailed stock data, a 25-year asset life is assumed for each mineral category when calculating asset value estimates.
Estimates have been produced only for those minerals for which relevant data is available. These comprise: sandstone, limestone and dolomite, chalk, igneous rock, salt, sand, peat and gravel, and potash. We recognise that this list is by no means exhaustive and that future estimates could include a broader suite of UK mineral assets.
Output data: This is based on annual production revenues for the respective minerals and is sourced from the British Geological Survey’s (BGS) United Kingdom Minerals Yearbook publication.
Resource rent: In the absence of separate production cost data for each category of minerals, a general annual resource rent ratio (the overall industry resource rent as a proportion of revenue) is calculated for the SIC subdivision class: Other mining and quarrying. Applying this ratio to the annual revenue data for each mineral gives an estimate of the revenue stemming directly from the natural capital asset itself.
Oil and gas
The estimates are based on the methodology published by the Office for National Statistics (ONS) in June 2013.
The methodology relied on an Office for Budget Responsibility forecast of oil and gas production and prices, and the incomes and expenditures derived from these.
As such it did not assume a constant extraction path and, therefore, the asset life was not 25 years as considered for other components of non-renewable natural capital in this publication. The asset life used for UK oil and gas reserves at 31 December 2014 was 26 years.
Hydro power
The residual value approach to determining resource rent, as set out in the previous section, is used to estimate the value of services provided by the environment in the production of hydro electricity.
A 50-year asset life is assumed when calculating the asset value estimates.
Estimates are based on the turnovers of companies supplying electricity from hydropower energy sources.
For the years 2010 to 2014, output and cost data is sourced from the publically available annual financial statements of the respective hydropower suppliers. This comprises:
- turnover (output)
- cost of sales (intermediate consumption)
- wages (compensation of employees)
- depreciation
- fixed capital stocks (for use in the compilation of “return of capital estimates”
Data constraints mean that we have been unable to make adjustments related to taxes and subsidies. This will be an area for future research.
The list of firms supplying electricity from hydropower sources is taken from the BEIS’s DUKES publication.
The DUKES publication individually lists all major power producers (MPPs) and their respective energy production capacities. MPPs are defined within the DUKES as “all companies whose prime purpose is the generation of electricity for sale”. MPPs represent approximately 84% of hydropower production capacity on the list as at 2015. The remaining 16% of firms were aggregated together and listed under “Other power stations”. This category of energy generators is restricted to “companies who produce electricity as part of their manufacturing or other commercial activities, but whose main business is not electricity generation”.
Due to data constraints, the service flows from the “Other Power Stations” category of hydropower suppliers is excluded from current estimates. As a result, current values will be underestimated. Future work will focus on obtaining data for this category of hydropower suppliers.
For the years 2007 to 2009, resource rents were modelled by taking a calculated average unit resource rent based on the years 2010 to 2014, and multiplying it by the total units of energy generated from hydropower sources in a given reference year. This method can be broken down into the following stages:
- Unit resource rents are calculated by dividing the resource rent in a given year by the total units of energy generated from hydropower sources in the same year.
- Average unit resource rents are based on the years 2010 to 2014.
- Average unit resource rent is multiplied by the total units of energy generated (from natural water flows, that is, not pumped) for each year (2007 to 2009) to estimate an annual resource rent.
Wind power
The residual value approach to determining resource rent as set out in the previous section is used to estimate the value of ecosystem services provided by the environment in the production of wind power.
A 50-year asset life is assumed when calculating the asset value estimates.
Estimates are based on the turnovers of companies supplying electricity from wind energy sources.
For the years 2010 to 2014, output and cost data is sourced from the publically available annual financial statements of the respective wind power suppliers. This comprises:
- turnover (output)
- cost of sales (intermediate consumption)
- wages (compensation of employees)
- depreciation
- fixed capital stocks (for use in the compilation of ‘cost of capital estimates’)
Data constraints mean that we have been unable to make adjustments related to taxes and subsidies. This will be an area for future research.
The list of firms supplying electricity from wind power sources is taken from the BEIS’s DUKES publication.
The DUKES publication individually lists all major power producers (MPPs). MPPs represent approximately 78% of the UK’s total wind power production capacity. The remaining 22% of firms were aggregated together and listed under “Other power stations”, “Definitions of MPPs” and “Other power stations” are contained in the methodology for Hydropower.
Due to data constraints, the service flows from the “Other Power Stations” category of wind power suppliers is excluded from current estimates. Other potential inclusions that are excluded from current estimates include technologies used for own supply energy production, such as wind pumps used in agriculture. As a result, current values will be underestimated. Future work will focus on obtaining data for these components of wind energy supply.
For the years 2007 to 2009 in the asset values calculation, resource rents were estimated by taking a calculated average unit resource rent based on the years 2010 to 2014, and multiplying it by the total units of energy generated from wind power sources in a given reference year. This method can be broken down into the following stages:
- Unit resource rents are calculated by dividing the resource rent in a given year by the total units of energy generated from wind power sources in the same year.
- Average unit resource rents are based on the years 2010 to 2014.
- Average unit resource rent is multiplied by the total units of wind energy generated for each year (2007 to 2009) to estimate an annual resource rent.
The following section provides information on cases where natural capital estimates have been produced using alternative approaches to the residual value method.
Timber
The method used to value the provisioning services related to timber supply requires two inputs: the stumpage price and the physical amount of timber removed. Annual flow values are then generated by multiplying the two factors together.
The stumpage price is the price paid per standing tree, including the bark, for the right to harvest timber from a given land area. It sourced taken from the Forestry Commission Timber Price Indices publication (2015).
Removals estimates are taken from Forestry Commission Timber Statistics and converted from green tonnes to metres cubed (m3) overbark standing, using a conversion factor of 1.222 for softwood and 1.111 for hardwood. This is then converted from m3 overbark standing to m3 overbark using a conversion factor of 0.9.
Forests in the UK are assumed to be sustainably managed. As such, timber is judged to be a renewable resource and is given a 50-year asset life.
The asset values are based on a retrospective five-year rolling average of annual flow estimates, up to a given reference year. For instance, annual flow projections for 2008 would be based on the average annual flow for the 2004 to 2008 period.
Carbon sequestration
Estimates relate to the service value of removing carbon gas from the atmosphere by UK terrestrial ecosystems. The approach used combines data on the physical changes in subdivisions of the Land use, land use change and forestry (LULUCF) sector2, with information on the non-traded price of carbon.
Due to data constraints values related to carbon sequestration by marine ecosystems, including those intertidal areas such as coastal margins, are not included in current estimates. As a result, annual flow values related to carbon sequestration services are likely to be an underestimate.
The LULUCF sector breakdown identifies carbon sequestration activities in the following subcategories:
A1. Forest Land remaining Forest Land
A2. Land converted to Forest Land
C1. Grassland remaining Grassland
C2.2. Cropland converted to Grassland
C2.4. Settlements converted to Grassland
B2.4. Settlements converted to Cropland
This approach to identifying carbon sequestration activities within the LULUCF sector remains under development and the estimates reported should be considered experimental. Feedback from experts in this field of natural capital would be most welcomed.
Data on actual and projected physical carbon sequestration is applied for 50-years when calculating asset value estimates. The latest projections are assumed to have been available when making projections for past years.
For the years 2007 to 2014, actual physical estimates of carbon sequestration by land use class are sourced from the UK greenhouse gas inventory.
For years 2015 to 2050 carbon sequestration rates are modelled using business as usual (BAU) projections to 2050 for the relevant LULUCF sectors. This data is sourced directly from BIES. Thereafter, estimates are based on the projected carbon sequestration level in 2050, and held constant for the remainder of the 50-year period.
The carbon price used in calculations is based on the projected non-traded price of carbon schedule. This is contained within the data table 3 of the Green Book supplementary guidance.
For years used in the projections beyond 2050, the carbon sequestration rate is assumed to be constant as at 2050 levels.
The non-traded price of carbon schedule can be interpreted as simulated exchange values in that they are based on the marginal abatement cost (supply) of meeting UK policy targets (demand). Fledgling ecosystem carbon markets, for example, using the UK Woodland Carbon Code are not suitable because they are sensitive to the wider institutional framework around carbon markets; they also include other non-carbon values.
Air pollution removal
The value of the air quality regulation service was estimated in a pilot ecosystem accounts for selected protected areas in England and Scotland, commissioned by the Department for Environment, Food and Rural Affairs (Defra) and completed by AECOM. Results suggest air quality regulation is one of the most economically valuable ecosystem services provided by the UK’s natural capital. ONS commissioned AECOM to extend this project to value pollution removal at a UK level, to include sulphur dioxide (SO2) as an additional pollutant and allow better accounting for the impact of population density on the value of this service.
The estimation of values related to pollution removal services requires two key inputs: health damage costs per unit of pollutant by broad location; and the physical amount of pollution removed by type of vegetation by broad location. The two factors are multiplied together to generate an annual flow.
Estimates use the model for quantifying pollution removal rates set out in Powe and Willis (2004) and combine this with Corine Land Cover habitat classification data for 2006 and 2012.
Due to this, only 2006 and 2012 valuations have currently been estimated, therefore 2007 to 2011 estimates are assumed the same as 2006, and 2013 and 2014 estimates are assumed the same as 2012.
The health damage costs are produced by Defra and given by pollutant and physical process.
The asset value was estimated over a 50-year period.
The value per unit of pollution was assumed to be constant over the 50-year period and equal to the unit value in 2012.
Further details on the approach can be found in the report by AECOM.
The report includes a sensitivity test where results are given using the Land Cover Map (2007) as the primary data source, rather than Corine.
The Land Cover Map (LCM) provides a more detailed dataset which is able to include smaller areas of vegetation, such as those in urban areas, however, was last updated in 2007. Results from this show the level of absorption of PM10 and SO2 was around 18% lower in Corine 2006 when compared with LCM 2007 and there were significant differences in the area of different habitat types across the 2 datasets, with Corine 2006 recording around 34% less woodland cover than LCM 2007. This implies the results presented in this section are significantly underestimated and more work is required to assess the change over time and the breakdown by habitat.
Recreation
The recreation estimates are based on expenditure incurred to travel to the natural environment and expenditure incurred during the visit.
This expenditure method takes into account the market goods consumed as part of making the recreational visit (that is, fuel, public transport costs, admission charges and parking fees), providing a marginal price for accessing the site.
Natural England’s Monitoring Engagement in the Natural Environment (MENE) survey is the primary data source. The MENE survey collects information about the way people engage with the environment, such as visiting the countryside, enjoying green spaces in towns and cities, watching wildlife and volunteering to help protect the natural environment. The survey involves weekly waves of interviewing and explores in detail a visit to a site by respondents during the last 7 days (Natural England, 2015).
The MENE survey covers England only, so results are scaled up to the UK using population estimates.
Since the last (2014) publication several revisions to the methodology have been made to improve the quality of the estimates.
A full dataset is now used (not just high-level outputs) to provide the maximum level of accuracy and potential break down values.
Expenditures recorded in MENE that are used in the analysis relate to admission fees, transport fares and parking associated with recreational visits. Fuel costs were not taken directly from MENE; instead an approach was developed to calculate travel costs associated with cars, motorbikes and taxis.
The asset value was estimated over a 50-year period.
The unit value was assumed to be constant over the 50-year period, but was adjusted to take into account ONS population projections.
Notes from the Methodology by category of natural capital section:
- In this case the industry subdivision 'Crop and animal production, hunting and related service activities'.
- DECC, Final UK greenhouse gas emissions national statistics.
14. Appendix 1
Ecosystem service flows1 can be broadly separated into the following categories:
Provisioning services
These represent the material and energy contributions from the environment for use by society. These can include products such as: food (crops, meat and dairy products, fish and honey); water; fibre (timber and wool); and fuel.
Regulating services
These result from the capacity of ecosystems to regulate climate, hydrologic and biochemical cycles, Earth surface processes and a variety of biological processes. Services include: climate regulation; noise and air pollution reduction and flood regulation.
Cultural services
These are generated from the physical settings, locations or situations that give rise to intellectual and symbolic benefits obtained by people from ecosystems through recreation, knowledge development, relaxation and spiritual reflection.
Notes from the Appendix 1 section:
- The definitions refer to biotic flows only. Abiotic such as those from oil and gas, and mineral resources are would be classed within the broader environmental flow definition.