Table of contents
- Main points
- Extent
- Condition
- Woodland
- Enclosed farmland
- Semi-natural grassland
- Mountain, moorland and heath
- Freshwater, wetlands and floodplain
- Coastal margins
- Marine
- Urban
- System of Environmental Economic Accounting (SEEA) condition summary
- Habitat extent and condition, natural capital data
- Glossary
- Measuring the data
- Strengths and limitations
- Related links
1. Main points
This bulletin brings together a range of statistics on extent and condition of nature in the UK for the first time within the United Nations System of Environmental-Economic Accounting Ecosystem Accounting Framework.
The extent of UK urban environments increased 30% between 1990 and 2019.
The extent of enclosed farmland in the UK decreased 5% between 1990 and 2019.
The extent of UK farmland that is woodland has increased from 2% in 1984 to 6% in 2020.
Land used for organic farming in the UK decreased 32% between 2010 and 2020.
Bird species abundance is in long-term decline in woodland, enclosed farmland and freshwater habitats.
Non-native freshwater species more than doubled from 21 in the 1960s to 46 in the 2010s.
2. Extent
UK extent
The Office for National Statistics (ONS) uses the broad habitat classifications from the UK National Ecosystem Assessment (PDF, 2.09MB) with summary area statistics from UK Centre for Ecology and Hydrology (UKCEH) Land Cover Maps.
There are seven broad terrestrial habitats in the UK in 2019.
Enclosed farmland
12,694,693 hectares being 52% of UK land cover.
Woodland
3,268,707 hectares being 13% of UK land cover.
Mountain, moorland and heath
2,584,348 hectares being 11% of UK land cover.
Semi-natural grasslands
2,493,388 hectares being 10% of UK land cover.
Urban
1,843,901 hectares being 7% of UK land cover.
Freshwater, wetlands and floodplain
1,330,499 hectares being 5% of UK land cover.
Coastal margins
390,796 hectares being 2% of UK land cover.
Enclosed farmland covered 13,426,415 hectares of land area in the UK in 1990; by 2019 this area had decreased by around 5% to 12,694,693 hectares. Over the same period, urban areas increased from 1,418,964 hectares by around 30% to 1,843,901 hectares. Woodland habitats grew by 29%, from 2,540,272 hectares in 1990 to 3,268,707 hectares in 2019.
The area of mountain, moorland and heath decreased by 22% from 3,330,138 hectares in 1990 to 2,584,348 hectares in 2019.
The extent of freshwater, wetlands and floodplains across the UK increased by 25% between 1990 and 2019, increasing from 1,061,140 hectares to 1,330,499 hectares. Many former quarries have been converted into artificial lakes. Such re-purposing of former extraction sites can provide many benefits including new habitats for wildlife.
Land use change in Great Britain
Figure 1: The combined extent of woodland, urban habitats and coastal have increased by at least a third between 1990 and 2019
Change of broad habitat extent in Great Britain, 1990 to 2019
Embed code
Notes:
- Raster data were used from UKCEH Great Britain land cover maps for 1990 and 2019.
- The marine and coastal habitats have been merged in this diagram.
- Digital Object Identifier (DOI) for LCM1990 Raster data for Great Britain. Rowland, C. S., Marston, C. G., Morton, R. D., and O’Neil, A. W. (2020). Land Cover Map 1990 (25 metre raster, Great Britain) v2 [Dataset]. NERC Environmental Information Data Centre.
- Digital Object Identifier (DOI) for LCM2019 Raster data for Great Britain. Morton, R. D., Marston, C. G., O’Neil, A. W., and Rowland, C. S. (2020). Land Cover Map 2019 (25 metre rasterised land parcels, Great Britain) [Dataset]. NERC Environmental Information Data Centre.
Download the data
Figure 2: Map of woodland, urban, and semi-natural grassland broad habitats, Great Britain, 2019
Woodland, urban, and semi-natural grassland cover, Great Britain, 2019
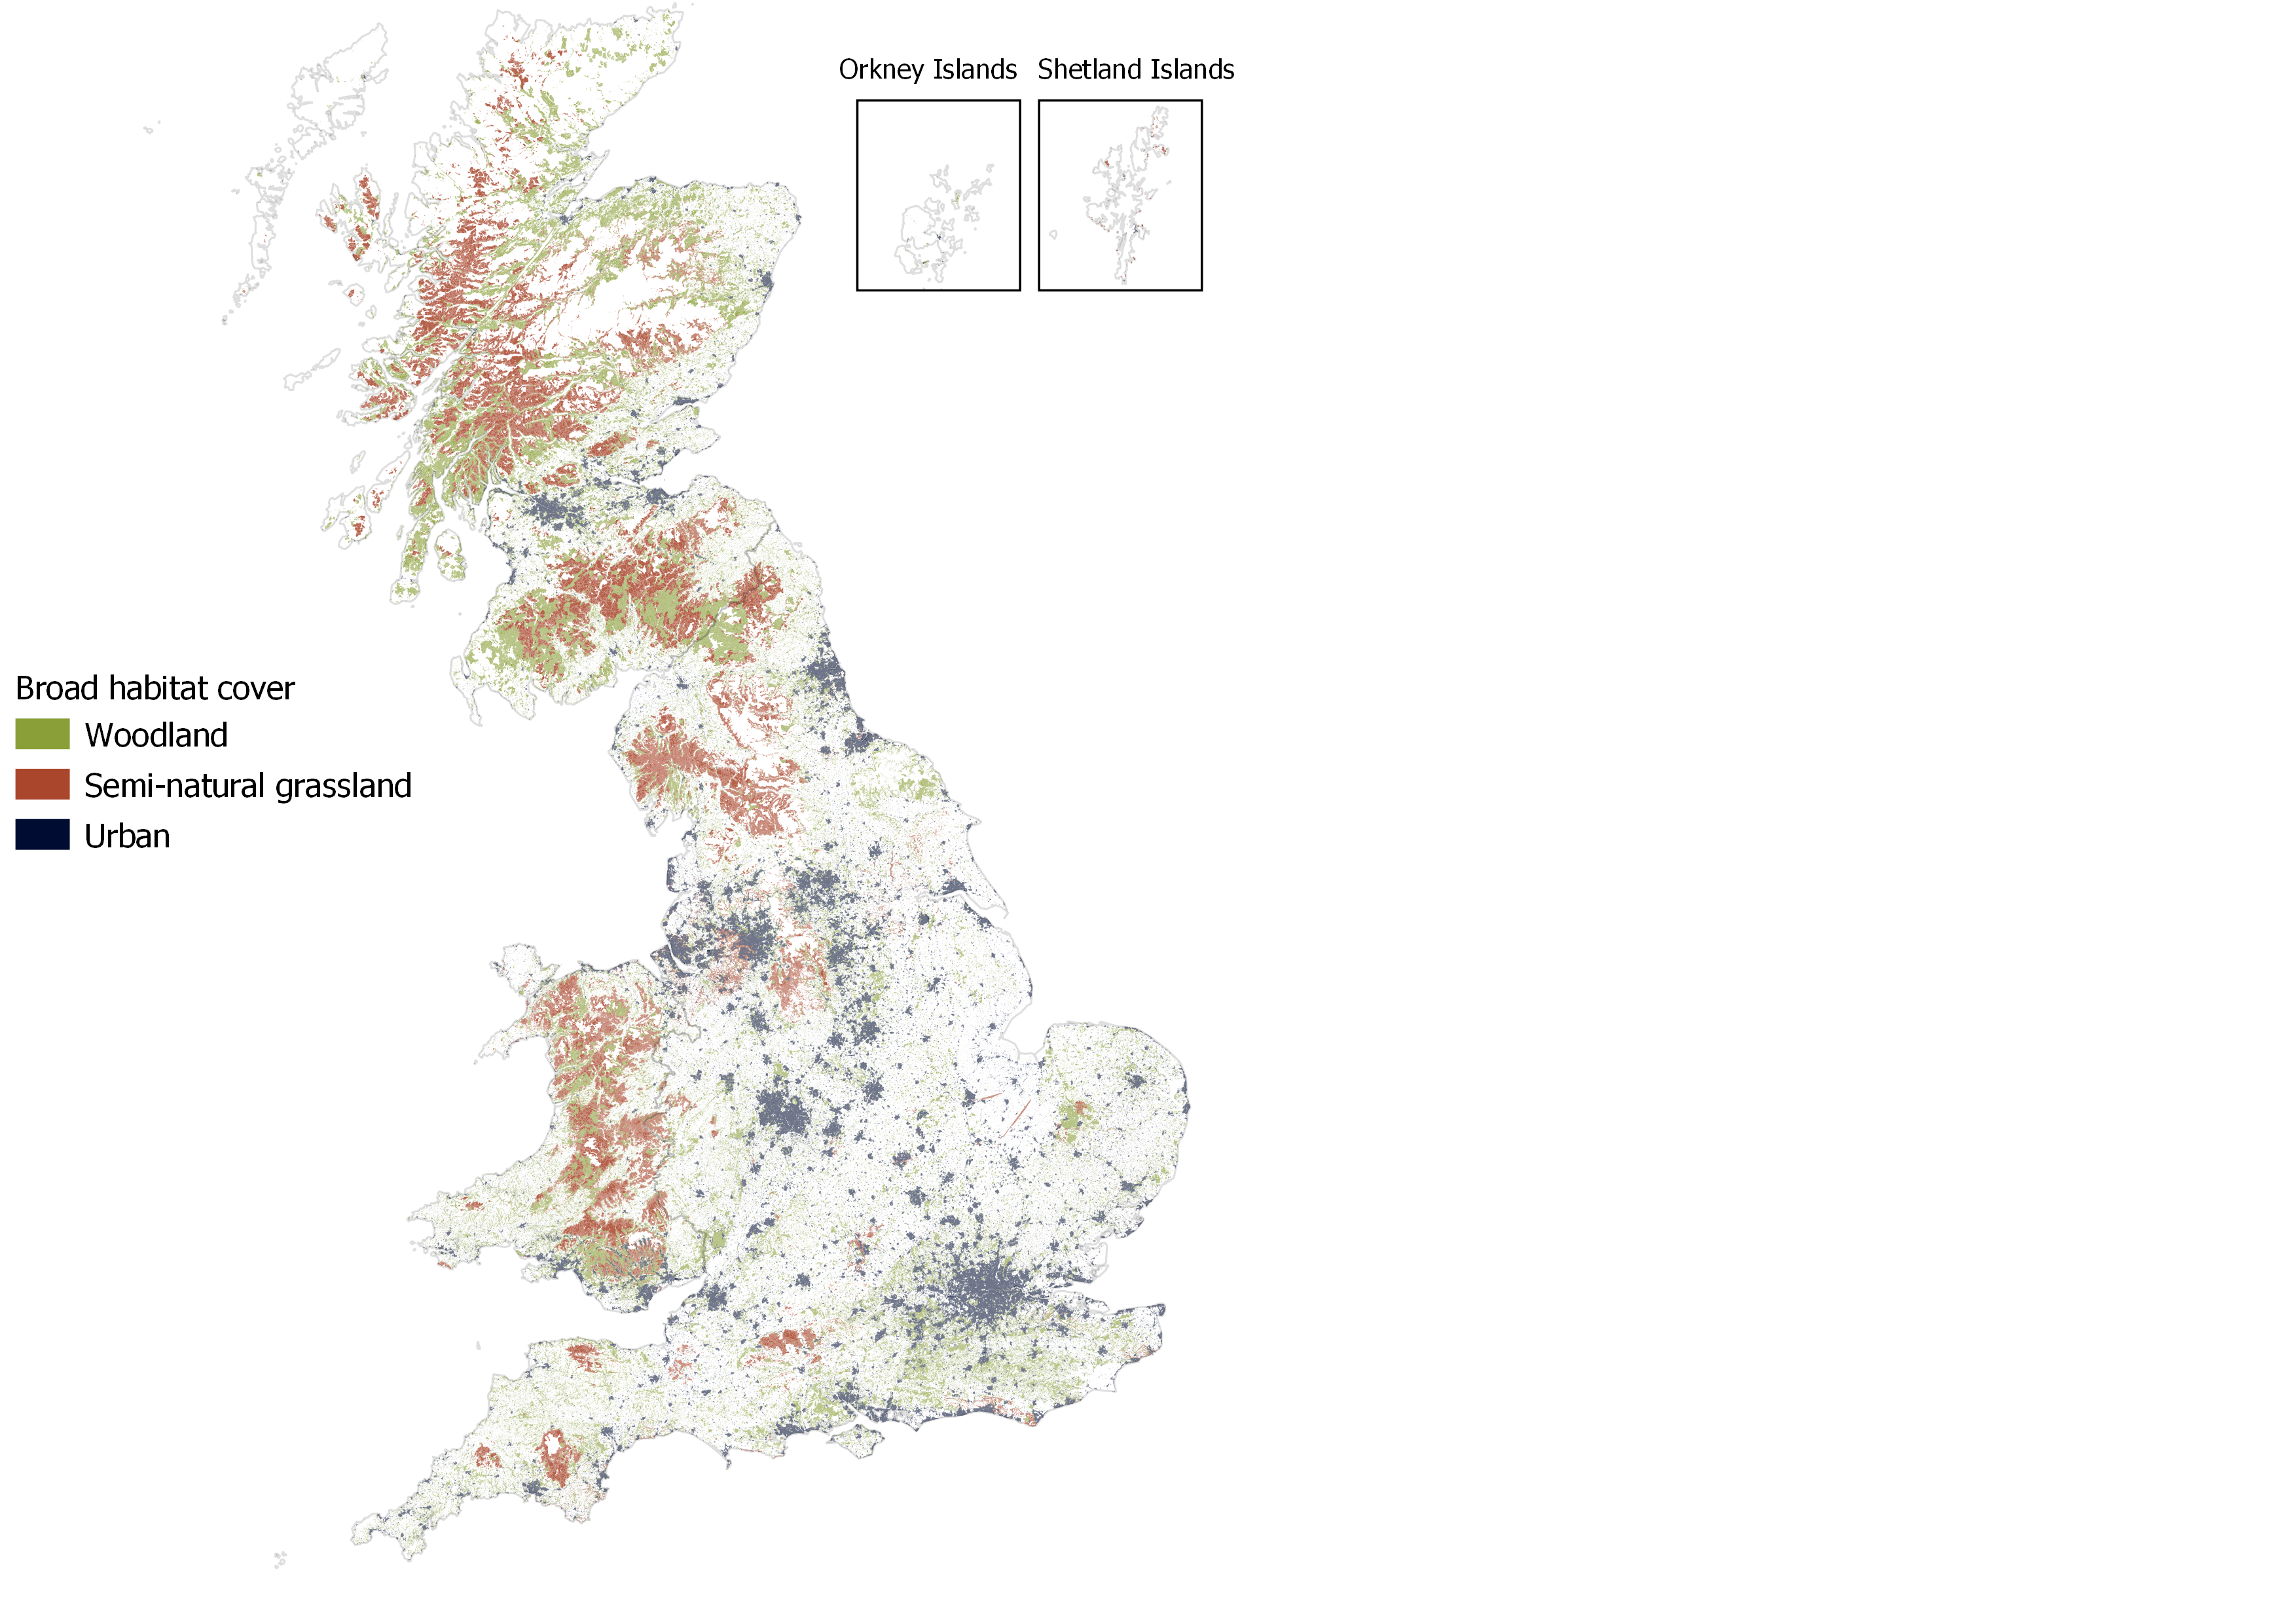
Source: Based upon Land Cover Map (LCM) 2019 © UK Centre for Ecology and Hydrology (UKCEH)
Notes:
Digital Object Identifier (DOI) for LCM2019 Vector data for Great Britain. Contains Ordnance Survey data © Crown Copyright 2022, Licence number 100017572. Morton, R. D., Marston, C. G., O’Neil, A. W., and Rowland, C. S. (2020). Land Cover Map 2019 (land parcels, Great Britain) [Dataset]. NERC Environmental Information Data Centre.
Woodland includes coniferous and deciduous woodland habitats. Semi-natural grassland includes acid grassland, neutral grassland, and calcareous grassland. Urban includes urban and suburban habitats.
Download this image Figure 2: Map of woodland, urban, and semi-natural grassland broad habitats, Great Britain, 2019
.png (3.8 MB)
Figure 3: Map of woodland, urban, and semi-natural grassland broad habitats, Northern Ireland, 2019
Woodland, urban, and semi-natural grassland cover, Northern Ireland, 2019
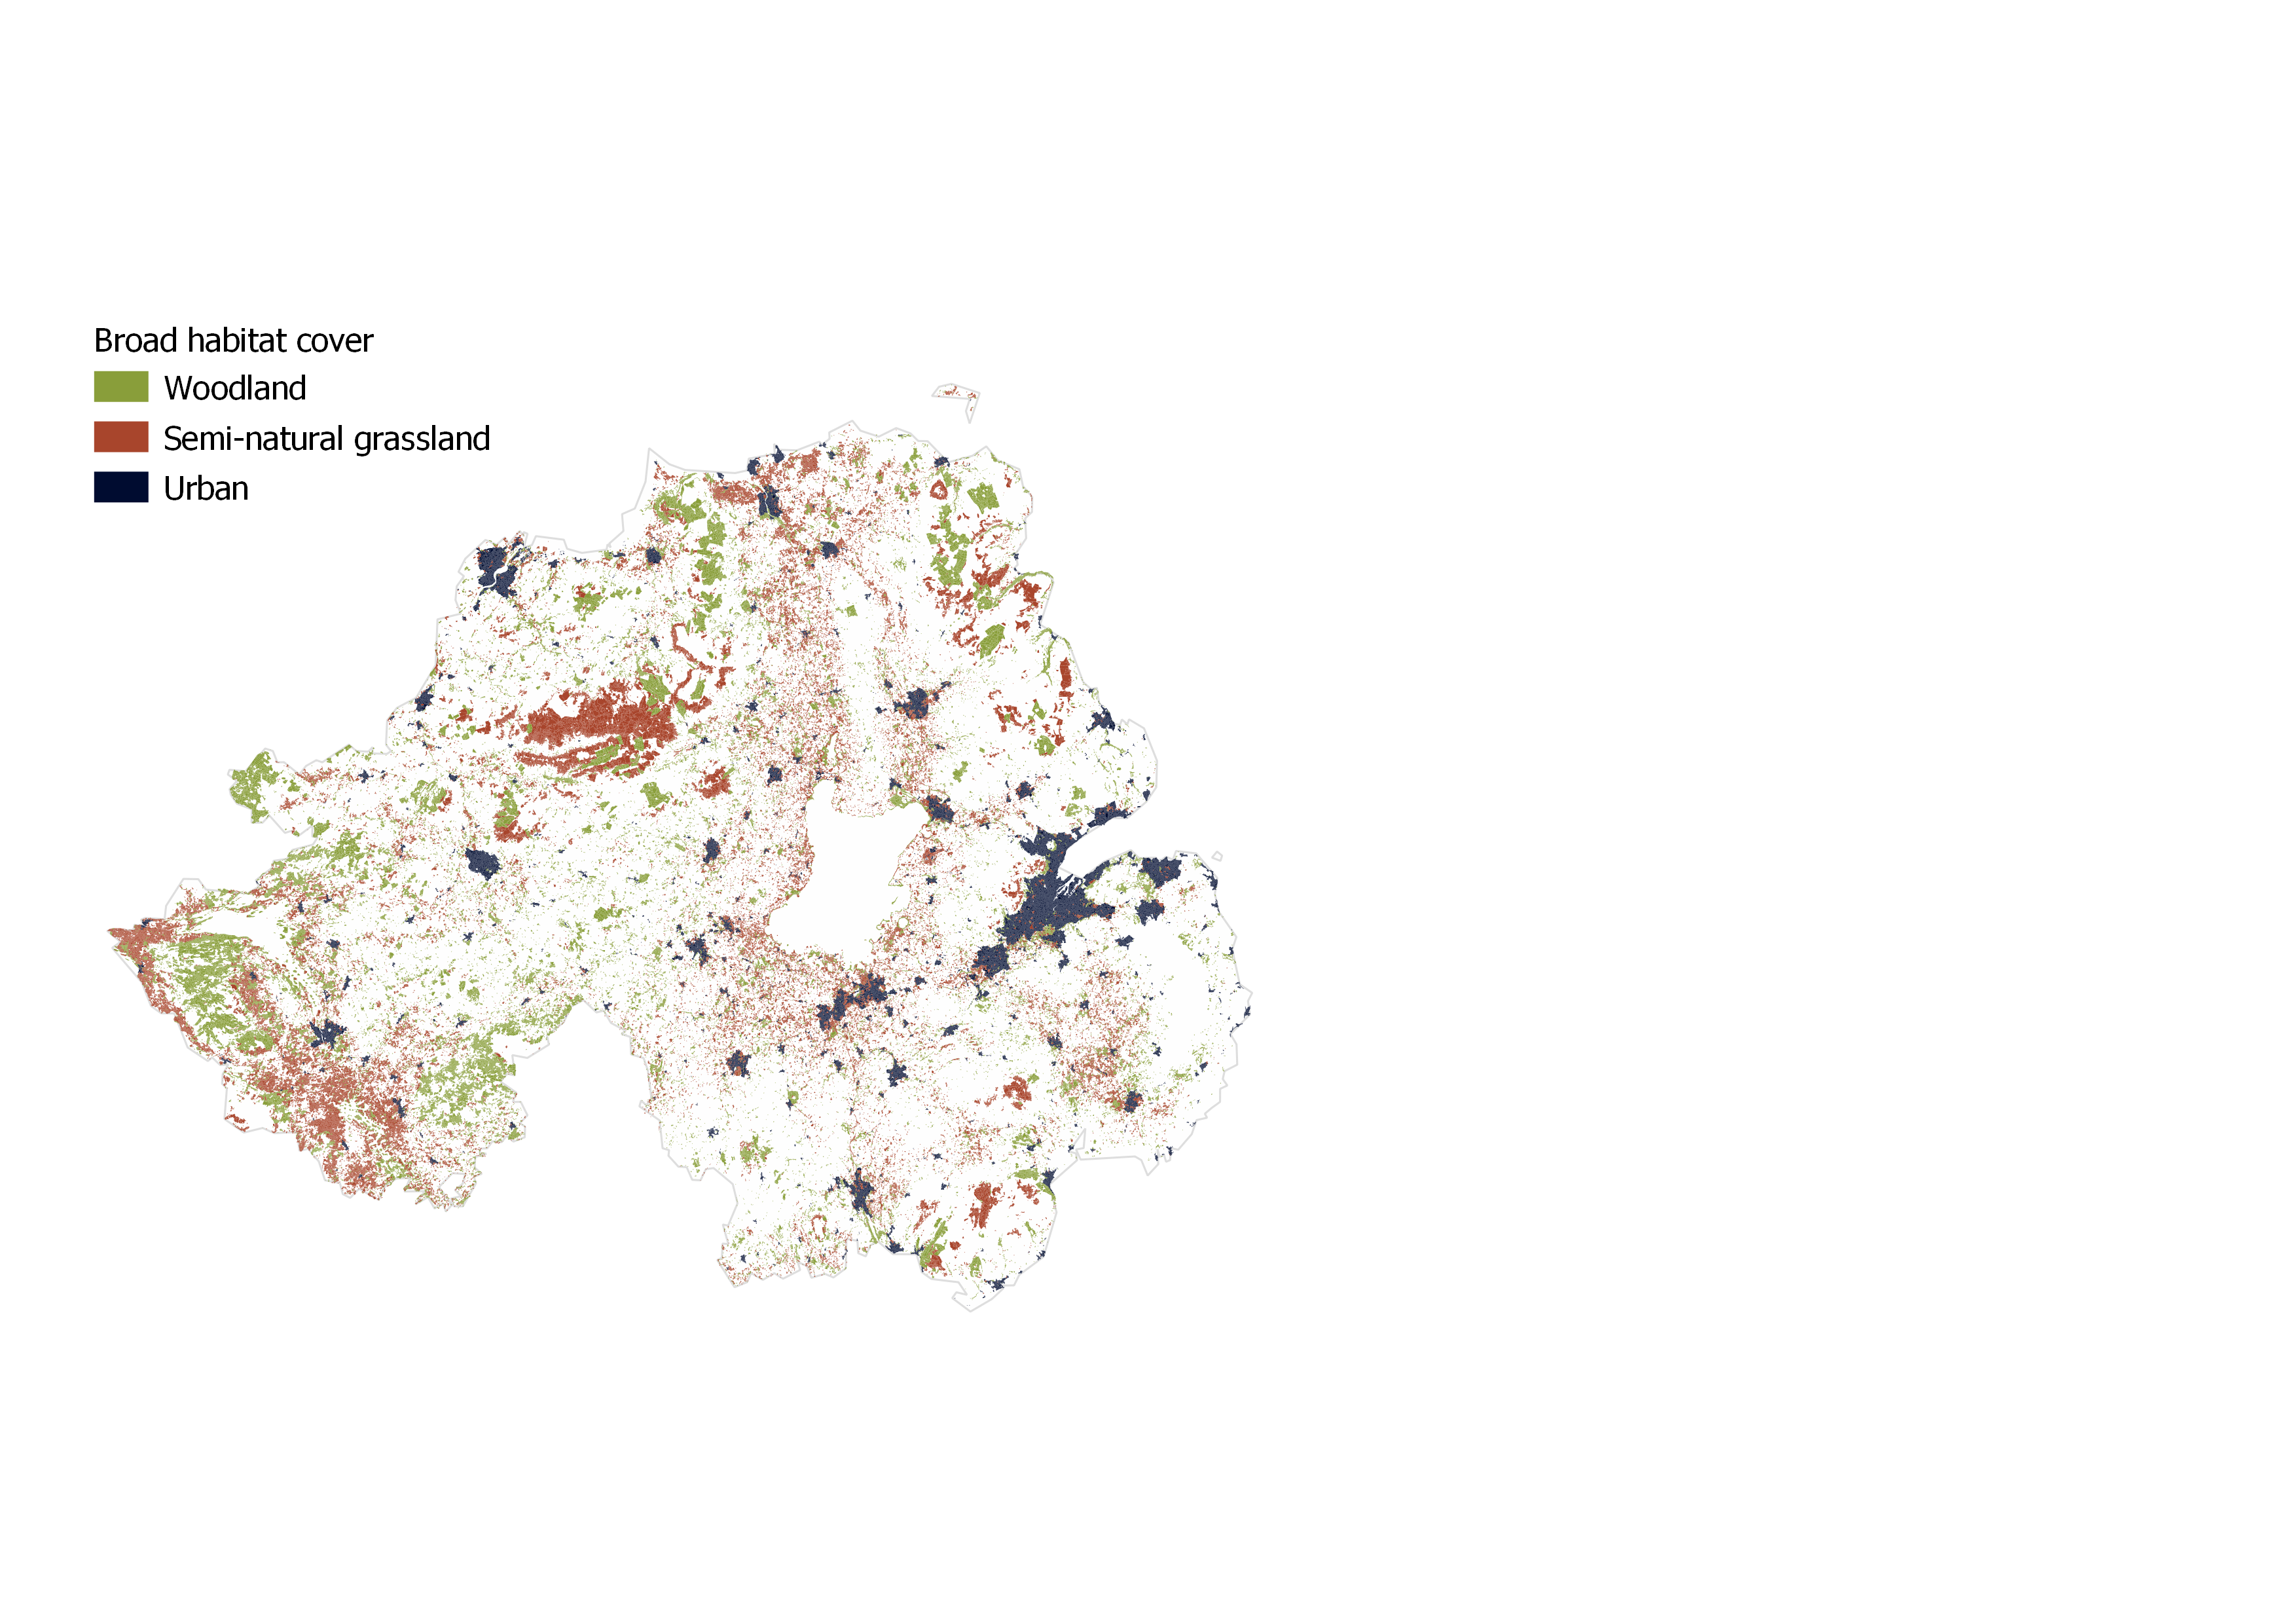
Source: Based upon Land Cover Map (LCM) 2019 © UK Centre for Ecology and Hydrology (UKCEH)
Notes:
Digital Object Identifier (DOI) for LCM2019 Vector data for Northern Ireland. All rights reserved. Land and Property Services © Crown Copyright and database right (2015) VARCA 100513. Based upon LCM2019 © UK Centre for Ecology and Hydrology. Contains Ordnance Survey data © Crown Copyright 2022. Contains public sector information licensed under the terms of the Open Government Licence v3.0. Morton, R. D., Marston, C. G, O’Neil, A. W., and Rowland, C. S. (2020). Land Cover Map 2019 (land parcels, N. Ireland) [Dataset]. NERC Environmental Information Data Centre.
Woodland includes coniferous and deciduous woodland habitats. Semi-natural grassland includes acid grassland, neutral grassland, and calcareous grassland. Urban includes urban and suburban habitats.
Download this image Figure 3: Map of woodland, urban, and semi-natural grassland broad habitats, Northern Ireland, 2019
.png (2.5 MB)
Because of different data sources, woodland extent values here differ from National Forest Inventory statistics in our Woodland natural capital account bulletin. This bulletin uses the UKCEH Land Cover Map as it covers all the broad habitats.
Back to table of contents3. Condition
The United Nations System of Environmental-Economic Accounting – Ecosystem Accounting (SEEA EA) is an integrated spatial statistical framework for organising biophysical information about ecosystems. It was developed to make the contributions of nature to the economy and people more visible and adopted by the United Nations Statistical Commission in March 2021.
SEEA EA:
measures ecosystem services
tracks changes in ecosystem extent and condition
values ecosystem services and asset
links this information to measures of economic and human activity
Condition indicators help us to understand the relationship between ecosystem condition and the ecosystem services they deliver. The SEEA definition of ecosystem condition (PDF, 605KB) is "the overall quality of an ecosystem asset in terms of its characteristics".
Figure 4 summarises the condition and long-term trends of physical, chemical, compositional, structural and landscape indicators for each broad UK habitat. A more detailed analysis for each habitat follows, including environmental pressure indicators. See our methodology publication for further details on condition indicators.
Figure 4: Summary long-term trend of condition indicators by broad habitat
Embed code
Notes:
- The condition indicators have varying geographies: UK, Great Britain, Scotland or England.
Download the data
Back to table of contents4. Woodland
Physical state indicator: Soil
Soil is important in woodlands for providing a fertile topsoil for trees and plants to grow their roots (PDF, 1.42MB). The Countryside Survey showed a decrease in soil acidity (increase in pH value, Table 1) of broadleaf woodland between 1978 and 2007 (PDF, 5.01MB), this is consistent with the decrease of acidity of soils across Great Britain, an expected benefit from sulphur emissions reductions in the 1980s. Coniferous woodland shows a much smaller decrease in acidity.
| Woodland | Indicator | 1978 | 1998 | 2007 |
|---|---|---|---|---|
| Broadleaf, mixed, and yew woodland Coniferous woodland | pH | 5.1 | 5.5 | 5.8 |
| 4.3 | 4.4 | 4.5 | ||
| Broadleaf, mixed, and yew woodland Coniferous woodland | Carbon concentrate (g C kg-1) | 62.4 | 102.2 | 88.7 |
| 203.7 | 222.0 | 197.8 | ||
| Broadleaf, mixed, and yew woodland Coniferous woodland | Loss of ignition (%) | 11.4 | 18.6 | 16.1 |
| 37.0 | 40.4 | 36.0 | ||
| Broadleaf, mixed, and yew woodland Coniferous woodland | Soil bulk density | 0.8 | ||
| 0.5 |
Download this table Table 1: Soil indicators for woodland, Great Britain, 1978, 1998 and 2007
.xls .csvCompositional species indicators for woodland
Species indicators are a useful indicator of wider habitat ecological health. Both the bees and the bats indicators have shown an increase in their indexes. The common pipistrelle (PDF, 6.95MB) is one of the three bat species in the bat index and their population in Great Britain is considered to have increased since 1999.
Species indicators in decline include those for butterflies, falling to an all-time low in 2012, and moths, in long-term decline from 1996. Woodland birds saw their greatest decline in the early 1980s to the early 1990s, driven by woodland specialist decline in willow tits, tree pipits, spotted flycatchers and lesser redpolls (PDF, 4.85MB).
Figure 5: The smoothed butterfly index declined by 44% between 1990 and 2020
Compositional woodland species for bats, bees, birds, butterflies and moths, Great Britain or UK
Embed code
Notes:
- Provisional index for bats for 2019 and 2020.
- Bats species in index: common pipistrelle, soprano pipistrelle, and noctule.
- The Rothamsted Insect Survey, a National Capability, is funded by the Biotechnology and Biological Sciences Research Council under the Core Capability Grant BBS/E/C/000J0200.
Download the data
National Forest Inventory
The National Forest Inventory (NFI) samples ecological data from over 15,000 woodland sites. Table 2 shows that no sites classed as favourable for the indicators for veteran trees – those of interest biologically, culturally or aesthetically – and the proportion of open space. Environmental and structural heterogeneity is improved with areas of open space in woodlands.
| Condition indicator | Unfavourable | Intermediate | Favourable | |||
|---|---|---|---|---|---|---|
| Area (hectares) | Percentage | Area (hectares) | Percentage | Area (hectares) | Percentage | |
| Compositional state | ||||||
| Tree health – Pests and diseases | 73,692 | 2 | 326,408 | 11 | 2,547,733 | 86 |
| Invasive species | 220,494 | 7 | 23,855 | 1 | 2,703,484 | 92 |
| Regeneration at component group level | 0 | 0 | 2,628,638 | 89 | 319,196 | 11 |
| Structural state | ||||||
| Number of native tree and/or shrub species | 1,402,259 | 48 | 585,098 | 20 | 960,477 | 33 |
| Deadwood volume (m3 per ha) | 2,250,883 | 76 | 515,164 | 17 | 181,787 | 6 |
| Vertical structure | 633,582 | 21 | 1,211,071 | 41 | 1,103,182 | 37 |
| Veteran trees | 2,928,501 | 99 | 5,645 | 0 | 13,688 | 0 |
| Age distribution of tree species | 1,189,376 | 40 | 1,421,369 | 48 | 337,089 | 11 |
| Proportion of open space | 2,419,080 | 82 | 525,399 | 18 | 3,354 | 0 |
Download this table Table 2: Summary of National Forest Inventory compositional and structural state condition indicators, Great Britain, 2010 to 2015 survey cycle
.xls .csvLandscape level indicator: Habitat connectivity
Habitat connectivity is a measure of how well different species can move between habitats in the landscape. The mean connectivity values (PDF, 4.85KB) for broadleaf, mixed and yew woodlands in England went from 0.0923 in 1990 to 0.0868 in 2007, having fallen as low as 0.0695 in 1998.
A different method is used in Scotland to calculate connectivity, and this provides river catchment-level statistics. Connectivity varies considerably across Scotland and between each catchment area for semi-natural woodland (Table 3). A higher value for the Equivalent Connected Area (Probability of Connectivity)or ECA(PC), shows greater connectivity, and is calculated as a percentage of total area of habitat in the region.
| Catchment | Area of habitat (hectares) | Number of patches | Equivalent Connected Area (Probability of Connectivity) (hectares) | Percentage Equivalent Connected Area (Probability of Connectivity) of total habitat |
|---|---|---|---|---|
| Argyll | 96,068 | 10,429 | 5,552 | 5.8 |
| Clyde | 91,665 | 16,356 | 3,421 | 3.7 |
| Forth | 50,498 | 10,887 | 2,259 | 4.5 |
| Orkney and Shetland | 255 | 67 | 110 | 43.1 |
| North East Scotland | 71,851 | 13,475 | 2,455 | 3.4 |
| North Highland | 93,187 | 12,618 | 4,164 | 4.5 |
| Solway | 90,922 | 12,327 | 4,770 | 5.2 |
| Tay | 58,861 | 11,181 | 2,341 | 4 |
| Tweed | 33,450 | 6,393 | 2,836 | 8.5 |
| West Highland | 33,786 | 4,462 | 3,200 | 9.5 |
Download this table Table 3: Scottish Equivalent Connected Area (Probability of Connectivity) values for catchment areas for semi-natural woodland, Scotland, 2017
.xls .csvAncillary woodland indicators
Herbivore damage
Herbivore damage negatively impacts on the ecological condition of woodland. The National Forest inventory for Great Britain between 2010 and 2015 shows the percentage of woodland area condition for herbivore damage was:
40% unfavourable
11% intermediate
49% favourable
Woodland wildfires
Wildfires can be considered a pressure indicator, as most wildfires are caused by humans, intentionally or not. In Wales, it was identified between April 2018 and March 2019 that around 7 out of 10 fires on woodland, grassland and crops were started deliberately (PDF, 2.54KB).
Since 2009 to 2010, the greatest number of woodland wildfire incidents and area burnt occurring in woodlands in England (Table 4) occurred in 2011 to 2012. There was a drought in the same period, with heatwave alerts in central, eastern, and southern England and in Wales.
| England | Scotland | Wales | ||||
|---|---|---|---|---|---|---|
| Woodland fires (NFI) | Woodland (LCM)(verified) | Woodland (LCM)(not verified) | Woodland | Woodland/forest – broadleaf/hardwood | Woodland/forest – conifers/softwood | |
| 2009 to 2010 | 5,128 | 284 | 1,225 | 850 | 14 | 35 |
| 2010 to 2011 | 6,182 | 374 | 1432 | 1,166 | 36 | 161 |
| 2011 to 2012 | 7,238 | 392 | 1,507 | 1,050 | 32 | 130 |
| 2012 to 2013 | 1,794 | 110 | 368 | 479 | 8 | 22 |
| 2013 to 2014 | 3,899 | 218 | 863 | 19 | 44 | |
| 2014 to 2015 | 2,360 | 137 | 626 | 15 | 30 | |
| 2015 to 2016 | 3,333 | 208 | 871 | 14 | 32 | |
| 2016 to 2017 | 2,570 | 188 | 610 | 7 | 17 | |
| 2017 to 2018 | 8 | 20 | ||||
| 2018 to 2019 | 48 | 130 | ||||
| 2019 to 2020 | 27 | 49 | ||||
| 2020 to 2021(p) | 39 | 99 | ||||
Download this table Table 4: Number of wildfire incidents in woodland for England, Scotland, and Wales, 2009 to 2010, to 2020 to 2021
.xls .csvProtected sites
There are several formal designations, including Special Areas of Conservation (SACs) and Sites of Special Scientific Interest (SSSIs). These are usually established because of rare fauna or flora, or important geological or physiological features, which make them areas of interest to science.
Sites classed as favourable in Scotland rose from 46% in 2007 to 50% in 2020 (Table 5).
| Condition | 2007 | 2010 | 2015 | 2018 | 2020 | |
|---|---|---|---|---|---|---|
| Broadleaf, mixed and yew woodland | Favourable | 186 | 229 | 223 | 211 | 203 |
| Recovering | 48 | 39 | 51 | 59 | 59 | |
| Unfavourable | 173 | 131 | 144 | 152 | 161 | |
| Broadleaf, mixed and yew woodland (upland) | Favourable | 2 | 10 | 12 | 12 | 12 |
| Recovering | 3 | 0 | 6 | 5 | 6 | |
| Unfavourable | 2 | 6 | 2 | 3 | 2 | |
| Coniferous woodland | Favourable | 32 | 38 | 37 | 38 | 36 |
| Recovering | 4 | 4 | 12 | 14 | 14 | |
| Unfavourable | 24 | 18 | 13 | 10 | 12 |
Download this table Table 5: Number of protected woodland sites by condition in Scotland, 2007, 2010, 2015, 2018 and 2020
.xls .csvFor England 40% of protected woodland sites were classed as favourable.
| Habitat | Condition | 2018 | 2022 |
|---|---|---|---|
| Hectares | Hectares | ||
| Broadleaf, mixed and yew woodland - Lowland | Favourable | 38,190 | 38,749 |
| Recovering | 36,849 | 35,211 | |
| Unfavourable | 3,658 | 5,077 | |
| Destroyed | 13 | 13 | |
| Broadleaf, mixed and yew woodland - Upland | Favourable | 6,269 | 6,093 |
| Recovering | 7,569 | 7,214 | |
| Unfavourable | 1,427 | 1,905 | |
| Destroyed | 37 | 37 | |
| Coniferous woodland | Favourable | 2,500 | 2,500 |
| Recovering | 21,785 | 21,052 | |
| Unfavourable | 40 | 40 | |
| Destroyed | 0 | 0 |
Download this table Table 6: Area of protected woodland sites in England by condition, 2018 and 2022
.xls .csvIn Wales, the number of protected woodland sites for broadleaf, mixed and yew woodland in 2020 by condition was:
30 sites favourable
112 sites unfavourable
169 sites unknown
Certified woodland
The UK's certified woodland is independently audited against the UK Woodland Assurance Standard, which promotes good forest practice. The area of certified woodland in the UK increased from 1,257 thousand hectares in March 2005 (42% total woodland) to 1,413 thousand hectares in March 2021 (44% total woodland).
Back to table of contents5. Enclosed farmland
Physical state indicator: Soil
Soils are a finite resource; one centimetre of topsoil can take up to 1,000 years to form. Topsoil is the fertile section of the soil profile that crops need to grow their roots. Topsoil can get washed off fields and carried out to sea during heavy rainfall events. It is estimated some hillside agricultural areas can lose more than 100 tonnes per hectare per year (PDF, 1.42KB).
The Countryside Survey identified the loss of carbon (0 to 15 centimetres depth) from the intensively managed arable and horticulture broad habitat in Great Britain. The carbon concentrate on arable and horticulture land has decreased 11% between 1978 and 2007 (PDF, 5.0MB) (Table 7).
| Enclosed farmland | Indicator | 1978 | 1998 | 2007 |
|---|---|---|---|---|
| Arable and horticultural Improved grassland | pH levels | 6.59 | 6.81 | 7.2 |
| 5.79 | 6.06 | 6.27 | ||
| Arable and horticultural Improved grassland | Carbon concentrate (g C kg-1) | 34.5 | 33.5 | 30.7 |
| 56.4 | 58.3 | 56.9 | ||
| Arable and horticultural Improved grassland | Loss of ignition (%) | 6.27 | 6.09 | 5.58 |
| 10.25 | 10.6 | 10.35 | ||
| Arable and horticultural Improved grassland | Soil bulk density | 1.23 | ||
| 0.97 |
Download this table Table 7: Soil indicators for farmland, Great Britain, 1978, 1998 and 2007
.xls .csvCompositional species indicators on farmland
Changes in farmland management (PDF, 4.85MB) since the 1970s have adversely affected many farmland species. The farmland bird index has been in long-term decline from 1978 (Figure 6). By contrast, the butterfly index has remained fairly stable.
The enclosed farmland smoothed bat index (Figure 6) has significantly increased since the base year of 1999. The common pipistrelle (PDF, 6.95KB) is one of the three species in this index and their population in Great Britain is considered to have increased since 1999.
Figure 6: The smoothed farmland bird index has declined by 57% between 1970 and 2019
Bat, bee, bird, butterfly and moth farmland species, Great Britain or UK
Embed code
Notes:
- Bats provisional Index for 2019 and 2020.
- Bats species in index: common pipistrelle, soprano pipistrelle, and noctule.
- The Rothamsted Insect Survey, a National Capability, is funded by the Biotechnology and Biological Sciences Research Council under the Core Capability Grant BBS/E/C/000J0200.
Download the data
Organic farms
In the UK, organic farming (ODT, 1.42MB) uses natural methods of production and pest control. The share of UK agricultural land that is organically farmed decreased by 32% between 2010 and 2020, with 3% of UK agricultural land in 2020 being organic (Figure 7).
Figure 7: Organic farming accounts for 3% of total agricultural land in 2020
Embed code
Download the data
Landscape indicators: Woodland and hedgerows on farmland
The proportion of woodland on UK farmland has increased from 1.6% in 1984 to 5.7% in 2020 (Figure 8). By contrast, the average length of hedges on farmland in Great Britain declined 23% between 1984 and 2007.
Figure 8: The percentage of woodland on farmland has steadily increased between 1984 and 2020
Woodland and linear features on farmland, Great Britain or UK
Embed code
Download the data
Ancillary enclosed farmland indicators
Wildfires
The Welsh Government identified in July 2018 that there were almost nine times more fires on grassland, woodland and cropped land compared with July 2017 (PDF, 2.55MB). There were 40% more sunshine hours and half the rainfall in July 2018 than in July 2017.
| England | Wales – primary | Wales – secondary | |||
|---|---|---|---|---|---|
| Arable | Improved grassland | Grassland, pasture, grazing, etc. | Stacked/baled and standing crop | Grassland, pasture, grazing, etc. | |
| 2009 to 2010 | 5,952 | 8,129 | 7 | 1,872 | |
| 2010 to 2011 | 5,995 | 8,116 | 7 | 2,293 | |
| 2011 to 2012 | 6,168 | 8,255 | 1 | 1,329 | |
| 2012 to 2013 | 2,437 | 2,775 | 0 | 595 | |
| 2013 to 2014 | 4,396 | 5,396 | 6 | 1,220 | |
| 2014 to 2015 | 3,140 | 3,708 | 1 | 942 | |
| 2015 to 2016 | 2,093 | 3,956 | 9 | 1,103 | |
| 2016 to 2017 | 1,967 | 3,528 | 6 | 33 | 535 |
| 2017 to 2018 | 3 | 27 | 635 | ||
| 2018 to 2019 | 10 | 24 | 1,446 | ||
| 2019 to 2020 | 5 | 21 | 721 | ||
| 2020 to 2021 (p) | 9 | 19 | 689 | ||
Download this table Table 8: Number wildfire incidents on enclosed farmland in England and Wales, 2009 to 2010, to 2020 to 2021
.xls .csvFertiliser and pesticide usage
A surplus of phosphorous and nitrogen from fertiliser can lead to environmental pollution, such as eutrophication of surface water. This can be limited through efficient use of fertiliser. Fertiliser used per tonne of produce declined 53% between 1985 and 2019.
Sustainable pest management (PDF, 918KB) is encouraged as it enhances UK biodiversity. Pesticide use for arable, potato storage, soft fruit and orchards has decreased by 60% between 1990 and 2020 (Figure 9).
Figure 9: Fertiliser per tonne of produce declined by 53% between 1985 and 2019
Tonnes of fertiliser used per tonne produce, UK 1985 to 2019 and total pesticide usage in tonnes, UK, 1990 to 2020 (all biomass less grazed biomass)
Embed code
Download the data
Protected sites
On enclosed farmland, 97% of protected sites were classed as favourable in both 2018 and 2022 (Table 9).
| Habitat | Condition | 2018 | 2022 |
|---|---|---|---|
| Hectares | Hectares | ||
| Arable and horticulture | Favourable | 13,755 | 13,828 |
| Recovering | 253 | 171 | |
| Unfavourable | 22 | 32 | |
| Improved grassland | Favourable | 1,097 | 963 |
| Recovering | 149 | 149 | |
| Unfavourable | 37 | 176 |
Download this table Table 9: Area of protected sites in England on enclosed farmland by condition, 2018 and 2022
.xls .csv6. Semi-natural grassland
Physical state indicator: Soil
The reduction in soil acidity (increase in pH) (PDF, 5.0MB) between 1978 and 2007, in neutral grassland, acid grassland and bracken (Table 10) is consistent with expected benefit of reductions in sulphur emissions from the 1980s.
| Semi-natural grasslands | Indicator | 1978 | 1998 | 2007 |
|---|---|---|---|---|
| Neutral grassland | pH | 5.5 | 6.0 | 6.1 |
| Acid grassland | 4.4 | 4.7 | 4.8 | |
| Bracken | 4.1 | 4.5 | 4.6 | |
| Neutral grassland | Carbon concentrate (g C kg-1) | 67.1 | 70.1 | 68.0 |
| Acid grassland | 235.1 | 256.7 | 228.5 | |
| Bracken | 155.2 | 154.7 | 195.9 | |
| Neutral grassland | Loss of ignition (%) | 12.2 | 12.8 | 12.4 |
| Acid grassland | 42.8 | 46.7 | 41.6 | |
| Bracken | 28.2 | 28.1 | 35.6 | |
| Neutral grassland | Soil bulk density | 0.9 | ||
| Acid grassland | 0.4 | |||
| Bracken | 0.4 |
Download this table Table 10: Summary semi-natural grassland soil indicators, Great Britain, 1978, 1998 and 2007
.xls .csvCompositional species indicators for semi-natural grassland
Natural England reported 97% of wildflower meadows have been lost since the 1930s, with the UK now having 1% of its land area as flower-rich grassland. The butterfly index for semi-natural grassland has declined by 61% between 1976 and 2020. The bird index has steadily declined 18% from 2005 to 2019. By contrast, the average number of bees in semi-natural grassland increased 32% between 2010 and 2020 (Figure 10).
Figure 10: The semi-natural grassland bird index has declined by 61% between 1976 and 2020
Bee, butterfly and bird species indicators for semi-natural grassland, Great Britain or UK
Embed code
Download the data
Landscape indicator: Habitat connectivity
Habitat connectivity is about a measure of how well different species can move between habitats in the landscape.
The developmental habitat connectivity statistics for England showed an increasing trend in the connectivity of neutral grasslands between 1990 and 2007. The mean functional connectivity values (PDF, 4.73MB) for neutral grasslands in England were:
0.3272 for 1990
0.7569 for 1998
0.8226 for 2007
A different method was used in Scotland to calculate connectivity. As Table 11 shows connectivity varies considerably across Scotland and between each catchment area for semi-natural grasslands. The Equivalent Connected Area (Probability of Connectivity) or ECA(PC) shows the higher the value the greater the connectivity. The ECA(PC) is calculated as a percentage of total amount of habitat in the region. While the semi-natural grasslands for Forth and the North Highland catchments have similar total areas, the Forth has a much higher ECA(PC), indicating this area is better connected.
| Area of habitat (hectares) | Number of patches | Equivalent Connected Area (Probability of Connectivity) (hectares) | Percentage Equivalent Connected Area (Probability of Connectivity) of total habitat | |
|---|---|---|---|---|
| Argyll | 83,985 | 4,248 | 5,111 | 6.1 |
| Clyde | 117,476 | 8,955 | 8,639 | 7.4 |
| Forth | 60,359 | 6,035 | 9,285 | 15.4 |
| Orkney and Shetland | 53,470 | 5,167 | 2,506 | 4.7 |
| North East Scotland | 57,491 | 11,788 | 1,342 | 2.3 |
| North Highland | 59,281 | 7,379 | 2,391 | 4 |
| Solway | 132,514 | 9,035 | 11,899 | 9 |
| Tay | 77,574 | 6,384 | 6,549 | 8.4 |
| Tweed | 94,870 | 5,612 | 10,113 | 10.7 |
| West Highland | 47,344 | 4,711 | 2,886 | 6.1 |
Download this table Table 11: Scottish Equivalent Connected Area (Probability of Connectivity) values per catchment area for semi-natural grassland, 2017
.xls .csvAncillary indicators for semi-natural grassland
Wildfires
Wildfires in England vary over the data time series, with a declining number of wildfires between 2013 to 2014 and 2016 to 2017 (Table 12).
| England | Scotland | |
|---|---|---|
| Semi-natural grassland | Semi-natural grassland | |
| 2009 to 2010 | 1,394 | 354 |
| 2010 to 2011 | 1,701 | 465 |
| 2011 to 2012 | 1,596 | 368 |
| 2012 to 2013 | 506 | 203 |
| 2013 to 2014 | 1,164 | |
| 2014 to 2015 | 722 | |
| 2015 to 2016 | 400 | |
| 2016 to 2017 | 250 |
Download this table Table 12: Number of wildfire incidents on semi-natural grassland in England and Scotland, 2009 to 2010, to 2016 to 2017
.xls .csvProtected sites
The number of designated protected sites, for either fauna, flora or important geological or physiological features, in Scotland that were classified as good increased from 38 in 2007 to 73 in 2020 (Table 13).
| Grasslands | Condition | 2007 | 2010 | 2015 | 2018 | 2020 |
|---|---|---|---|---|---|---|
| Acid grassland | Favourable | 3 | 5 | 6 | 8 | 7 |
| Recovering | 2 | 3 | 6 | 7 | 7 | |
| Unfavourable | 9 | 7 | 6 | 3 | 4 | |
| Acid grassland (upland) | Favourable | 0 | 0 | 0 | 0 | 0 |
| Recovering | 0 | 0 | 1 | 1 | 1 | |
| Unfavourable | 2 | 2 | 1 | 1 | 1 | |
| Calcareous grassland | Favourable | 8 | 14 | 16 | 16 | 16 |
| Recovering | 3 | 6 | 8 | 11 | 11 | |
| Unfavourable | 20 | 8 | 6 | 3 | 3 | |
| Calcareous grassland (upland) | Favourable | 7 | 7 | 14 | 15 | 17 |
| Recovering | 2 | 8 | 11 | 7 | 7 | |
| Unfavourable | 29 | 28 | 16 | 19 | 17 | |
| Neutral grassland | Favourable | 20 | 27 | 31 | 35 | 33 |
| Recovering | 7 | 9 | 15 | 11 | 10 | |
| Unfavourable | 33 | 19 | 11 | 11 | 14 |
Download this table Table 13: Number of protected grassland sites by condition, Scotland, 2007, 2010, 2015, 2018 and 2020
.xls .csvThe percentage area of protected sites on grassland in England classed as favourable was 44% in 2018 and 2022 (Table 14).
| Habitat | Condition | 2018 | 2022 |
|---|---|---|---|
| Hectares | Hectares | ||
| Neutral grassland – Lowland | Favourable | 23,782 | 23,292 |
| Recovering | 16,668 | 13,327 | |
| Unfavourable | 7,590 | 11,333 | |
| Destroyed | 52 | 52 | |
| Neutral grassland – Upland | Favourable | 1,655 | 1,639 |
| Recovering | 730 | 708 | |
| Unfavourable | 350 | 388 | |
| Destroyed | - | - | |
| Calcareous grassland – Lowland | Favourable | 19,390 | 19,836 |
| Recovering | 22,391 | 21,812 | |
| Unfavourable | 794 | 1,140 | |
| Destroyed | 193 | 193 | |
| Calcareous grassland – Upland | Favourable | 2,208 | 2,242 |
| Recovering | 5,751 | 4,114 | |
| Unfavourable | 244 | 1,848 | |
| Destroyed | - | - | |
| Acid grassland – Lowland | Favourable | 2,762 | 2,774 |
| Recovering | 5,103 | 5,154 | |
| Unfavourable | 546 | 804 | |
| Destroyed | 14 | 14 | |
| Acid grassland – Upland | Favourable | 10,730 | 10,318 |
| Recovering | 13,315 | 12,951 | |
| Unfavourable | 2,114 | 2,785 | |
| Destroyed | - | - |
Download this table Table 14: Area of protected sites on semi-natural grassland in England by condition, 2018 and 2022
.xls .csv
| Habitat | Condition | Number of sites |
|---|---|---|
| Neutral grassland | Favourable | 23 |
| Unfavourable | 65 | |
| Destroyed | 0 | |
| Unknown | 92 | |
| Calcareous grassland | Favourable | 3 |
| Unfavourable | 42 | |
| Destroyed | 1 | |
| Unknown | 32 | |
| Acid grassland | Favourable | 7 |
| Unfavourable | 18 | |
| Destroyed | 0 | |
| Unknown | 44 |
Download this table Table 15: Number of protected semi-natural grassland sites by condition, Wales, 2020
.xls .csv7. Mountain, moorland and heath
Physical state indicator: Soil
Soil information is important for understanding species distribution (PDF, 5.0MB). Dwarf shrub heath soils found on mountain, moorland and heath habitats have always been naturally acidic in Great Britain.
| MMH | Indicator | 1978 | 1998 | 2007 |
|---|---|---|---|---|
| Dwarf shrub heath | pH | 4.2 | 4.5 | 4.6 |
| Carbon concentrate (g C kg-1) | 305.3 | 298.7 | 284.9 | |
| Loss of ignition (%) | 55.5 | 54.3 | 51.8 | |
| Soil bulk density | 0.35 |
Download this table Table 16: Soil indicators for mountain, moorland and heath, Great Britain, 1978, 1998 and 2007
.xls .csvChemical state indicator: Water
The UK Uplands Water Monitoring Network investigates the chemical and biological responses of acidified streams and lakes to changes in air quality and “acid rain” and also investigates impacts of climate change and land management on these systems.
Upland water condition has improved from the reduction in concentrations of non-marine sulphate and the reduction of water acidity (increased pH) from 1996 to 2018 (Figure 11). Mean concentration of dissolved organic carbon, largely derived from the degradation of plant and soil organic material, often causing a brown staining to upland waters, roughly doubled between 1989 and 2018.
Figure 11: Mean concentration of dissolved organic carbon (DOC) roughly doubled between 1989 and 2018
Chemical levels in Uplands Water Monitoring Network, mountain, moorland and heath sites, upscaled to UK, 1989 to 2018
Embed code
Download the data
Compositional species indicators for mountain, moorland and heath
Our bird populations can provide a good indicator of the state of wildlife in the UK as they occupy a wide range of habitats and respond to environmental pressures. The unsmoothed bird index between 1994 and 2019 has increased by 12% (Figure 12). The moth index has been increasing over the data time series, with abundance showing a fourfold increase from 1991 to 2019. By contrast, the average total number of bees per kilometre walk decreased by 10% between 2010 and 2020.
Figure 12: The moth index shows abundance, having a fourfold increase from 1991 to 2019
Bee, bird and moth species for mountain, moorland and heath, Great Britain or UK
Embed code
Notes:
- The Rothamsted Insect Survey, a National Capability, is funded by the Biotechnology and Biological Sciences Research Council under the Core Capability Grant BBS/E/C/000J0200.
Download the data
Landscape indicators for mountain, moorland and heath
Habitat connectivity
Habitat connectivity metrics were created for 10 catchment areas using Equivalent Connected Area (Probability of Connectivity) or ECA(PC) in Scotland, which shows the higher the value the greater the connectivity. The ECA(PC) for heathland varies considerably across catchment areas in Scotland (Table 17), with the north east of Scotland having the highest connectivity value for heathland.
| Catchment | Area of habitat (hectares) | Number of patches | Equivalent Connected Area (Probability of Connectivity) (hectares) | Percentage Equivalent Connected Area (Probability of Connectivity) of total habitat |
|---|---|---|---|---|
| Argyll | 439,609 | 3,821 | 70,702 | 16.1 |
| Clyde | 136,377 | 3,112 | 19,741 | 14.5 |
| Forth | 46,452 | 1,547 | 10,357 | 22.3 |
| Orkney and Shetland | 117,259 | 1,645 | 24,381 | 20.8 |
| North East Scotland | 292,611 | 3,670 | 124,813 | 42.7 |
| North Highland | 799,628 | 4,152 | 190,200 | 23.8 |
| Solway | 74,238 | 2,824 | 10,587 | 14.3 |
| Tay | 275,735 | 2,307 | 105,796 | 38.4 |
| Tweed | 73,446 | 1,495 | 20,779 | 28.3 |
| West Highland | 702,291 | 3,861 | 150,880 | 21.5 |
Download this table Table 17: Scottish Equivalent Connected Area (Probability of Connectivity) values per catchment area for heathland, 2017
.xls .csvHedgerows
The Countryside Survey shows a decline in the mean length of hedgerows in mountain, moorland and heath in Great Britain from 1984 to 2007 (Figure 13).
In addition, it showed a decrease in species richness score (PDF, 29.4MB) of surveyed plots alongside linear features on moorland for Great Britain from a mean value of 22.2 in 1998 to 18.9 in 2007.
Figure 13: The average length of hedges decreased by 24% since 1984
Average length, thousand kilometres, linear features mountain, moorland and heath, Great Britain, 1984, 1990, 1998 and 2007
Source: UK Centre for Ecology and Hydrology – Countryside Survey
Download this chart Figure 13: The average length of hedges decreased by 24% since 1984
Image .csv .xlsAncillary indicators for mountain, moorland and heath
Wildfires
The number of wildfire incidents, a pressure indicator (see previously), varies across Great Britain, with 2010 to 2011 being the highest in the data time series for England and Wales (Table 18).
| England – Mountain, heath and bog | Scotland – Mountain, heath and bog | Wales – primary – Heathland or moorland | Wales – secondary – Heathland or moorland | |
|---|---|---|---|---|
| 2009 to 2010 | 392 | 154 | 8 | 866 |
| 2010 to 2011 | 547 | 211 | 15 | 1,038 |
| 2011 to 2012 | 506 | 199 | 18 | 736 |
| 2012 to 2013 | 142 | 153 | 3 | 343 |
| 2013 to 2014 | 283 | 8 | 470 | |
| 2014 to 2015 | 181 | 3 | 349 | |
| 2015 to 2016 | 201 | 4 | 446 | |
| 2016 to 2017 | 145 | 4 | 225 | |
| 2017 to 2018 | 3 | 310 | ||
| 2018 to 2019 | 25 | 495 | ||
| 2019 to 2020 | 4 | 275 | ||
| 2020 to 2021 (p) | 4 | 287 |
Download this table Table 18: Number of wildfire incidents on mountain, heath and bog for England, Scotland, and Wales, 2009 to 2010, to 2020 to 2021
.xls .csvProtected sites
The number of designated protected sites in mountain, moorland and heath, because of fauna, flora or important geological or physiological feature, in Scotland, in a favourable condition rose from 182 in 2007 to 281 in 2020 (Table 19).
| Heathland and inland rock | Condition | 2007 | 2010 | 2015 | 2018 | 2020 |
|---|---|---|---|---|---|---|
| Dwarf shrub heath | Favourable | 5 | 16 | 18 | 18 | 18 |
| Recovering | 4 | 4 | 5 | 10 | 10 | |
| Unfavourable | 16 | 3 | 10 | 5 | 5 | |
| Dwarf shrub heath (upland) | Favourable | 40 | 45 | 47 | 55 | 58 |
| Recovering | 6 | 16 | 30 | 24 | 23 | |
| Unfavourable | 59 | 59 | 37 | 35 | 33 | |
| Inland rock | Favourable | 108 | 120 | 127 | 135 | 136 |
| Recovering | 0 | 4 | 11 | 8 | 7 | |
| Unfavourable | 24 | 27 | 19 | 13 | 13 | |
| Montane | Favourable | 29 | 41 | 48 | 67 | 69 |
| Recovering | 5 | 9 | 19 | 12 | 12 | |
| Unfavourable | 50 | 55 | 39 | 29 | 27 |
Download this table Table 19: Number of protected mountain, moorland, and heath sites by condition in Scotland, 2007, 2010, 2015, 2018 and 2020
.xls .csvThe area of designated protected sites in England classed as favourable increased from 18% in 2018 to 19% in 2022 (Table 20).
| Habitat | Condition | 2018 | 2022 |
|---|---|---|---|
| Hectares | Hectares | ||
| Dwarf shrub heath – Lowland | Favourable | 21,569 | 22,692 |
| Recovering | 26,784 | 24,809 | |
| Unfavourable | 3,232 | 4,177 | |
| Destroyed | 15 | 15 | |
| Dwarf shrub heath – Upland | Favourable | 19,151 | 20,062 |
| Recovering | 157,203 | 148,700 | |
| Unfavourable | 4,671 | 12,267 | |
| Destroyed | 11 | 11 | |
| Montane habitats | Favourable | 108 | 108 |
| Recovering | 1,242 | 948 | |
| Unfavourable | 16 | 310 | |
| Destroyed | - | - | |
| Inland rock | Favourable | 2,492 | 2,468 |
| Recovering | 4,612 | 4,562 | |
| Unfavourable | 740 | 816 | |
| Destroyed | 9.6 | 9.6 |
Download this table Table 20: Area of protected sites on mountain, moorland, and heath by condition in England, 2018 and 2022
.xls .csv
| Habitat | Condition | Number of sites |
|---|---|---|
| Dwarf shrub heath | Favourable | 8 |
| Unfavourable | 90 | |
| Destroyed | 0 | |
| Unknown | 86 | |
| Inland rock | Favourable | 6 |
| Unfavourable | 10 | |
| Destroyed | 0 | |
| Unknown | 37 | |
| Montane habitats | Favourable | 1 |
| Unfavourable | 3 | |
| Destroyed | 0 | |
| Unknown | 5 |
Download this table Table 21: Number of protected mountain, moorland, and heath sites by condition in Wales, 2020
.xls .csv8. Freshwater, wetlands and floodplain
Physical state: Soil
While the soils of fen, marsh and swamp became less acidic over the same period, there was no major change in mean soil acidity (pH level) in the more acidic, organic-rich soils found in bogs (PDF, 5.0MB) across Great Britain between 1978 and 2007 (Table 22).
| Freshwater, wetlands, floodplain | Indicator | 1978 | 1998 | 2007 |
|---|---|---|---|---|
| Fen, marsh, and swamp Bog | pH | 4.6 | 5.4 | 5.5 |
| 4.3 | 4.5 | 4.5 | ||
| Fen, marsh, and swamp Bog | Carbon concentrate (g C kg-1) | 231.7 | 252.8 | 228.6 |
| 411.8 | 449.9 | 432.9 | ||
| Fen, marsh, and swamp Bog | Loss of ignition (%) | 42.1 | 46.0 | 41.6 |
| 74.9 | 81.8 | 78.7 | ||
| Fen, marsh, and swamp Bog | Soil bulk density | 0.45 | ||
| 0.17 |
Download this table Table 22: Soil indicators for freshwater, wetlands and floodplain, Great Britain, 1978, 1998 and 2007
.xls .csvWater quality
The Water Framework Directive helps assess the water environment for water bodies, including rivers, lakes and canals. The overall condition of each body of water is examined and categorised into one of five classifications, ranging from "Bad" to "High" condition status. As shown in Table 23 there has been very little change in the number of rivers and canals classed as "Good" and "High" in each classification.
| Classification | High | Good | Moderate | Poor | Bad |
|---|---|---|---|---|---|
| 2009 | 2 | 30 | 50 | 14 | 4 |
| 2010 | 2 | 30 | 49 | 15 | 4 |
| 2011 | 2 | 31 | 47 | 17 | 4 |
| 2012 | 2 | 31 | 47 | 17 | 4 |
| 2013 | 2 | 31 | 46 | 17 | 4 |
| 2014 | 2 | 29 | 47 | 19 | 3 |
| 2015 | 2 | 29 | 49 | 17 | 3 |
| 2016 | 2 | 29 | 48 | 17 | 4 |
| 2017 | 2 | 29 | 49 | 16 | 4 |
| 2018 | 2 | 30 | 48 | 16 | 4 |
| 2019 | 2 | 30 | 48 | 16 | 3 |
| 2020 | 3 | 30 | 49 | 16 | 3 |
Download this table Table 23: Percentage of UK surface water bodies awarded each status for rivers and canals, under the Water Framework Directive, 2009 to 2020
.xls .csvWhile the share of lakes classified as “High” and “Moderate” has risen, the share classed as “Good” has fallen from 37% in 2009 to 22% in 2020 (Table 24).
| Classification | High | Good | Moderate | Poor | Bad |
|---|---|---|---|---|---|
| 2009 | 6 | 37 | 44 | 10 | 3 |
| 2010 | 5 | 38 | 44 | 10 | 3 |
| 2011 | 5 | 38 | 44 | 11 | 2 |
| 2012 | 6 | 32 | 46 | 14 | 2 |
| 2013 | 6 | 31 | 46 | 14 | 2 |
| 2014 | 5 | 33 | 44 | 15 | 2 |
| 2015 | 9 | 28 | 47 | 13 | 2 |
| 2016 | 10 | 21 | 57 | 11 | 1 |
| 2017 | 10 | 21 | 57 | 11 | 1 |
| 2018 | 10 | 22 | 56 | 12 | 1 |
| 2019 | 10 | 22 | 55 | 11 | 1 |
| 2020 | 10 | 22 | 55 | 11 | 1 |
Download this table Table 24: Percentage of UK surface water bodies awarded each status for lakes, under the Water Framework Directive, 2009 to 2020
.xls .csvCompositional species indicators for freshwater, wetlands and floodplains: Bees, bats and birds
The total average number of bees varies over the data time series, however, the average number of queen bees has declined from 2012 to 2020 (Figure 14). The wetland bird smoothed index decreased 15% between 1975 and 2019.
The freshwater bat smoothed index was higher than the baseline year between 2003 and 2008, then the number declined to 2020. This bat index uses the Daubenton's bat, which is considered to have a stable bat population in Great Britain (PDF, 6.95MB).
Figure 14: Wetland birds decreased by 15% between 1975 and 2019
Bee, bat and bird species indicators for freshwater, wetland and floodplains, Great Britain or UK
Embed code
Notes:
- Bats provisional Index for 2019 and 2020.
- Bats species in index: common pipistrelle, soprano pipistrelle, and noctule.
Download the data
Compositional state indicator: Freshwater salmonids
Trout and salmon catch data are recorded to manage fish stocks. The number of rod-caught and retained salmon and trout has decreased by 94% in Great Britain between 1996 and 2020 (Figure 15). Fixed engine fishing is an ancient practice used in the UK as a general descriptor of stationary fishing gears, fixed to the bed or bank; this has declined 94% between 1994 and 2020.
Figure 15: The number of rod-caught and retained salmon and trout has decreased by 94% between 1996 and 2020
Salmon and trout caught in rivers in Great Britain
Embed code
Download the data
Structural state indicator: Invasive species
The Joint Nature Conservation Committee invasive species indicator for freshwater includes species that have arrived since 1500. It shows the change in the number of invasive non-native species that have become established across 10% or more of Great Britain's land area. Between 1960 and 2019, the number of non-native freshwater species has more than doubled from 21 to 46 (Figure 16).
Figure 16: The number of non-native freshwater species has more than doubled from 1960 to 2019
Number of non-native species in freshwater established in or along 10% of land area, Great Britain, 1960 to 1969 and 2010 to 2019
Source: Botanical Society of Britain and Ireland; British Trust for Ornithology; UK Centre for Ecology and Hydrology; Marine Biological Association; National Biodiversity Network
Notes:
- Level 1 – not/scarcely established, Level 2 – established but still generally absent or most occasional, Level 3 – established and frequent in part of the territory and Level 4 –widespread.
Download this chart Figure 16: The number of non-native freshwater species has more than doubled from 1960 to 2019
Image .csv .xlsLandscape level indicators for freshwater, wetlands and floodplain
Habitat connectivity
In Scotland, habitat connectivity metrics were created for 10 catchment areas using Equivalent Connected Area (Probability of Connectivity) or ECA(PC) with higher values meaning greater connectivity. The ECA(PC) for fen, marsh and swamp varies considerably across catchment areas in Scotland (Table 25), with the Tweed having the highest connectivity value for fen, marsh and swamp.
| Catchment | Area of habitat (hectares) | Number of patches | Equivalent Connected Area (Probability of Connectivity) (hectares) | Percentage Equivalent Connected Area (Probability of Connectivity) of total habitat |
|---|---|---|---|---|
| Argyll | 1,232 | 884 | 135 | 11 |
| Clyde | 292 | 256 | 54 | 18.5 |
| Forth | 393 | 169 | 100 | 25.3 |
| Orkney and Shetland | 972 | 664 | 113 | 11.6 |
| North East Scotland | 540 | 146 | 153 | 28.3 |
| North Highland | 2,393 | 630 | 531 | 22.2 |
| Solway | 2,932 | 348 | 1,010 | 34.4 |
| Tay | 586 | 162 | 161 | 27.4 |
| Tweed | 35 | 24 | 12 | 33.7 |
| West Highland | 2,018 | 1,283 | 200 | 9.9 |
Download this table Table 25: Scottish Equivalent Connected Area (Probability of Connectivity) values per catchment area for fen, marsh, and swamp, 2017
.xls .csvRiver naturalness
"River naturalness" refers to the extent to which a river has departed from its original state. The chemical, biological, hydrological and physical habitat change indicators can assist in interpreting the overall condition of the river.
England
In England, hydrological, physical habitat, biological and chemical integrity scores are investigated, and the number of river water bodies with limiting naturalness scores in 2017 was:
9,485 for physical integrity
1,281 for biological integrity
879 for chemical integrity
152 hydrological integrity
Wales
In Wales, rivers were assessed using a Hydromorphological Impact Ratio (PDF, 1.18MB), which looks at the physical character and water content of water bodies. For 2007 to 2008, the areas with highest departure from naturalness are south east and south central Wales (Table 26).
| Impact ratio (%) | Very low | Low | Moderate | High | Very high |
|---|---|---|---|---|---|
| Mid Wales | 1.8 | 10.4 | 35.3 | 34.4 | 18.1 |
| North East Wales | 0 | 7 | 45.6 | 26.3 | 21.1 |
| North West Wales | 1.3 | 6.9 | 38.8 | 39.4 | 13.8 |
| South Central Wales | 0 | 8.5 | 17 | 48.9 | 25.5 |
| South East Wales | 2.2 | 4.3 | 10.9 | 52.2 | 30.4 |
| South West Wales | 2.3 | 11.6 | 25.4 | 41 | 19.7 |
Download this table Table 26: Comparison of hydromorphological impact ratio categories for Welsh areas, 2007 to 2008
.xls .csvScotland
In Scotland, the surface water bodies environment are assessed as part of river basin management plans, including looking at physical changes to the riverbeds and banks, such as straightening or culverting, and barriers to fish migration, such as dams and weirs. The percentage of water environment condition classed as good or better condition in 2020 for Scotland (PDF, 608MB) was:
water quality – 87%
water resources – 90%
fish migration – 88%
physical condition – 90%
Ancillary indicators for freshwater, wetland and floodplain
Pollution incidents from sewerage
Pollution by discharges or escapes of contaminants into rivers are recorded by the water companies. The number of pollution incidents has decreased by 34% in Great Britain between 2011 (3,316 pollution incidents) and 2019 (2,194 incidents).
Protected sites
In Scotland the number of designated protected sites classed as favourable condition on wetlands has risen from 509 in 2007 to 609 in 2020 (Table 27).
| Wetlands | Condition | 2007 | 2010 | 2015 | 2018 | 2020 |
|---|---|---|---|---|---|---|
| Bogs (Upland) | Favourable | 121 | 116 | 120 | 128 | 126 |
| Recovering | 13 | 18 | 22 | 29 | 29 | |
| Unfavourable | 46 | 55 | 47 | 34 | 36 | |
| Bogs (Wetland) | Favourable | 33 | 64 | 69 | 74 | 74 |
| Recovering | 30 | 20 | 20 | 28 | 27 | |
| Unfavourable | 45 | 27 | 26 | 13 | 14 | |
| Fen, marsh and swamp (Grassland) | Favourable | 19 | 22 | 23 | 25 | 25 |
| Recovering | 1 | 6 | 3 | 2 | 3 | |
| Unfavourable | 14 | 3 | 7 | 6 | 5 | |
| Fen, marsh and swamp (Upland) | Favourable | 34 | 41 | 49 | 55 | 56 |
| Recovering | 0 | 9 | 12 | 7 | 7 | |
| Unfavourable | 30 | 17 | 10 | 9 | 9 | |
| Fen, marsh and swamp (Wetland) | Favourable | 145 | 155 | 166 | 171 | 170 |
| Recovering | 4 | 22 | 25 | 27 | 25 | |
| Unfavourable | 72 | 42 | 39 | 36 | 38 | |
| Rivers and streams | Favourable | 6 | 6 | 6 | 6 | 3 |
| Recovering | 0 | 0 | 0 | 0 | 0 | |
| Unfavourable | 5 | 5 | 3 | 3 | 6 | |
| Standing open water and canals | Favourable | 151 | 161 | 156 | 155 | 155 |
| Recovering | 6 | 4 | 5 | 8 | 51 | |
| Unfavourable | 51 | 41 | 51 | 52 | 9 |
Download this table Table 27: Number of protected wetlands sites in Scotland by condition, 2007, 2010, 2015, 2018 and 2020
.xls .csvIn England, the area of designated protected sites classed as favourable for freshwater and wetlands is 19% for 2018 and 2022 (Table 28).
| Habitat | Condition | 2018 | 2022 |
|---|---|---|---|
| Hectares | Hectares | ||
| Fen, marsh and swamp – Lowland | Favourable | 10,073 | 9,731 |
| Recovering | 13,825 | 13,694 | |
| Unfavourable | 2,222 | 3,122 | |
| Destroyed | 18 | 18 | |
| Fen, marsh and swamp – Upland | Favourable | 894 | 886 |
| Recovering | 1,332 | 1,313 | |
| Unfavourable | 375 | 412 | |
| Destroyed | 0 | 0 | |
| Bogs – Lowland | Favourable | 744 | 702 |
| Recovering | 7,189 | 7,194 | |
| Unfavourable | 1,437 | 1,475 | |
| Destroyed | 27 | 27 | |
| Bogs – Upland | Favourable | 21,735 | 19,661 |
| Recovering | 148,817 | 139,005 | |
| Unfavourable | 11,032 | 23,004 | |
| Destroyed | 0 | 0 | |
| Rivers and streams | Favourable | 1,228 | 1,182 |
| Recovering | 4,215 | 3,933 | |
| Unfavourable | 2,830 | 2,766 | |
| Destroyed | 0 | 0 | |
| Standing open water and canals | Favourable | 13,994 | 15,233 |
| Recovering | 5,144 | 4,726 | |
| Unfavourable | 4,743 | 5,712 | |
| Destroyed | 7 | 12 |
Download this table Table 28: Area of protected freshwater, wetlands, and floodplain sites in England by condition, 2018 and 2022
.xls .csv
| Habitat | Condition | Number of sites |
|---|---|---|
| Fen, marsh and swamp | Favourable | 22 |
| Unfavourable | 142 | |
| Destroyed | 2 | |
| Unknown | 255 | |
| Standing open water and canals | Favourable | 17 |
| Unfavourable | 54 | |
| Destroyed | 1 | |
| Unknown | 20 | |
| Bogs | Favourable | 8 |
| Unfavourable | 50 | |
| Destroyed | 0 | |
| Unknown | 25 | |
| Rivers and streams | Favourable | 2 |
| Unfavourable | 30 | |
| Destroyed | 0 | |
| Unknown | 9 | |
| Freshwater lake | Favourable | 0 |
| Unfavourable | 4 | |
| Destroyed | 0 | |
| Unknown | 0 |
Download this table Table 29: Number of protected freshwater, wetlands, and floodplain sites in Wales by condition, 2020
.xls .csv9. Coastal margins
Compositional species indicators for coastal margins
The total wintering waterbird index has increased from the 1975 baseline to a peak in the late 1990s, then declined. The smoothed index in 2018 stands 90% above its 1975 baseline (Figure 17).
The average number of queen bees has declined by 27% from 2010 to 2020, and the average total bees by 24% in the same period. The coastal moth index has steadily declined from 1995 and has decreased 88% from 1990 to 2019.
Figure 17: The wintering waterbird index has increased by 90% between 1975 and 2018
Bee, bird and moth species indicators for coastal margins, Great Britain or UK
Embed code
Notes:
- The Rothamsted Insect Survey, a National Capability, is funded by the Biotechnology and Biological Sciences Research Council under the Core Capability Grant BBS/E/C/000J0200.
Download the data
Landscape level indicator: Hedgerows
The average length of hedgerows on coastal habitats has decreased by 39% from 1984 to 2007 in Great Britain.
Figure 18: The average length of hedges in coastal habitats has decreased by 39% in Great Britain between 1984 and 2007
Linear coastal features, Great Britain, 1984, 1990, 1998 and 2007
Source: UK Centre for Ecology and Hydrology – Countryside Survey
Download this chart Figure 18: The average length of hedges in coastal habitats has decreased by 39% in Great Britain between 1984 and 2007
Image .csv .xlsAncillary coastal indicators
Wildfires
The number of wildfire incidents in coastal, freshwater and saltwater habitats in England increased between 2009 and 2012, with a peak of 450 incidents in 2010 to 2011. The number then decreased in 2012 to 2013, to 134 incidents, but increased the following year (2013 to 2014) to 267 incidents. Since then, the number of wildfire incidents has been decreasing, with 161 incidents recorded in 2016 to 2017.
Protected sites
In Scotland, the number of designated protected sites, for fauna, flora or important geological or physiological features, classed as favourable condition on coastal sites, has risen from 222 in 2007 to 276 in 2020 (Table 30).
| Coastal | Condition | 2007 | 2010 | 2015 | 2018 | 2020 |
|---|---|---|---|---|---|---|
| Littoral sediment (coast) | Favourable | 44 | 50 | 57 | 60 | 60 |
| Recovering | 2 | 5 | 1 | 3 | 3 | |
| Unfavourable | 21 | 10 | 10 | 5 | 5 | |
| Supralittoral sediment (coast) | Favourable | 107 | 125 | 134 | 135 | 133 |
| Recovering | 3 | 17 | 15 | 12 | 12 | |
| Unfavourable | 67 | 33 | 28 | 30 | 32 | |
| Supralittoral rock (coast) | Favourable | 71 | 72 | 80 | 83 | 83 |
| Recovering | 0 | 4 | 3 | 2 | 2 | |
| Unfavourable | 19 | 14 | 6 | 4 | 4 |
Download this table Table 30: Number of protected coastal sites in Scotland by condition, 2007, 2010, 2015, 2018 and 2020
.xls .csvThe area of designated protected coastal sites classed as favourable in England dropped from 31% in 2018 to 30% in 2022 (Table 31).
| Habitat | Condition | 2018 | 2022 |
|---|---|---|---|
| Hectares | Hectares | ||
| Supralittoral rock | Favourable | 4,872 | 4,518 |
| Recovering | 1,652 | 1,709 | |
| Unfavourable | 171 | 468 | |
| Destroyed | 0 | 0 | |
| Supralittoral sediment | Favourable | 3,977 | 4,347 |
| Recovering | 8,983 | 7,990 | |
| Unfavourable | 1,634 | 1,747 | |
| Destroyed | 29 | 29 | |
| Inshore sublittoral sediment | Favourable | 922 | 939 |
| Recovering | 222 | 135 | |
| Unfavourable | 452 | 496 | |
| Destroyed | 23 | 23 | |
| Littoral rock | Favourable | 2,840 | 2,804 |
| Recovering | 364 | 364 | |
| Unfavourable | 72 | 108 | |
| Destroyed | 0 | 0 | |
| Littoral sediment | Favourable | 169,720 | 166,335 |
| Recovering | 91,670 | 84,804 | |
| Unfavourable | 11,359 | 22,833 | |
| Destroyed | 20 | 8 |
Download this table Table 31: Area of protected coastal sites in England by condition, 2018 and 2022
.xls .csvIn Wales the numbers of protected sites by condition in 2020 and their condition for supralittoral sediment were:
6 favourable
21 unfavourable
30 unknown
For supralittoral rock there were:
4 favourable
8 unfavourable
24 unknown
10. Marine
Physical state: Water
The Water Framework Directive helps assess the water environment for water bodies, including estuaries and coastal, with classifications from "Bad" to "High" condition (see previously). There is a small improvement in the number of estuaries and coastal water bodies classed as "Good" and "High" between 2009 and 2020 (Table 32).
| Classification | High | Good | Moderate | Poor | Bad |
|---|---|---|---|---|---|
| 2009 | 23 | 47 | 29 | 1 | 0 |
| 2010 | 23 | 49 | 26 | 1 | 1 |
| 2011 | 20 | 54 | 25 | 1 | 1 |
| 2012 | 20 | 55 | 24 | 1 | 1 |
| 2013 | 22 | 53 | 24 | 1 | 1 |
| 2014 | 18 | 55 | 25 | 1 | 1 |
| 2015 | 22 | 52 | 25 | 1 | 0 |
| 2016 | 23 | 49 | 25 | 1 | 1 |
| 2017 | 21 | 55 | 22 | 1 | 1 |
| 2018 | 21 | 55 | 23 | 1 | 1 |
| 2019 | 21 | 55 | 23 | 1 | 1 |
| 2020 | 21 | 55 | 23 | 1 | 1 |
Download this table Table 32: Percentage of UK surface water bodies awarded each status for estuaries and coastal, under the Water Framework Directive, 2009 to 2020
.xls .csvCompositional state indicators
Seabirds
The UK seabird index in 2019 was 24% lower than in 1986 (Figure 19).
Figure 19: The UK seabird index decreased by 24% between 1986 and 2019
Seabird index 1986 = 100, UK, 1986 to 2019
Source: Joint Nature Conservation Committee
Download this chart Figure 19: The UK seabird index decreased by 24% between 1986 and 2019
Image .csv .xlsSustainable fishing
Fish are an integral component of marine biodiversity, an important food source for seabirds and aquatic mammals, as well as a source of food and employment for people. The Joint Nature Conservation Committee states that sustainable fisheries help to ensure our marine ecosystems remain diverse and resilient, providing a long-term and viable fishing industry.
Among the 57 marine stocks fished in an acceptable mortality range, stocks exploited at or below the maximum sustainable yield (FMSY), increased from 9% in 1990 to 51% in 2019 (Figure 20).
Figure 20: Fish stocks exploited at or below and in the FMSY range were 51% in 2019
Percentage pressure of marine fish stocks of UK interest exploited with respect to FMSY (fishing maximum sustainable yield), 1990 to 2019
Source: International Council for the Exploration of the Sea, Centre for Environment, Fisheries and Aquaculture Science and Joint Nature Conservation Committee
Download this chart Figure 20: Fish stocks exploited at or below and in the FMSY range were 51% in 2019
Image .csv .xlsInvasive species
The Joint Nature Conservation Committee invasive species indicator for freshwater includes species that have arrived since 1500. It shows the change in number of invasive non-native species that have established across 10% or more of Great Britain's coastline extent. Between 1960 and 2019, the number of non-native freshwater species has risen from 15 to 37 (Figure 21).
Figure 21: The number of widespread invasive species has risen to 13 between 2010 and 2019
Number of non-native species in marine areas established in or along 10% of the total coastline, Great Britain, 1960 to 1969 and 2010 to 2019
Source: Botanical Society of Britain and Ireland, British Trust for Ornithology, UK Centre for Ecology and Hydrology, Marine Biological Association, National Biodiversity Network
Notes:
- Level 1 – not/scarcely established, Level 2 – established but still generally absent or most occasional, Level 3 – established and frequent in part of the territory and Level 4 – widespread.
Download this chart Figure 21: The number of widespread invasive species has risen to 13 between 2010 and 2019
Image .csv .xlsAncillary marine indicators
Sea litter
Accounting for methodological changes – which beaches are included and variations in the number of volunteers across years – the density of plastic-related litter on beaches seems to have declined between 2008 and 2021 (Figure 22).
Figure 22: Long-term trend in a reduction of plastic-related sea litter
Median count plastic litter. 100 metre beach cleans, UK, 2008 to 2020
Source: Marine Conservation Society
Notes:
- 2020 data should not be compared with other years as number of volunteers collecting litter was significantly smaller.
Download this chart Figure 22: Long-term trend in a reduction of plastic-related sea litter
Image .csv .xlsBlue Flag awards
The Blue Flag certification (PDF, 416KB) (Figure 23) has 33 individual targets including water quality, including bathing water quality for resort beaches with facilities. Water samples must be taken no longer than 31 days apart throughout the Blue Flag season.
Figure 23: The number of Blue Flags awarded in the UK has increased by 53% from 2018
Number of Blue Flag awards by country, 2018 to 2021
Source: Blue Flag
Notes:
- Data for Scotland are not available for 2020.
Download this chart Figure 23: The number of Blue Flags awarded in the UK has increased by 53% from 2018
Image .csv .xlsProtected sites
In Scotland, the number of designated protected marine sites classed as favourable has risen from 76 in 2018 to 102 in 2020 (Table 33).
| Marine | Condition | 2007 | 2010 | 2015 | 2018 | 2020 |
|---|---|---|---|---|---|---|
| Inshore sublittoral rock (marine) | Favourable | 16 | 18 | 21 | 21 | 21 |
| Recovering | 0 | 0 | 0 | 0 | 0 | |
| Unfavourable | 1 | 1 | 1 | 1 | 1 | |
| Inshore sublittoral sediment (marine) | Favourable | 28 | 29 | 31 | 31 | 30 |
| Recovering | 0 | 0 | 0 | 0 | 0 | |
| Unfavourable | 0 | 0 | 0 | 0 | 0 | |
| Littoral rock (marine) | Favourable | 9 | 11 | 12 | 11 | 11 |
| Recovering | 0 | 0 | 0 | 0 | 0 | |
| Unfavourable | 0 | 0 | 0 | 0 | 0 | |
| Littoral sediment (marine) | Favourable | 23 | 25 | 37 | 38 | 40 |
| Recovering | 0 | 0 | 0 | 0 | 0 | |
| Unfavourable | 0 | 0 | 1 | 1 | 1 |
Download this table Table 33: Number of protected marine sites in Scotland by condition, 2007, 2010, 2015, 2018 and 2020
.xls .csv11. Urban
Compositional species indicators
The urban smoothed bat index has gradually increased from 2003, and by 2020 was 28% higher than the base year of 1999. The number of moths found in urban areas has been largely stable between 1990 and 2019, while the urban unsmoothed bird index has also remained fairly consistent between 1994 and 2019.
Figure 24: The smoothed bat index rose by 28% for Great Britain urban areas between 1999 and 2020
Bat, bird and moth species indicators for Urban, Great Britain or UK
Embed code
Notes:
- Provisional data for 2019 and 2020 index.
- Species in index: common pipistrelle, soprano pipistrelle, and noctule.
The Rothamsted Insect Survey, a National Capability, is funded by the Biotechnology and Biological Sciences Research Council under the Core Capability Grant BBS/E/C/000J0200.
Download the data
Ancillary urban indicators
Wildfires
In England, there were 11,199 wildfire incidents in built-up areas and gardens in 2016 to 2017, the latest period with available figures. This was lower than the previous year (2015 to 2016), which saw 13,115 incidents.
Previously, the number of urban wildfire incidents was higher between 2009 and 2012, with the highest number of incidents in 2011 to 2012 (23,750 incidents).
Urban green spaces
Outdoor green and blue space in urban areas, such as parks, gardens, rivers and lakes are important for well-being. Of the approximately 1.77 million hectares of urban area in Great Britain, 0.55 million hectares are classified as natural land cover, 31%. In 2020, one in eight households (12%) has no access to a private or shared garden.
| England | Scotland | Wales | Great Britain | |
|---|---|---|---|---|
| Extent (hectares) | ||||
| Urban area | 1,502,000 | 176,000 | 91,000 | 1,768,000 |
| Natural land cover | 456,700 | 64,700 | 27,600 | 549,000 |
| Blue space | 17,900 | 2,500 | 1,000 | 21,400 |
| Functional green space | 107,600 | 12,700 | 4,500 | 124,800 |
| Publicly accessible green space | 73,600 | 7,710 | 3,300 | 84,610 |
| Proportion of urban area (percentage) | ||||
| Natural land cover | 30 | 37 | 30 | 31 |
| Blue space | 1 | 1 | 1 | 1 |
| Functional green space | 7 | 7 | 5 | 7 |
| Publicly accessible green space | 5 | 4 | 4 | 5 |
| Number of sites | ||||
| Functional green space | 53,085 | 5,500 | 3,700 | 62,300 |
| Publicly accessible green space | 35,900 | 3,300 | 2,400 | 41,600 |
Download this table Table 34: Extent of urban green spaces, hectares, Great Britain, 2017
.xls .csvGreen Flag awards
The Green Flag Award (PDF, 3.0MB) is a scheme that recognises and rewards well-managed parks and green spaces, a standard for the management of UK recreational outdoor spaces. The number of Green Flag awards has increased 26%, from 1,404 in 2017 to 1,765 in 2021.
Figure 25: The number of Green Flag awards in the UK has increased by 26% since 2017
Number of Green Flag awards by country, 2017 to 2021
Source: Keep Britain Tidy
Download this chart Figure 25: The number of Green Flag awards in the UK has increased by 26% since 2017
Image .csv .xlsProtected sites
The area of designated protected urban sites classed as favourable in England decreased from 39 hectares in 2018 to 23 hectares in 2022. Those sites classed as recovering stayed the same at 1.7 hectares in 2018 and 2022, while those classed as unfavourable also increased, from 3.3 hectares to 19.8 hectares, in the same period. Those sites classed as destroyed stayed the same over the period, at 15.2 hectares.
Back to table of contents12. System of Environmental Economic Accounting (SEEA) condition summary
We have used the new United Nations System of Environmental-Economic Accounting (SEEA) template for creating extent and condition metrics, to organise the biophysical data for natural capital accounting. This has highlighted data gaps (Table 35 and Figure 4).
This includes data that appear for at least one year between 2010 and 2020. The compositional state is relatively well-covered, with indicators for most of the eight broad habitats, including for bats, bees, birds, moths and butterflies. However, there are significant data gaps for physical state, chemical state, structural state (other than woodlands), functional state and landscape-level characteristics.
Using the SEEA format to organise these data helps to create an index of condition over time. We were unable to calculate the SEEA Ecosystem Condition Index (ECI) for all habitats because of data gaps. The supplementary tables accompanying this bulletin include the full index, with available data for each part of the natural capital accounts.
This provides a starting point to gather new datasets to enable future natural capital accounting to report changes of values over time for ecosystem condition.
| Physical state | Chemical state | Compositional state | Structural state | Functional state | Landscape level characteristics | Total | |
|---|---|---|---|---|---|---|---|
| Enclosed Farmland | 0 | 0 | 5 | 0 | 0 | 1 | 6 |
| Woodland | 0 | 0 | 8 | 6 | 0 | 0 | 14 |
| Semi-natural grassland | 0 | 0 | 3 | 0 | 0 | 0 | 3 |
| Mountain, moorland, and heath | 0 | 2 | 3 | 0 | 0 | 0 | 5 |
| Freshwater, wetlands, and floodplain | 2 | 0 | 5 | 1 | 0 | 0 | 8 |
| Coastal margins | 0 | 0 | 3 | 0 | 0 | 0 | 3 |
| Marine | 1 | 0 | 2 | 1 | 0 | 0 | 4 |
| Urban | 0 | 0 | 3 | 0 | 0 | 0 | 3 |
| Total | 3 | 2 | 32 | 8 | 0 | 1 |
Download this table Table 35: Summary of the number of condition indicators, UK: 2010 to 2020
.xls .csv13. Habitat extent and condition, natural capital data
Habitat extent, natural capital, UK – supplementary tables
Dataset| Released 3 May 2022
The extent of the eight broad habitats needed to present habitat-based natural capital accounts.
Habitat condition, natural capital, UK – supplementary information
Dataset| Released 3 May 2022
Suitable condition indicators for an understanding of the relationship between the ecosystem condition and the ecosystem services they deliver.
Habitat SEEA condition, natural capital, UK – supplementary information
Dataset| Released 3 May 2022
Creation of extent and condition metrics, to organise the biophysical data for natural capital accounting, using the new United Nations System of Environmental-Economic Accounting (SEEA) template.
14. Glossary
Ecosystem services
Ecosystem services are the flows of benefits that people gain from natural ecosystems. This includes provisioning services such as food and water; regulating services such as flood protection and pollution removal; and cultural services such as recreation and heritage.
Natural capital
Natural capital is a way of measuring and valuing the benefits that the natural world provides society. These benefits from natural resources include food, cleaning the air of pollution, sequestering carbon, and cleaning fresh water.
Back to table of contents15. Measuring the data
In this release, the condition accounts for eight broad habitats are presented in two sections:
the size of the area covered by semi-natural (extent account)
indicators of the quality of the semi-natural ecosystem and ability to continue supplying services (condition account)
The data underpinning the eight broad habitats come from a range of sources with different timeliness and coverage. This release is based on the most recent data as at March 2022.
Data sources include:
Bat Conservation Trust
Blue Flag
British Trust for Ornithology (BTO)
Bumblebee Conservation Trust
Butterfly Conservation (BC)
Countryside Survey
Department for Environment, Food and Rural Affairs (Defra)
Department of Agriculture, Environment and Rural Affairs (DAERA)
Environment Agency
Food and Environment Research Agency (FERA)
Forest Research
Forestry Commission Scotland
Forestry England
International Council for the Exploration of the Sea
Joint Nature Conservation Committee (JNCC)
Keep Britain Tidy
Marine Conservation Society
National Biodiversity Network
Natural England
NatureScot
Natural Resources Wales
Ordnance Survey
Rothamsted Insect Survey
Royal Society for the Protection of Birds
Scottish Environment Protection Agency
UK Centre for Ecology and Hydrology
Welsh Government
The Office for National Statistics's (ONS's) natural capital accounts are produced in partnership with the Department for Environment, Food and Rural Affairs (Defra).

16. Strengths and limitations
Data quality
The UK Natural Capital Accounts are Experimental Statistics. Currently, there is no single data source for the UK for the individual condition indicators. These are calculated from data from the four UK countries and often have different timeliness.
Condition indicators provide a diverse range of data on the health of an ecosystem and not all have been included in this publication, either because of unavailability of data or the need for new methods of evaluation. We intend to continue to develop our ability to report on all condition indicators as recommended by the United Nations System of Environmental-Economic Accounting (SEEA).
Back to table of contents