Table of contents
- Introduction
- The production boundary – defining the labour share
- Data sources for numbers of self-employed in UK
- The sources of income for the household sector and how they contribute to the labour share boundary
- Labour share estimations
- International comparisons of the labour share
- Conclusion
- Further work
- Authors and acknowledgements
1. Introduction
The article is part of an analytical series undertaken by Office for National Statistics (ONS) to develop our understanding of trends in the economy, which are driving changes in labour productivity. In this article, we explore the labour share of national income, and how changing patterns of employment in the modern economy, specifically the number of self-employed persons, may lead us to reconsider how this is calculated.
The growth in self-employed persons has been a prominent feature of the UK labour market in recent years. The number of self-employed increased from 3.3 million people (12.0% of the labour force) in 2001 to 4.8 million (14.8% of the labour force) in 2017. While self-employment income, or “mixed income” as defined in the UK National Accounts has become a larger share of total household income, this increase in relation to the growth in the number of self-employed is small. Mixed income as a share of total household income only increased by 0.5 percentage points to 8.4% between 2001 and 2017. In comparison, compensation of employees, which makes up the largest share of total household income, increased from 61.9% to 66.2% over the same period, showing that compensation of employees grew faster than mixed income, and continues to increase its share of total household income.
This divergence between self-employment numbers and mixed income could be partly attributed to the classification of the self-employed in the UK National Accounts. The self-employed are a broad group with varied characteristics, which makes classifying the self-employed and their respective income, within the Accounts complex. This classification is dependent on various factors, placing different types of self-employed worker either into the household or non-financial corporation sector. There are practical difficulties in completing this allocation, which can will have an impact on the estimation of mixed income.
The labour share of income estimates the income received by labour in the generation of value added, which includes both compensation of employees and mixed income. The heterogeneous practices across countries in allocating the producer or enterprise units to different sectors of the national accounts can lead to difficulties in making international comparisons of the labour share.
This article begins by explaining the role of the labour share in the production boundary. It then presents the sources of income for the household sector, where the self-employed are classified, and how there incomes are positioned under the labour share boundary. It then discusses the treatment of mixed income in the labour share and analyses alternative approaches for calculating this share based on the labour contributions of mixed income to the production boundary and gross value added (GVA). The methods compare the UK, France, Italy, Germany and Spain and discuss the heterogenous approaches that countries experience when recording mixed income from self-employment. The article concludes by proposing further research into understanding the labour share in the UK economy, which would reflect the adapting evolution of employment compensation and its contribution within the production boundary, within the economic framework of accounts.
Back to table of contents2. The production boundary – defining the labour share
Figure 1 shows the income flows which result from the generation of output within the production boundary. From the production approach, gross value added (GVA) is the difference between the output of goods and services produced in an economy and the goods and services that were used up or transformed in the production process of creating the output.
Figure 1: Gross value added for production boundary and income components.

Source: Office for National Statistics
Download this image Figure 1: Gross value added for production boundary and income components.
.png (19.0 kB)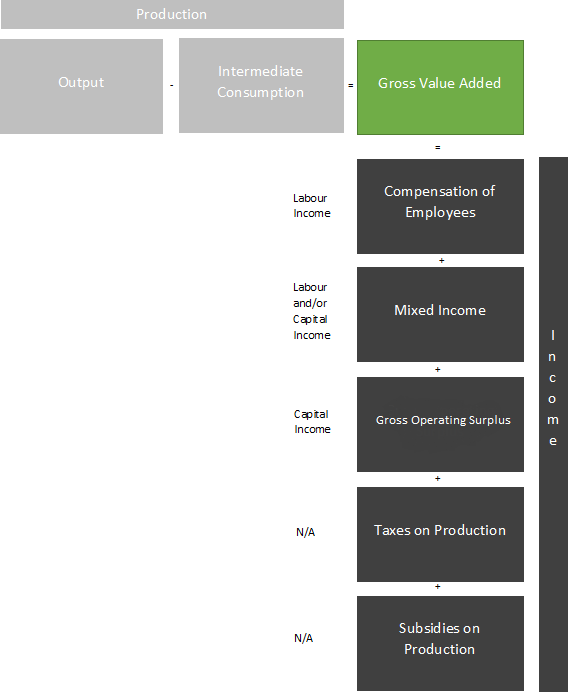
Whilst the concept of value added initially appears in the production account, the primary distribution of income account shows how GVA is distributed back into the economy in the form of compensation of employees, for the labour resources, gross operating surplus for the corporations and mixed income for the self-employed.
The labour share is defined as the share of GVA that accrues to labour, as opposed to that fraction which accrues to capital, or more particularly the owners of capital. Understanding the labour share allows us to link information at the macroeconomic level in national accounts and the level of the households, understand inequality in the personal distribution of income and drill into difference sources of income (Atkinson, 2009).
The shares of GVA accruing to labour and capital may well change over time and it is helpful to understand how the proceeds of economic growth are accruing. If the return to labour for example, grows faster than GVA over time, then the labour share increases. If, by contrast, the labour share is falling, the proceeds of economic growth are absorbed by the owners of capital.
Here, the measure of labour compensation used is compensation of employees, which comprises of the wages and salaries in both cash and in kind, paid to workers in return for their labour – as well as the social contributions paid by employers which include pension contributions and non-pension contributions such as social security payments or other employment-related social insurance schemes.
The self-employed do not count as employees, as they are sole proprietorships and partnerships. Therefore, they are not captured within the compensation of employees component. Instead they contribute to the mixed income component because their rewards are, conceptually, a mix of the return from their labour investment, but also the return on whatever capital, tangible or intangible, they have invested in their firm. Mixed income therefore contains an element corresponding to remuneration for work carried out by the members of the households, but also an element reflecting the profits due to work carried out as an entrepreneur. Therefore, it is neither strictly wages nor profits alone and hence it is referred to mixed income of the household sector.
As such, how should we treat the contribution of mixed income as it accrues to both labour and capital jointly? To answer this, we will explore the different methods used to apportion mixed income between labour and capital in Section 4.
Back to table of contents3. Data sources for numbers of self-employed in UK
Estimates of the number of the self-employed are sourced from the Labour Force Survey (LFS). This is a household survey that collects data on employment status, where individuals are asked to classify themselves either as employees, as self-employed, in government-support training or as an unpaid family worker. However, the survey also covers employers, own-account workers, members of producers’ co-operatives as well as those engaged in the production of economic goods and services for their own and their household consumption. This broad definition does not identify the legal framework of the business activity and whether it has a legal accountability for the losses and debts, neither does it distinguish the independence and autonomy in decision-making between the business activity and the household, nor does it clarify whether the business activity can produce a separate set of accounts, which would all be important criteria for classifying an economic producer in the correct sector.
Individuals working in the medical profession are a good example of the broad differences in the self-employed boundaries between the national accounts and the LFS. The LFS classifies General Practitioners (GPs) and dentists as self-employed. In practice however, they can either earn an income from self-employment or they can earn a salary as compensation of employees. Whilst the number of people working as GPs from the LFS will record these individuals as self-employed, the national accounts will source data on their earnings from different sources, depending on the nature of their employment: income of those GPs who are self-employed will be sourced from HMRC Self-Assessment data and form part of mixed income, whilst income of those GPs who are employees will be sourced from the HM Revenue and Customs (HMRC) Pay As You Earn (PAYE) system and will therefore be included in compensation of employee, and correctly excluded from mixed income.
To make things even more complex the LFS also asks self-employed individuals information about other methods of payment received aside from receiving a salary or wage direct from an employer. This gives the self-employed the option to select the following categories:
- Paid a salary or a wage by an employment agency.
- A sole director of your own limited business.
- Running a business or a professional practice.
- A partner in a business or a professional practice.
If a self-employed individual is receiving a salary or a wage, that income is likely to be recorded on the PAYE1. In 2010 to 2011 the National Insurance Lower Estimate Limit was £97, meaning individuals earning over this amount were required to be registered on the PAYE system and included in compensation of employees. The remaining three other categories do not clarify whether the producing unit they work in, or they own, as self-employed individuals is an autonomous business with independent decision-making capabilities from the household it operates in, which may be classified as a private non-financial corporation.
Mapping these responses of people recording themselves as self-employed from the LFS to their economic activities as producer units, and therefore the classification of the “self-employed” is very important to the labour share calculation. Understanding whether individuals receive a regular wage from the business or whether they receive a dividend or a combination of both can provide a picture of how income may be distributed as compensation for the employment provided or whether it is re-distributed because of ownership of financial or other assets, that is capital income. It is important to maintain consistent classification of these transactions across the non-financial and financial accounts to prevent distortion of our labour share estimates at an aggregate level. To examine whether and how the self-employed can impact the overall labour share in the economy, it is also important to understand the household income components and where they are sourced from. 2.
Notes for: Data sources for numbers of self-employed in UK
In 2010 to 2011 the National Insurance Lower Estimate Limit was £97, meaning individuals earning over this amount were required to be registered on the PAYE system.
SNA Reference chapter 24 and chapter 25.
4. The sources of income for the household sector and how they contribute to the labour share boundary
Focusing on the allocation of primary income account1, there are four broad sources of income earned by the households, that is from employment for those who are employees, mixed income for those who are self-employed and from a return on making their financial resources available in the form of property income.
Compensation of employees, which consist of the wages and salaries in income and in kind as well as the employers’ social contributions. These individuals will typically be employees, who receive remuneration in return for offering their employment services.
Gross operating surplus, which is an adjustment for the owner-occupiers’ imputed rental. This is to account for home owners that live in their own house and consume their own housing services, as opposed to renting.
Mixed income, which is the income of the self-employed as defined in the national accounts, mainly captures the sole proprietors and the unincorporated enterprises.
Property income, which is the reward paid to households as owners of financial assets and natural resources when they place them at the disposal of other institutional units. They are subdivided into dividends, interest and rent.
Figure 2: The proportion of each national income component contributing to the total households' resources. Compares how the composition has changed from 2001 to 2008 to 2017
2001, 2008 and 2017
Source: Office for national Statistics
Download this chart Figure 2: The proportion of each national income component contributing to the total households' resources. Compares how the composition has changed from 2001 to 2008 to 2017
Image .csv .xlsCompensation of employees is the largest income source of households; accounting for 66.2% of their primary income resource in 2017, followed by operating surplus and mixed income accounting for 11.2% and 8.4% respectively in 2017. Combined, these components account for over 85% of households’ income resources. The remaining 15% of households’ income resources are from financial resources and therefore outside the production boundary.
Looking at the total resources of households’ national income only compensation of employees and mixed income contribute to “labour share”, as this is a return on labour input. Gross operating surplus of the households is the sector’s imputed rental income of owner-occupied dwellings, after deducting the corresponding intermediate consumption for repairs and maintenance and insurance, financial intermediation services indirectly measured (FISIM) and cross border property income. As this is simply an imputed adjustment, there is no labour input in the production process and thus all value added is allocated to the capital share.
Withdrawals from the income of quasi-corporations are the amounts that entrepreneurs withdraw for their own use from the profits earned by quasi-corporations which belong to them3. Quasi-corporations are classified in the private corporations’ sector, rather than the households’ sector and are therefore excluded from the “self-employed”. When quasi-corporations make a trading profit, the owners may choose to leave part or all the profit in the business, especially for investment purposes. This income left in the business is a saving by the quasi-corporation and only the profits withdrawn by the owners are recorded in the accounts under this heading. Similarly, dividends, interest, earnings on property investment and other investment income are all sources of property income rather than a resource from providing labour input, and therefore, these transactions are excluded in the labour component of the labour share.
Distinguishing the boundaries between the income generated from the distribution of value added and the income from financial resources, that is property income in the form of dividends can now help define the labour share boundary and in turn, the labour share of income.
Notes for: The sources of income for the household sector and how they contribute to the labour share boundary
- See table 6.2.3 Income and Capital Accounts Blue Book 2017.
- The income relating to second homes in the UK which are owned by non-residents.
- ESA 2010 para 4.58.
5. Labour share estimations
As we have now defined the labour share boundary, Figure 3 shows the unadjusted labour share of income for the UK, which is estimated as compensation of employees over gross value added (GVA) at basic prices. As this only includes the income received by employees in the production of value added, it is unadjusted for the mixed income of the self-employed. While this would underestimate the total labour income received, it provides a general indicator on how the labour share of income has been performing for those persons who work as employees.
Figure 3: The labour share, unadjusted for mixed income
Q1 (Jan to Mar) 1955 to Q4 (Oct to Dec) 2017, UK
Source: Office for National Statistics
Download this chart Figure 3: The labour share, unadjusted for mixed income
Image .csv .xlsIn the UK, the labour share is estimated to have fallen between the mid-1960s and the mid-1990s, increasing sharply in the late-1990s and has remained relatively stable since (Figure 3). Short-term movements in the labour share tend be driven by changes in the business cycle. Wages and salaries paid to labour tend to be more stable and adjust more slowly in response to changes in economic conditions, while the return to capital – largely comprising gross operating surplus – tends to be more volatile. However, despite these short-term movements, there are clear longer-term trends. Between the mid-1960s and the late 1990s, the share of national income accruing to labour in the UK fell from around 65% to close to 50% – despite a marked recovery in the mid-1970s. This downwards trend reversed between the late-1990s and the early-2000s, before stabilizing between 55% and 60% of gva. These data suggest that over the long term, the proportion of gva accruing to labour has fallen by around 10 percentage points or, equivalently, that as the economy has grown, a smaller fraction of the income generated has been returned to labour.
The treatment of mixed income in the labour share
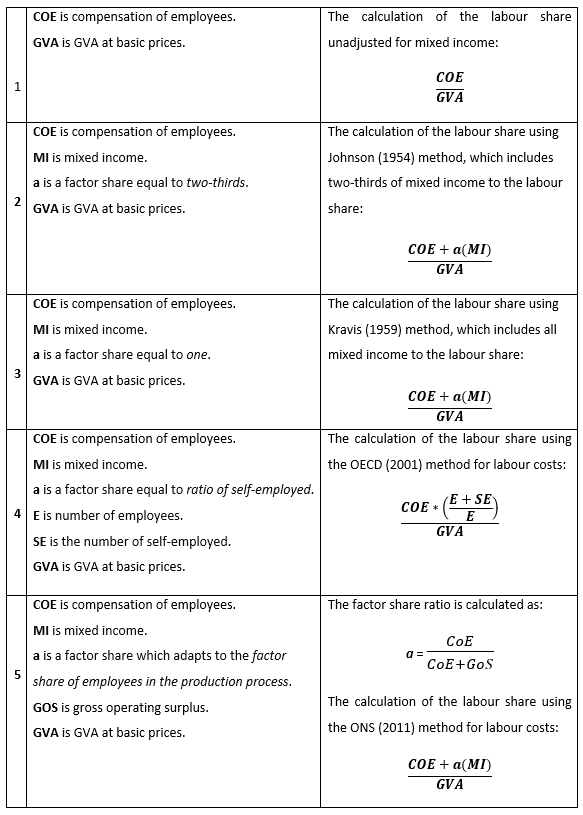
To consider the total income received by labour in the production of value added, the labour share would need to be adjusted for mixed income. However, the separation of income of the self-employed into a labour and capital component is a complex process, and due to the challenges of matching microdata records at national levels (Cho and others 2017) some studies on the subject have chosen to concentrate their research solely on the corporate sector (Karabarbounis and Neinman, 2013; Rognlie, 2016). We explored five methods for allocating the labour share.
Table 1: Methods for apportioning mixed income to the labour share
Download this image Table 1: Methods for apportioning mixed income to the labour share
.png (47.4 kB)
Figure 4: Different estimations of the labour share
Q1 (Jan to Mar) 1955 to Q4 (Oct to Dec) 2017, UK
Source: Office for National Statistics
Notes:
- Method 1 Labour Share unadjusted for mixed income.
- Method 2 Labour Share adjusted for mixed income (a = 2/3).
- Method 3 Labour Share adjusted for mixed income (a = 1).
- Method 4 Labour Share adjusted for mixed income (self-employed income is equal to the average income of an employee)
Download this chart Figure 4: Different estimations of the labour share
Image .csv .xlsFigure 3 shows the different estimations of the labour share unadjusted and adjusted for mixed income. The labour share unadjusted for mixed income method 1 is a relatively basic approach to estimating the labour share, as it only accounts for the income received by employees in the generation of value added. This method tends to be lower than the other labour share methods, as it excludes the mixed income received by the self-employed.
Adjusting the labour share for mixed income, Johnson (1954) proposed adjusting the labour share by allocating two-thirds of mixed income as a return to labour and one-third as a return to capital (method 2). This labour share adjusted for mixed income does experience a level change, but the overall trend remains the same through time. As the labour share is made up of compensation of employees and some factor of mixed income, and compensation of employees representing the largest proportion of total labour income, the change in the overall trend in the labour share is mainly driven by changes in compensation of employees. Returning to the Johnson (1954) approach, the assumption that the division of income remains constant overtime may not reflect the changing composition of the UK and other developed economies. As pointed out in Guerriero (2012), the balance between labour and capital income may change over time.
While Johnson (1954) proposed allocating two-thirds of mixed income to returns to labour, Kravis (1959) proposed attributing all mixed income as a return to labour (method 3). By allocating all mixed income as a return to labour, the labour share is 7.2 percentage points higher than the unadjusted, and 2.5 percentage points higher than the adjusted labour share using Johnsons (1954) approach between Quarter 1 (Jan to Mar) 1955 and Quarter 4 (Oct to Dec) 2017.
The justification behind this is that self-employed income in developing countries provides pure labour services, therefore all mixed income is returns to labour (Guerriero, 2012). However, this may not be representative in more advanced and developed economies, as the self-employed are known to employ capital in the production of goods and services such as vehicles and computers.
Whilst method 2 and 3 require mixed income data to adjust the labour share, method 4 uses an alternative method, assuming the self-employed earn the same wage as the average wage of an employee1. This approach to estimating the adjusted labour share closely tracks the labour share estimated using method 3 between Quarter 2 (Apr to Jun) 1992 and Quarter 1 (Jan to Mar) 2003.
After 2003, the labour share using method 3 and method 4 starts to diverge, which can be partly attributed to two factors. The first factor relates to the growth in the number of self-employed persons, which saw a sharp increase from 2003 onwards, while also growing faster than the number of employees. As the ratio of self-employed to total employment is used to estimate self-employment income in method 4, the decline in the ratio would lead to more income being allocated to the self-employed, which results in an increase in the labour share. The second factor is the decrease in mixed income. While compensation of employees and mixed income growth closely tracked each other from 2001 onwards, between Quarter 2 (Apr to Jun) 2007 and Quarter 1 (Jan to Mar) 2008, and between Quarter 1 (Jan to Mar) 2009 and Quarter 4 (Oct to Dec) 2014, mixed income fell while the growth in compensation of employees remained relatively stable over the same periods. This fall in mixed income would have had a minor impact on the labour share for methods 2 and 3, while the labour share for method 4 would not have been affected.
The approach used to estimate the labour share in method 4 can distort the economic framework as it extends outside the production boundary and the income components of gross value added (GVA) (see Figure 4). In addition, administrative data sources such as tax records and household surveys show that the self-employed earn a lower income than employees (Office for National Statistics, 2016a). 2HMRC: Survey of Personal Income. Furthermore, the income received by HM Forces and Governments Supported Trainees (GST) is accounted for twice, as they are included in compensation of employees but not in the LFS measure of employees (Turvey, 2009: Appleton, 2011).
Figure 5: Office for National Statistics and other estimations of the labour share
Q1 (Jan to Mar) 1955 to Q4 (Oct to Dec) 2017
Source: Office for National Statistics
Notes:
- Method 1 Labour Share unadjusted for mixed income
- Method 2 Labour Share adjusted for mixed income (a = 2/3)
- Method 3 Labour Share adjusted for mixed income (a = 1)
- Method 4 Labour Share adjusted for mixed income (self-employed income is equal to the average income of an employee)
- Method 5 Labour Share adjusted for mixed income (ONS Factor Share)
Download this chart Figure 5: Office for National Statistics and other estimations of the labour share
Image .csv .xlsThe fifth method is used by the Labour Productivity release (Office for National Statistics, 2018b)3 estimates the labour cost of the self-employed by applying a factor share to apportion mixed income between the returns to labour and capital. The methodology assumes that the relative returns to labour and capital are the same for the self-employed as for employees, using the ratio of compensation of employees and gross operating surplus of corporations to calculate the factor share. As this factor share is bounded between zero and one, the returns to labour for the self-employed cannot exceed mixed income, as it does in method 4. Furthermore, as the factor share can change over time to reflect the changing composition of the economy, including changes to the labour market and industry structure, this approach can be more effective than having a fixed factor share.
Comparing the ONS labour share with other methods, it is slightly higher than the labour share in method 2. This is because the factor share used to allocate mixed income to labour is slightly higher than the two-thirds approach used by Johnson (1954), but lower than the labour share approach used by (Kravis, 1959). Furthermore, there is no visible difference in the trend, which tracks the movements of other labour share estimations, excluding method 4.
Notes for: Labour share estimations
The breakdown of employee and self-employed data on a quarterly basis is only available from Quarter 2 1992 onwards. This data is required to estimate the labour share for method 5.
HMRC: Survey of Personal Income.
6. International comparisons of the labour share
The distribution of income between labour and capital has attracted growing attention over recent years, reflecting evidence of a declining labour share in most developed economies. While international comparability is important in understanding the different economic reasons behind the decline in the labour share, this requires a consistent framework to be followed across all countries to ensure data is comparable. One such inconsistency is the treatment of the self-employed, more specifically, unincorporated enterprises within the National Accounts. The treatment of unincorporated enterprises within the household or corporate sector can vary across countries due to practical constraints making the comparison of labour share across countries heterogeneous.
Understanding who are the self-employed, and their classification across sectors in the economy
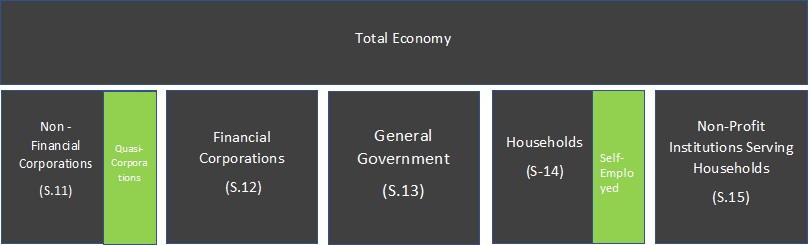
The term “self-employed”, in principle, captures those who work for themselves. In reality, their classification as a producing unit and/or enterprise is far more complex than this. The classification of an enterprise as a production unit is dependent on various factors such as whether a complete set of accounts is available for the producing unit, and whether there is sufficient autonomy of decision-making from that of the household within which it operates. Furthermore, we would need to distinguish how decisions can be made, dependent on whether the businesses are managed by an individual or collectively, for example by a partnership and who is liable for the losses and debts, that is is there limited or unlimited liability. This information is then used to classify those producer units who work for themselves, in the appropriate sector of the economy. Figure 6 presents the sectors in the economy and where the self-employed are classified.
Figure 6: Total economy and Institutional Units
Source: Office for National Statistics
Download this image Figure 6: Total economy and Institutional Units
.png (12.4 kB)
Typically, in the UK, people who work for themselves are classified as self-employed, and therefore included in the households sector, when they are sole proprietors – these are business entities owned by one individual and have no legal distinction between the owner and the business. The owner will usually receive all profits (subject to taxation specific to the business) and will have unlimited responsibility for all losses and debts.
These differ from “quasi-corporations”, which are included in the private non-financial corporations’ sector, because they do not have a complete and separate set of accounts from the households, nor do they have autonomy of decision making as institutional units. Quasi-corporations therefore, in national accounts, are entities which keep a “complete set of accounts” but have no legal status, whilst mainly having economic and financial behaviour that is different from that of their owners, that is the households, and are similar to that of corporations1. They are deemed to have autonomy of decision making and are considered as distinct institutions. Furthermore, international and European guidance clarify that if an enterprise is not in fact operated like a corporation and if it does not have a complete set of accounts of its own, then it cannot and should not be treated as a quasi-corporation however large it may be2. In practice, however, treating unincorporated enterprises owned by households as quasi-corporations is a rather difficult experience across many countries.
These practical difficulties in allocating producer units between the households and corporations sectors are not unique to the UK. Eurostat led a task force in 2014 on the issues around sector delineation and found heterogeneous practices across countries in recording these producer units. This ranges from Spain, France and Luxembourg which allocates all unincorporated enterprises in the households’ sector and none in quasi-corporations, to Italy which classifies sole proprietors and unlimited partnerships based predominantly on the number of employees where those with fewer than 10 employees were in the households’ sector. Germany classified unincorporated units to the households’ sector, and partnerships with unlimited liability that have separate book keeping obligations to the private corporation sector. These issues impact the self-employed as producing units engaged in the production process and contributing to the value added in the economy.
a. Comparisons of the labour share across EU Countries
Figure 7: Labour share unadjusted for mixed income for selected EU countries
1995 to 2016
Source: Eurostat
Notes:
- No compensation of employees and mixed income data for Spain before 1999.
Download this chart Figure 7: Labour share unadjusted for mixed income for selected EU countries
Image .csv .xlsFigure 7 shows the labour share unadjusted for mixed income for a selection of EU countries. As the unadjusted labour share only accounts for the income received by employees, the mixed income received by the self-employed is excluded, and therefore, would underestimate the income received by labour in countries with a large proportion of self-employed workers in employment.
Figure 8: Labour share adjusted for mixed income for selected EU countries
1995 to 2016
Source: Eurostat
Download this chart Figure 8: Labour share adjusted for mixed income for selected EU countries
Image .csv .xlsAdjusting the labour share for mixed income, Figure 8 shows the adjusted labour share using method 2, which assumes a fixed factor share of two-thirds of mixed income is allocated to labour3. While the adjustment of mixed income in the labour share should have a greater impact on countries with a large proportion of self-employed persons, this would depend on how the workers, and unincorporated enterprises, are treated within the National Accounts.
When adjusting the labour share for mixed income, all countries have experienced a level change in the labour share. However, Italy, which has the largest proportion of self-employed workers in employment, has seen relatively little change in the labour share compared to other countries in the sample. In contrast, Spain which has a slightly lower proportion of self-employed workers in employment has experienced a similar magnitude increase in the labour share between 1999 and 2006. The treatment of unincorporated enterpriese can be a contributing factor to the difference in the level change between Italy and Spain.
Notes for: International comparisons of the labour share
- See ESA 2010 p.213 (f).
- See SNA 2008, p.67 para.4.46.
- The preferred option used by the ONS to estimate labour cost, which uses a factor share of employees in the production process cannot be used for international comparisons due to the unavailability of data.
7. Conclusion
The labour share is an important measure of how value added has been generated from the production process. Although most of the income components of gross domestic product (GDP) are straightforward to allocate to labour and capital shares, the same cannot be said for mixed income, which has an impact on the income of the self-employed.
When accounting for mixed income within the labour share, it is important to apportion it into what is a return for labour input and capital investment. While most methods use a fixed factor share to adjust the labour share for mixed income, these methods do not account for the changing composition of the economy over time. In comparison, the ONS approach to apportion mixed income between labour and capital does account for this, and tends to have a factor share slightly higher than the two-thirds approach advocated by Johnson (1954). While most of these methods adjust the labour share for mixed income experience a level change, the overall trend remains the same. However, method 5, which assumes that the self-employed earn the same as an employee, does show an upward, and divergent trend from other adjusted measures from 2003 onwards. This can be partly attributed to the interaction of self-employment growing strongly from 2003 onwards, and the higher income imputed for the self-employed, leading to the imputed income being higher than actual mixed income estimates. As this approach falls outside the production boundary, this cannot be a reliable estimate for the income of self-employed.
While separating the income of the self-employed into a labour and capital component is a complex process, the diverse approaches used by countries to allocate incorporated enterprises, and therefore their income, into the UK National Accounts framework also leads to international comparisons of the labour share to be heterogeneous. The allocation of unincorporated enterprises into the National Accounts framework differs among countries, which are allocated based on a criterion to decide if they are in the households or non-financial corporation sector. Coutries which allocate all unincorporated enterprises into the households' sector experience a larger increase in the labour share than those which classify them based on employee numbers, leading to most unincorporated enterprises being recorded into the non-financial corporations sector. They show a lower increase in the labour share.
Back to table of contents8. Further work
This article is part of a continuous development programme in Labour Productivity in the ONS. Whilst the information and data sources which are currently available for estimating the labour share in the UK utilise the latest UK National Accounts aggregates and labour market variables, they provide the best available estimates for measuring the labour share. Further development work could be taken forward with the availability of microdata from administrative sources and particularly HMRC such as self-assessment forms and PAYE records would be particularly advantageous. They would enable a detailed analysis for tracking changes in recording individual’s salaries and entrepreneurial income over time.
In the medium term, reviewing the conceptual differences in defining the self-employed in the labour market statistics, compared to the UK National Accounts sector delineation would be a good starting point. This would help align the labour concepts to those of output, in the longer term if further administrative data were available it may also be possible to differentiate the labour share by industry in the economy and by taking into account this lower level granularity we may be able to present a more detailed analysis and capture the evolving labour contributions to the production process by industry.
References
Appleton, J (2011). Revised Methodology for Unit Wage Costs and Unit Labour Costs – Explanation and Impact. Newport: ONS, pages 1 to 10.
Atkinson (2009), “Factor Shares: The Principal Problem of Political Economy?”, Oxford Review of Economic Policy, Volume 25, pages 3 to 16.
Cho T, Hwang S, Schreyer P; (2017), OECD Statistics Working Papers, ‘Has the Labor Share Declined?: It Depends’,
Eurostat, Task Force on the Treatment of quasi corporations, National Accounts Working Group (November 2014) Item 8 – CN841.
Guerriero, M. (2012). The labour share of income around the world. Evidence from a panel dataset. (Working paper No. 32). Manchester, NH: University of Manchester, Institute for Development Policy and Management.
Johnson, D. (1954) The Functional Distribution of Income in the United States, 1850 to 1952, Review of Economics and Statistics, 36, pages 175 to 182
Karabarbounis, L. and Neiman, B. (2013). The Global Decline of the Labor Share. The Quarterly Journal of Economics, Oxford University Press, 129(1), pages 61 to 103.
Kravis, I. B. (1959). Relative Income Shares in Fact and Theory. The American Economic Review, 49, pages 917 to 949.
1OCED (2001), Measuring Productivity: Measurement Of Aggregate And Industry-Level Productivity Growth, OCED Manual, page 44
Office for National Statistics (2018a). Trends in self-employment in the UK. Newport: ONS.
Office for National Statistics (2018b). Labour productivity, UK: January to March 2018. Newport: ONS.
Rognlie, M. (2016). Deciphering the Fall and Rise in the Net Capital Share: Accumulation or Scarcity?. Brookings Papers on Economic Activity, 2015(1), pages 1 to 69.
Turvey, A. (2009). Developing a unit labour costs indicator for the UK. Economic & Labour Market Review, 3(6), pages 51 to 56.
Back to table of contents