1. Main points
The Strait of Dover and Taiwan Strait were the busiest of the six analysed maritime passages, with cargo ships accounting for the largest proportion of ships (50% in the Strait of Dover and 60% in the Taiwan Strait).
Ship crossings through the Suez Canal and the Bab-Al Mandab Strait began to decline from mid-December 2023, with the Suez Canal experiencing a decrease in crossings by 66% by the first week of April 2024 compared with the corresponding week of the previous year, and the Bab-Al Mandab Strait showing a 59% decrease in crossings over the same period.
Weekly crossings through the Strait of Hormuz between February and April 2024 showed a significant decrease compared with previous years, especially between weeks 5 and 10, with an average 23% reduction in crossing volume compared with the same weeks in the previous year, primarily from tanker crossings.
The flow of ship crossings around the Cape of Good Hope started to increase in December 2023 and throughout the first weeks of 2024, more than doubling levels observed in February 2023.
There have been no major changes to trends in ship crossings through the Taiwan Strait or Strait of Dover for the reported period.
These are official statistics in development and we advise caution when using the data. The methodology is currently under development, which means that the data and the scope of the estimates presented are likely to be subject to revision. More information can be found in Section 6: Measuring the data.
2. Global maritime passages
This bulletin presents statistics estimating the volume of maritime crossings through specific global maritime passages over time, broken down by ship type. These are official statistics in development.
The selection of analysed passages was based on their strategic importance, high traffic volume, geopolitical significance and economic impact. Future work will extend the analysis to additional maritime passages. Figure 1 shows the locations of the maritime passages covered in this bulletin.
Figure 1: Locations of all six passages of interest
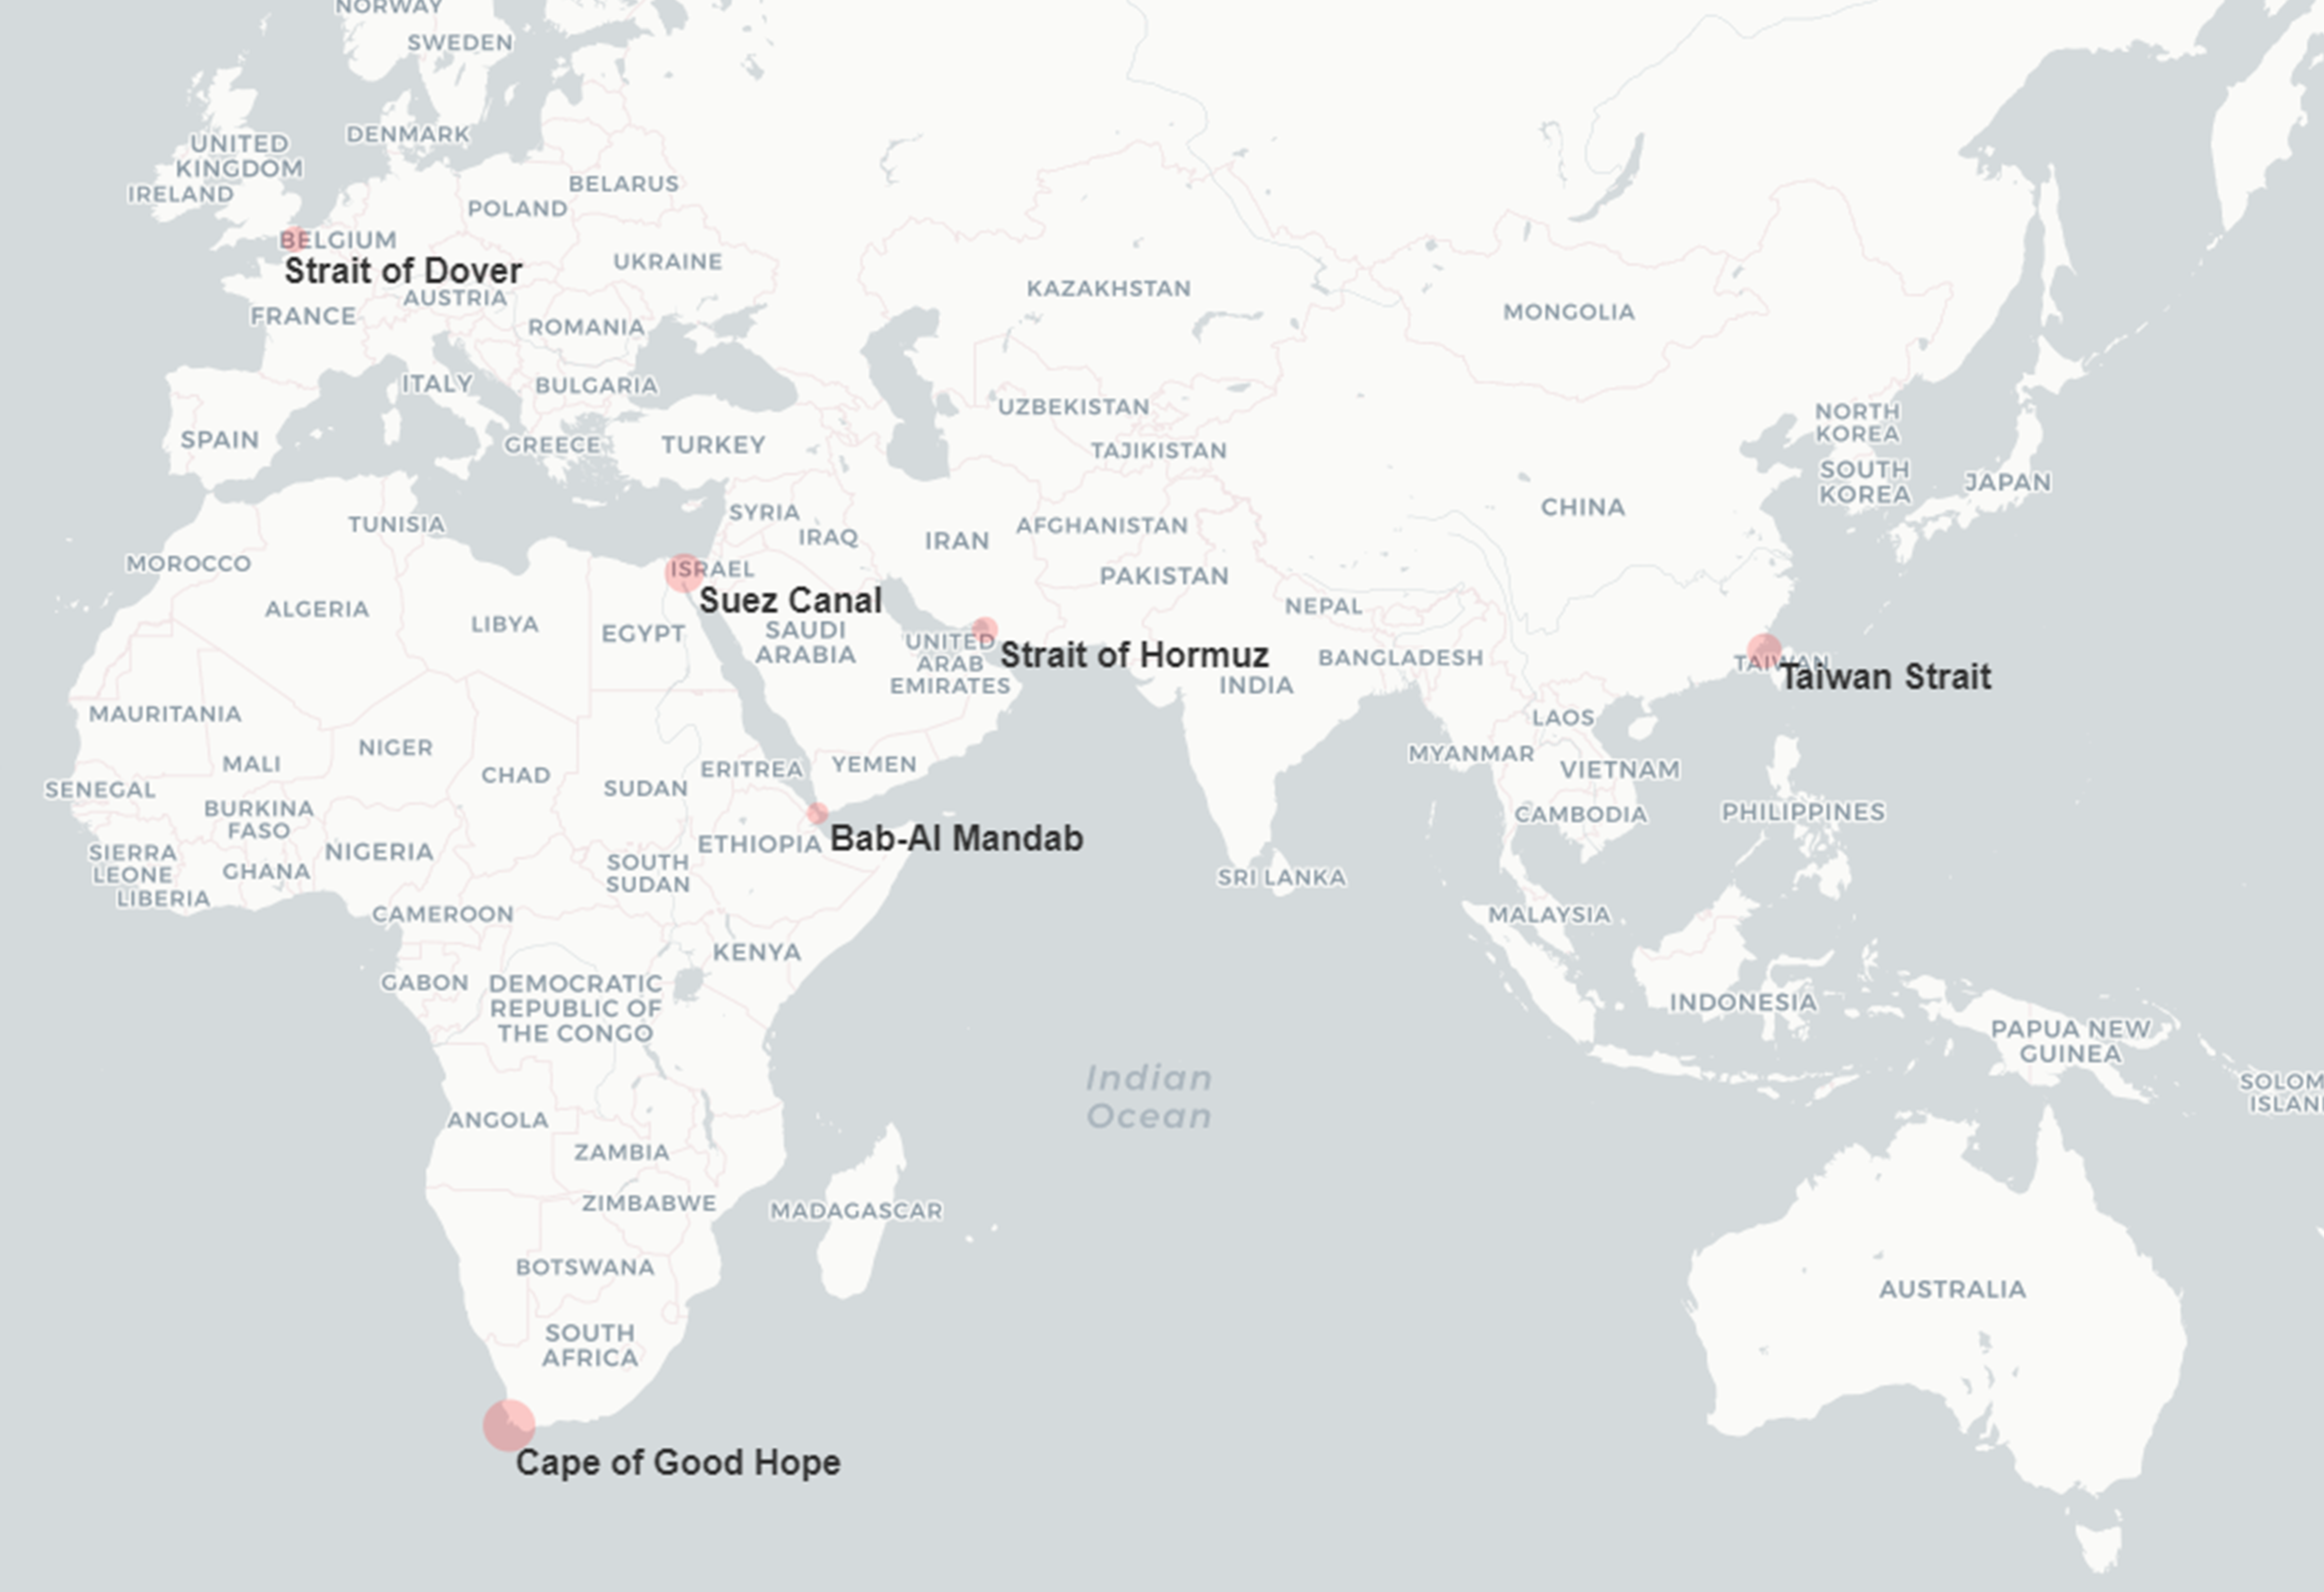
Figure 2 shows weekly ship crossings for the six maritime passages of interest within the period covered by our dataset:
- Strait of Dover
- Suez Canal
- Bab-Al Mandab Strait
- Strait of Hormuz
- Cape of Good Hope
- Taiwan Strait
We have excluded data points from periods where the data were deemed unreliable. This is attributed to the presence of noise or poor quality Automatic Identification System (AIS) data as explained in Section 7: Strengths and limitations.
Figure 2: Weekly ship crossings for the six maritime passages of interest
Weekly crossings by maritime passage, January 2022 to April 2024
Embed code
3. Analysis by passage
Strait of Dover
The Strait of Dover, situated between south east England and northern France, connects the English Channel to the North Sea. It is one of the busiest maritime passages in the world, enabling the transportation of goods and passengers between mainland Europe and the UK.
Dover is the busiest of the six passages examined, with, on average, around 1,300 ships crossing the Strait of Dover per week in 2023. Ship crossings through the Strait of Dover remained consistent throughout 2022 and 2023, unlike through the Strait of Hormuz where we typically see quieter periods at the start and end of the year.
Cargo ships were by far the most common type of ship passing through the Strait of Dover, accounting for 50% of total crossings in 2023. Cargo and tanker crossings were consistent throughout 2023, at similar levels to those seen in the previous year.
Figure 3: Weekly crossings through the Strait of Dover remained consistent between 2022 and 2024
Weekly volume of crossings, Strait of Dover, January 2022 to April 2024
Embed code
Weekly crossings by ship type, Strait of Dover, January 2022 to April 2024
Embed code
Suez Canal and Bab-Al Mandab Strait
The Suez Canal and the Bab-Al Mandab Strait had similar trends to one another.
The Suez Canal is an artificial waterway located in Egypt, linking the Mediterranean Sea to the Red Sea. It is a crucial maritime shortcut, allowing ships to avoid the lengthy voyage around the Cape of Good Hope in southern Africa, thus reducing travel duration and expenses for ships travelling between Asia and Europe.
The Bab-Al Mandab Strait connects the Red Sea to the Gulf of Aden and the Indian Ocean. It is an important transit route for ships travelling between Europe and Asia, and between Europe and eastern Africa.
The Suez Canal and the Bab-Al Mandab Strait serve as gateways to and from the Red Sea, allowing the transportation of goods such as oil and natural gas, which underlines their strategic importance.
Ship crossings through the Suez Canal and the Bab-Al Mandab Strait remained steady from January to November 2023. The flow of crossings through the passages began to decline from mid-December 2023. By the first week of April 2024 (week 14), the volume of crossings through the Suez Canal decreased by 66% compared with the corresponding week of the previous year. The Bab-Al Mandab Strait similarly saw a 59% decline in crossings compared with the same week of the previous year. This aligns with the widely reported maritime disruption in the Middle East.
The decline in crossing through both passages from mid-December 2023 was attributed to a steep drop in both cargo and tanker ships. By the first week of April 2024 (week 14), the volume of cargo and tanker ships through the Suez Canal was 71% and 61% below the level of ship crossings seen in the previous year, respectively.
At the Bab-Al Mandab Strait, cargo crossings began to decline slightly earlier than tanker crossings in late December 2023, whereas tanker crossings only began to deviate from the previous year's trends from the start of January 2024. By the first week of April 2024, cargo and tanker ships had dropped 68% and 56% below the level of ship crossings seen at the same week in the previous year, respectively.
Figure 4: Weekly crossings through the Suez Canal began to decline towards the end of 2023
Weekly volume of crossings, Suez Canal, January 2022 to April 2024
Embed code
Weekly crossings by ship type, Suez Canal, January 2022 to April 2024
Embed code
Figure 5: Weekly crossings through the Bab-Al Mandab Strait began to decline towards the end of 2024
Weekly volume of crossings, Bab-Al Mandab Strait, January 2022 to April 2024
Embed code
Weekly crossings by ship type, Bab-Al Mandab Strait, January 2022 to April 2024
Embed code
Strait of Hormuz
The Strait of Hormuz, situated between the Persian Gulf and the Gulf of Oman, links important trade routes between the Persian Gulf and Asia, Europe and Africa. It serves as a primary route for oil and liquefied natural gas shipments from the Persian Gulf.
There was no major observable disruption to ship crossings through the Strait of Hormuz throughout 2023. However, the volume of ship crossings was notably lower than previous years from February 2024, where we would usually see an uptick in crossings during this period. This is particularly noticeable between weeks 5 and 10 where the volume of crossings was, on average, 23% lower than over the same weeks in the previous year.
This decline was primarily attributed to tanker crossings. The volume of crossings made by tanker ships between weeks 5 and 10 was 23% lower than the total crossings over the same weeks in 2023. On the other hand, there was no major observable disruption to cargo crossings through the Strait of Hormuz.
Figure 6: Weekly crossings through the Strait of Hormuz was lower from February 2024 to April 2024 than in previous years
Weekly volume of crossings, Strait of Hormuz, January 2022 to April 2024
Embed code
Weekly crossings by ship type, Strait of Hormuz, January 2022 to April 2024
Embed code
Cape of Good Hope
The Cape of Good Hope, situated at the southern tip of Africa, is a maritime route that connects the Atlantic and Indian Oceans. It is a significant conduit for trade and enables the movement of goods between Europe and Asia, and around Africa.
The flow of ship crossings around the Cape of Good Hope began to steadily increase in December 2023 and throughout the first weeks of 2024. By the second week of February (week 7), the number of ship crossings through this maritime corridor was more than double the volume from the same week in 2023. The timing of this increase coincides with the declines in ship crossings seen at the Suez Canal and Bab-el-Mandeb Strait. While ship crossings had dropped slightly by the first week of April, they were still notably higher than previous years (57% higher than in 2023).
The increase in the volume of ship crossings towards the end of 2023 and start of 2024 is reflected in the trends in crossings made by both cargo and tanker ships.
By the second week of February (week 7), the volume of cargo ship crossings was approximately three times the level seen in the preceding year, while the volume of tanker ships was more than 2.5 times higher.
Figure 7: Weekly crossings around the Cape of Good Hope began to increase in December 2023
Weekly volume of crossings, Cape of Good Hope, January 2022 to April 2024
Embed code
Weekly crossings by ship type, Cape of Good Hope, January 2022 to April 2024
Embed code
Taiwan Strait
Located between Taiwan and China, the Taiwan Strait connects the East China Sea to the South China Sea, allowing the movement of passengers, goods and energy resources between important economic hubs such as China, Taiwan, Japan and global markets.
On average, in 2023, approximately 1,200 ships crossed the Taiwan Strait in a week, making it the second busiest route of the six examined.
Cargo ships accounted for 60% of total crossings in 2023. Cargo and tanker crossings were consistent throughout 2023 and similar to levels seen from the previous year. The results suggest there was no major disruption to ship crossings through the Taiwan Strait during the reporting period.
Figure 8: Weekly crossings through the Taiwan Strait remained consistent between 2022 and 2024
Weekly volume of crossings, Taiwan Strait, January 2022 to April 2024
Embed code
Weekly crossings by ship type, Taiwan Strait, January 2022 to April 2024
Embed code
4. Ship crossings through global maritime passages data
Weekly ship crossings for six maritime passages of interest
Dataset | Released 24 April 2024
Weekly ship crossings through six global maritime passages (the Strait of Dover, Suez Canal, Bab-Al Mandab Strait, Strait of Hormuz, Cape of Good Hope and Taiwan Strait) between January 2022 and April 2024. These are official statistics in development.
Weekly ship crossings for six maritime passages of interest with week number
Dataset | Released 24 April 2024
Weekly ship crossings through six global maritime passages (the Strait of Dover, Suez Canal, Bab-Al Mandab Strait, Strait of Hormuz, Cape of Good Hope and Taiwan Strait) between January 2022 and April 2024 with week number. These are official statistics in development.
Weekly ship crossings by ship type through six global maritime passages
Dataset | Released 24 April 2024
Weekly ship crossings through six global maritime passages (the Strait of Dover, Suez Canal, Bab-Al Mandab Strait, Strait of Hormuz, Cape of Good Hope and Taiwan Strait) between January 2022 and April 2024, broken down by ship type. These are official statistics in development.
5. Glossary
Automatic Identification System (AIS)
An automatic tracking system that uses transceivers on ships to report their positions in near real-time. AIS provides near real-time information regarding the position of ships, enabling precise monitoring of their movements. Ships transmit these data every few seconds using onboard transceivers and include information on their location, identification and characteristics (for instance, cargo ship or tanker).
Maritime passages
Passages of water that are important because of their role in international trade, maritime navigation and geopolitics. Monitoring traffic passing through them provides insights into trade patterns, the health of the global economy and can help detect potential supply chain issues.
Cargo ships
Ships that transport goods and commodities, including general cargo, container, roll-on roll-off cargo, refrigerated cargo and other dry cargo ships.
Roll-on roll-off (Ro-Ro) cargo ships
Ships that carry cargo that can be moved to or off a ship either by their own propulsion (for example, passenger car), or with assistance (for example, unaccompanied trailer). The cargo is loaded and unloaded onto the ship using built-in ramps.
Tanker ships
Ships that carry oil, chemical and liquefied gas and other liquids.
Trading ships
Ships that carry cargo or passengers for commercial purposes.
Back to table of contents6. Measuring the data
We estimate the volume of maritime crossings by analysing ship position data collected via Automatic Identification System (AIS).
AIS provides near real-time information regarding the position of ships, enabling precise monitoring of their movements. Ships transmit these data every few seconds using onboard transceivers and include information on their location, identification and characteristics (for instance, cargo ship or tanker). AIS data are provided to the Office for National Statistics (ONS) by Exact-Earth and Spire Global, and accessed via the United Nations Global Platform.
To count crossings of a particular maritime passage, we define zones at either end of the passage and include a ship as having crossed if it enters both zones within a fixed time period. For more details on the methodology used, see our blog Ship crossings through global maritime passages: January 2022 to April 2024.
The volume of maritime crossings for each passage is broken down by ship type, adhering to the classification used by the Department for Transport's shipping fleet statistics. This bulletin uses three main ship types:
cargo: including general cargo, container, roll-on roll-off cargo (cargo that can be moved to or off a ship either by their own propulsion, for instance, passenger car, or with assistance, for instance, unaccompanied trailer), refrigerated cargo and other dry cargo ships
tanker: including oil, chemical and liquefied gas, and other liquids
other trading ships: including passenger, mixed passenger and cargo ships, and bulk carriers
7. Strengths and limitations
Strengths
The Automatic Identification System (AIS) tracks ship positions every few seconds while the ship is in motion and every couple of minutes while docked, producing high frequency, near real-time data (the lag in AIS data can range from seconds to a few minutes); therefore, this publication provides insights into trade activity through maritime passages at a level of timeliness not currently possible with official trade statistics.
The methodology used in this publication records ship crossings through maritime passages rather than tracking port traffic near these passages. This approach provides a more accurate interpretation of ship movements through these passages.
This publication uses AIS data, which provides us with enhanced flexibility in data manipulation, analysis and integration with other datasets, such as shipping instructions data; shipping instructions data detail the type, quantity and destination of goods shipped in containers, linking this data with AIS data enables near real-time monitoring of the journeys of containerised goods.
Limitations
Because of the presence of noise or poor-quality AIS data, some passage crossings may be incorrectly identified or missing; while our algorithm reduces a portion of the noise, some may persist.
Only trading ships - those which carry cargo or passengers for commercial purposes - have been included in this analysis and approximately 5% of ships are missing information on ship type.
AIS data do not provide information on the goods carried by the ships, although the type of ship can sometimes suggest the goods it carries; for example, tanker ships typically transport liquids.
There is a gap in AIS data on 12 May 2022 and 14 February 2023, which will marginally impact the number of ships in those weeks.
Ship type comes from a single ship's register; the register was last updated on 30 October 2023 and may not assign correct information for all ships throughout the year.
9. Cite this statistical bulletin
Office for National Statistics (ONS), released 24 April 2024, ONS website, statistical bulletin, Ship crossings through global maritime passages: January 2022 to April 2024