1. Abstract
This analysis, produced jointly with the Home Office, looks at the ethnicity and religion of those born outside the UK. In 2011 13% of the population (7.5 million people) in England and Wales were born overseas. We look at this foreign-born population by country of birth and religion, broken down by different periods of arrival.
Back to table of contents2. Main points
The 2011 Census showed that almost half (46%, 3.4 million) of the foreign-born population identified with a White ethnic group, a third identified as Asian/Asian British (33%, 2.4 million) and 13% (992,000) identified with Black/African/Caribbean/Black British
More than 1 in 8 foreign-born residents (13%, 949,000) classified themselves as White British
The largest group who identified as White British were German born (57%, 155,000) and over half (56%) of them arrived before 1981. One likely reason is due to British military personnel being stationed in Germany. The next largest group identifying as White British were from South Africa (85,000)
A quarter of the foreign-born population identified as Other White (28%, 2.1 million) and the largest group were from Poland (528,000). Over 9 in 10 Polish born residents identified with Other White and the majority (94%, 496,000) arrived between 2001 and 2011, with Poland’s accession into the European Union in 2004
The majority of South African born residents identified as White (84%) and over two fifths identified as White British (44%). Most of those identifying with White British (68%) arrived before 2001
A broad range of ethnic groups was found with Iraqi and Iranian born residents. For Iraq, most common was Arab (39%), Any Other ethnic group (28%) and Asian (17%). For Iran, most common was Asian/Asian British (38%), Any Other ethnic group (34%) and Other White (13%)
High proportions of residents who were Kenyan, Tanzanian and Ugandan born identified as Asian (69%, 68% and 58% respectively)
Of the foreign-born population in England and Wales nearly half identified as Christian (48%) and a fifth identified as Muslim (19%). Around 1 in 7 had No religion (14%)
3. Introduction
The 2011 Census has shown that England and Wales has become more ethnically diverse, with minority ethnic groups continuing to rise since 1991. The proportion identifying with a White ethnic group has decreased from 94% in 1991 to 86% in 2011.
In 2011, 87% of the population (48.6 million people) was born in the UK and 13% of the population (7.5 million people) was born outside of the UK.
Previous analysis of Census data has looked at migration patterns and the country of birth and nationality of those born outside of the UK and it has also looked at the socio-economic characteristics of the non-UK born population. This analysis, produced jointly with the Home Office, adds to these reports by looking at the ethnicity and religion of non-UK born residents.
The report includes a breakdown of the top 10 largest countries of birth within each of the world regions. Together these countries represent over three quarters of the total non-UK born population and draw out migration patterns for England and Wales. It is followed by an overall picture of the religion of the non-UK born population which is also broken down by different periods of arrival.
The terms foreign-born, non-UK born, born outside the UK have been used interchangeably in this analysis.
Migration patterns differ across ethnic groups and religions. It is important to note that there could be numerous reasons for this, such as historic, commonwealth ties, legislative changes, personal, economic and cultural events. It could also be related to international politics, events and conflicts.
The 2011 Census required that a person’s identification with an ethnic group and religious affiliation be self-defined and subjectively meaningful to that individual. The 2011 Census question on religion is voluntary and measures religious affiliation, that is, how people identify with a religion irrespective of practice or belief. There may be factors, including changing social and political attitudes, which affect how people view their ethnic and religious identity.
Country of birth is set and cannot change over time. A UK resident who was born outside the UK has migrated to the UK at some point in the past. While some non-UK born people will have migrated recently, others will have lived in the UK for many years and gained UK citizenship. Over three quarters (77%) of the non-UK born population who had arrived in the UK prior to 1981 had by the time of the 2011 Census acquired a UK passport.
There is further information on the concepts and terms used in this article in section 5 of the background notes.
Back to table of contents4. Ethnicity of the non-UK born population
In 2011, 7.5 million people living in England and Wales (13% of the total population) were born outside the UK.
Amongst the 56 million residents in England and Wales, 86% were White, 8% were Asian/Asian British and 3% were Black/African/Caribbean/Black British.
Of the foreign-born population almost half (46%) identified as White, including over a quarter who identified as Other White (28%). Almost one million people born abroad (13% of the foreign-born) identified as White British and a further 354,000 (5% of the foreign-born) identified as Irish. One third of the foreign-born identified as Asian (33%) and 13% of were Black/African/Caribbean/Black British.
Table 1 shows the ethnicity of the UK and non-UK born population by the complete 18 ethnic group classification.
Table 1: UK and non-UK born population by ethnicity in England and Wales, 2011
| Number (thousand) and percentage | ||||||
| Ethnic Group | UK born | Non-UK born | ||||
| White | 44,774 | 92.2 | 3,435 | 45.8 | ||
| British | 44,186 | 91.0 | 949 | 12.6 | ||
| Irish | 178 | 0.4 | 354 | 4.7 | ||
| Gypsy or Irish Traveller | 51 | 0.1 | 7 | 0.1 | ||
| Other White | 360 | 0.7 | 2,126 | 28.3 | ||
| Mixed/Multiple ethnic group | 985 | 2.0 | 239 | 3.2 | ||
| White and Black Caribbean | 401 | 0.8 | 26 | 0.3 | ||
| White and Black African | 113 | 0.2 | 53 | 0.7 | ||
| White and Asian | 271 | 0.6 | 71 | 0.9 | ||
| Other Mixed | 200 | 0.4 | 90 | 1.2 | ||
| Asian/Asian British | 1,770 | 3.6 | 2,443 | 32.6 | ||
| Indian | 606 | 1.2 | 807 | 10.7 | ||
| Pakistani | 631 | 1.3 | 493 | 6.6 | ||
| Bangladeshi | 232 | 0.5 | 215 | 2.9 | ||
| Chinese | 93 | 0.2 | 300 | 4.0 | ||
| Other Asian | 207 | 0.4 | 628 | 8.4 | ||
| Black/African/Caribbean/Black British | 873 | 1.8 | 992 | 13.2 | ||
| African | 323 | 0.7 | 666 | 8.9 | ||
| Caribbean | 358 | 0.7 | 237 | 3.2 | ||
| Other Black | 192 | 0.4 | 89 | 1.2 | ||
| Other ethnic group | 168 | 0.3 | 395 | 5.3 | ||
| Arab | 64 | 0.1 | 167 | 2.2 | ||
| Any other ethnic group | 105 | 0.2 | 228 | 3.0 | ||
| 100 | 100 | |||||
| All | 48,571 | 86.6 | 7,505 | 13.4 | ||
| Source: 2011 Census | ||||||
Download this table Table 1: UK and non-UK born population by ethnicity in England and Wales, 2011
.xls (30.7 kB)2011 Census Table DC2205EW (Country of birth, ethnic group, sex) was used to produce Table 1.
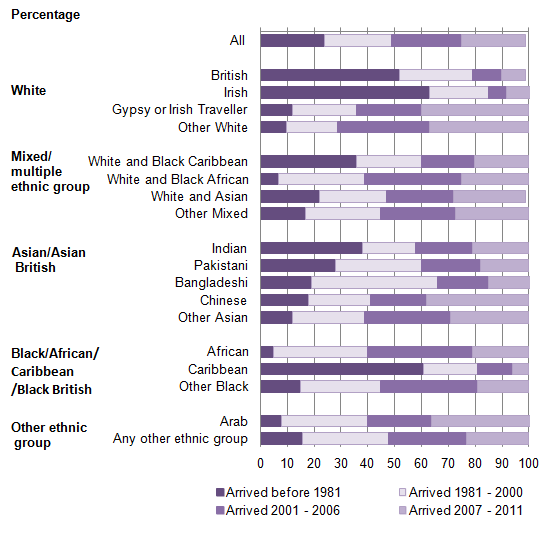
Figure 1 looks at the ethnicity of the non-UK born population of England and Wales by period of arrival in the UK using the same breakdown as previous analyses (those arriving before 1981; between 1981 and 2000; 2001 to 2006 and 2007 and 2011). Year of arrival was derived from the 2011 Census question, “If you were not born in the UK when did you most recently arrive to live here?” This was a new question in the 2011 Census. The analysis uses 4 periods of arrival periods, which each account for around one quarter of the non-UK born population resident in 2011.
Migration patterns differ across ethnic groups. There are numerous reasons for this which can include historic and commonwealth ties, legislative changes, personal, economic and cultural issues and circumstances.
When looking at period of arrival of foreign-born residents in England and Wales:
the majority of foreign-born who were White Irish (63%), Black Caribbean (61%) and White British (52%) arrived in the period before 1981
almost half (47%) of those who identified with a Bangladeshi ethnicity arrived between 1981 and 2000, during a period of instability in the country following the Bangladeshi war of independence (1971) and military coup (1975)
95% of Black Africans arrived after 1981
the largest non-UK born ethnic minority group was Other White (2.1 million people); the majority of this group (71%) arrived in the UK between 2001 and 2011, which reflects the substantial increase in migrants following the number of Central and Eastern European countries1 joining the European Union in 2004, this includes over half a million people (531,000) from Poland
Figure 1: Ethnicity of the non-UK born population by period of arrival, England and Wales, 2011
Source: Census - Office for National Statistics
Download this image Figure 1: Ethnicity of the non-UK born population by period of arrival, England and Wales, 2011
.png (24.6 kB) .xls (29.2 kB)Source: Census - Office for National Statistics
2011 Census Table CT02632011 (country of birth by year of arrival by ethnic group) (144.5 Kb Excel sheet) was used to produce Figure 1.
Notes for ethnicity of the non-UK born population
- These countries were: Czech Republic, Estonia, Hungary, Latvia, Lithuania, Poland, Slovakia and Slovenia, along with Cyprus and Malta in May 2004; Bulgaria and Romania in January 2007 and Croatia in June 2013
5. Ethnicity of non-UK born population by world region
This section looks in detail at selected countries of birth by world region (Europe, Africa, Middle East and Asia and the Rest of the World). This focuses on the 10 largest countries of birth of the foreign-born population in England and Wales within each world region. (Further analysis can be found in the Appendix).
Of the total non-UK born population, over a third (37%, 2.7 million ) were born in Europe, a third in the Middle East and Asia (34%, 2.6 million), a fifth (17%, 1.3 million) in Africa. There were 1 in 10 (11%, 857,000) born in other areas of the world (including Antarctica and Oceania).
The top 10 largest countries from each of the world regions covered in this analysis represent over three quarters of the total non-UK born population (77%). Ethnic group categories vary slightly between the regions to ensure that they are presented in a way that is most applicable to that region.
Europe
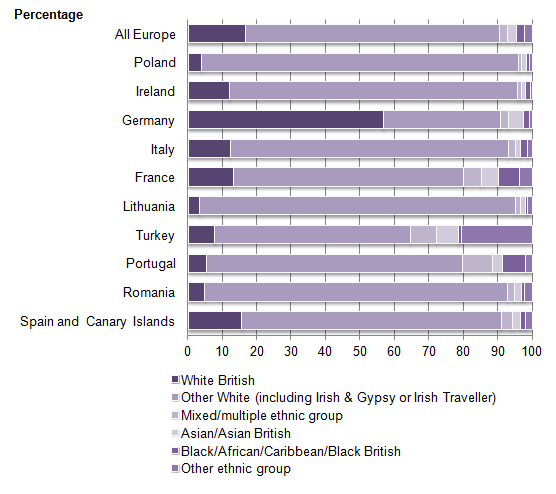
Around a third of the foreign-born population was born in Europe (37%). The top 10 countries of birth (as shown in Figure 2) for this region ranged from Poland (with 579,000 people) to Spain, including the Canary Islands (79,000 people). These 10 countries of birth accounted for 26% of the overall non-UK born population and 71% of the non-UK born population from within Europe.
The ethnicity of residents who were European born were predominantly White. Overall, 74% identified with Other White (including White Irish and Gypsy or Irish Traveller) and 17% identified with White British. This pattern can be seen in most of the 10 countries presented in Figure 2.
Findings include:
over half (57%) of the residents of England and Wales who were born in Germany identified as White British; linked closely to year of arrival, pre-1981 arrivals were much more likely to have identified with White British (80%) than post 2001 arrivals (17%), this is likely to be attributable to those born to UK military service personnel stationed in Germany
over 9 in 10 Lithuanian and Polish born identified with Other White (both 92%); a large proportion of these (93% and 94%) arrived between 2001 and 2011 following accession of Lithuania and Poland to the European Union
of the countries of Europe considered here, foreign-born residents from Turkey, France and Portugal had the highest proportions who identified with ethnic groups other than White
Figure 2: Ethnicity of the non-UK born population by country of birth, for top 10 countries in Europe, England and Wales, 2011
Source: Census - Office for National Statistics
Download this image Figure 2: Ethnicity of the non-UK born population by country of birth, for top 10 countries in Europe, England and Wales, 2011
.png (23.6 kB) .xls (21.0 kB)2011 Census Table CT02632011 (country of birth by year of arrival by religion) (144.5 Kb Excel sheet) was used to produce Figure 2.
Africa
Around a fifth of the foreign-born population of England and Wales was born in Africa (17%). The top 10 countries of birth of the foreign-born population in Africa range from Nigeria (191,000 residents) to Egypt (30,000 residents). The top 10 accounted for 13% of the overall non-UK born population and 76% of the non-UK born population from within Africa.
Figure 3 summarises the top 10 countries of birth of the foreign-born population from Africa. Just over half (50%) of the non-UK born population from the African region was Black with the majority being Black African (47%), 17% identified with Asian/Asian British and 13% identified with White British. However, this picture varies considerably for different countries of birth.
Most African born residents from the top 10 selected countries were either Black or Asian. Those from Ghana and Nigeria had the highest proportion of Black/Black British (both 89%).
The ethnic breakdown of Egyptian, South African, Zimbabwean and also East African born was very different to other countries in the region:
there was a wider variety of ethnic groups from Egyptian born residents, high proportions identified as Arabs and White (39% each), 28% were White British and almost 9 in 10 (88%) of these arrived in the UK before 1981; this is likely to be partly attributable to those born to British subjects based in Egypt during the UK’s administration of the country
across all periods of arrivals South African born residents were predominantly White, (84%), over 4 in 10 identified with White British (44%) but this varied by period of arrival, with more recent arrivals less likely to identify with White British (72% pre 1981 to 26% for the period 2007 to 2011); many South African born residents arrived during the Apartheid era and post Apartheid data showed numbers that came to live in the UK rose from 64,000 in the 1991 Census to 132,000 in 2001 and 91,000 in the 2011 Census
of Zimbabwean born residents 2 in 10 identified with White British (20%), this was highest for those who arrived before 1981 (74%); this may partly reflect conflict leading up to the creation of Zimbabwe in 1980
the majority of residents of England and Wales born in the East African countries of Kenya, Tanzania and Uganda were of Asian/Asian British ethnicity (69%, 68% and 58% respectively)
Previous census analysis reported that the majority (60%) of the Kenyan born population in England and Wales in 2011 arrived before 1981. Many East African Asian’s began to arrive in the 1960s. They were descendants of migrants from the Indian sub-continent who had settled in East Africa during the British colonial administration but who subsequently experienced discrimination.
Previous analysis also found that 31% of Tanzanian born residents arrived pre 1981 (1971 to 1980), part of the explanation for this may lie with the disruption caused in East Africa by the Ugandan crisis and the expulsion of Ugandan Asians. There were also disruptions to food supplies as a result of droughts and famine. In 2011, 44% of residents born in Uganda arrived in the 1970s. Of the total Ugandan born population 58% identified as Asian/Asian British, this increased to 87% for pre 1981 arrivals. The vast majority (90%) of Ugandan-born Asians in the UK arrived in this period.
Figure 3: Ethnicity of the non-UK born population, by country of birth, for top 10 countries in Africa, England and Wales, 2011
Source: Census - Office for National Statistics
Download this chart Figure 3: Ethnicity of the non-UK born population, by country of birth, for top 10 countries in Africa, England and Wales, 2011
Image .csv .xls2011 Census Table CT02632011 (country of birth by year of arrival by religion) (144.5 Kb Excel sheet) was used to produce Figure 3.
Middle East and Asia
Around a third of the foreign-born population of England and Wales was born in the Middle East and Asia (34%). The top 10 countries of birth in the Middle East and Asia ranged from India (694,000 people) to Malaysia (65,000). All 10 countries accounted for 28% of the overall non-UK born population and 82% from the Middle East and Asia region.
Figure 4 looks at the top ten countries of birth within the Middle East and Asia by ethnic group. It shows that overall, over 8 in 10 (82%) identified with Asian/Asian British and 5% identified with White British.
The main findings showed that:
non-UK born residents from Hong Kong (Special Administrative Region) and Malaysia showed the highest numbers of White British (17% and 15% respectively), possibly reflecting the numbers of British residents in these countries, some of whom returned home following independence
residents born in Iraq identified with a wide range of ethnic groups; the largest ethnic group was Arab (39%), 28% identified with Any Other ethnic group and 17% identified with Asian/Asian British
over a third of the people born in Iran identified with Other Asian (34%), a third identified with Other ethnic group (34%) and 13% identified with Other White
Figure 4: Ethnicity of the non-UK born population by country of birth for top 10 countries in the Middle East and Asia, England and Wales, 2011
Source: Census - Office for National Statistics
Download this chart Figure 4: Ethnicity of the non-UK born population by country of birth for top 10 countries in the Middle East and Asia, England and Wales, 2011
Image .csv .xls2011 Census Table CT02632011 (country of birth by year of arrival by religion) (144.5 Kb Excel sheet) was used to produce Figure 4.
Rest of the World
Around a tenth of the non-UK born population were born in countries from the Rest of the World (11%); 2% from the Antarctica and Oceania regions and 9% from the Americas and Caribbean. The top 10 populations of countries of birth from the Rest of the World ranged in size from the United States (177,000) to Barbados (19,000). All 10 countries accounted for 10% of the overall non-UK born population and 84% from the Rest of the World group.
Figure 5 looks at the top 10 countries of birth within the Rest of the World by ethnic group. It shows that there were a broad range of ethnic groups. Overall, over half of the population were White (54%) with 21% White British and 33% Other White and 26% were Black Caribbean.
Findings show that:
the majority of those born in Jamaica (85%), Barbados (82%) and Trinidad and Tobago (53%) identified as Black Caribbean
over half of Canadian born identified with White British (51%). High proportions of White British were also seen for residents born in Australia (41%), New Zealand (39%) and the United States (27%); this is likely to reflect the strong relationships with the UK and the historical settlement of British citizens in these countries. Accordingly, for pre 1981 arrivals, over half (53%) United States born residents, and the majority of those born in Canada (80%), Australia (78%) and New Zealand (75%), identified with a White British ethnicity
Figure 5: Ethnicity of the non-UK born population by country of birth for top 10 countries in Rest of the World, England and Wales, 2011
Source: Census - Office for National Statistics
Download this chart Figure 5: Ethnicity of the non-UK born population by country of birth for top 10 countries in Rest of the World, England and Wales, 2011
Image .csv .xls2011 Census Table CT02632011 (country of birth by year of arrival by religion) (144.5 Kb Excel sheet) was used to produce Figure 5.
Back to table of contents6. Religion
Of the 56 million residents of England and Wales in 2011, 59% were Christian, 5% were Muslim, 0.4% were ‘Other’ religion and 25% had No religion.
Table 2 shows the UK and foreign-born population by their religion. Of the non-UK born population almost half were Christian (48%). This compares to 61% of those born in the UK. Muslims were the second largest religion of the foreign-born population (19%). This compares to 3% of the UK born population.
Around 1 in 7 (14%) of the foreign-born population said they had No religion, compared to 27% of those born in the UK.
Table 2: UK and non-UK born population by religion in England and Wales, 2011
| Number (thousand) and percentage | |||||
| Religion | UK born | Non UK born | |||
| No religion | 13,064 | 26.9 | 1,033 | 13.8 | |
| Christian | 29,676 | 61.1 | 3,567 | 47.5 | |
| Buddhist | 98 | 0.2 | 149 | 2 | |
| Hindu | 272 | 0.6 | 545 | 7.3 | |
| Jewish | 214 | 0.4 | 50 | 0.7 | |
| Muslim | 1,278 | 2.6 | 1,428 | 19 | |
| Sikh | 239 | 0.5 | 184 | 2.4 | |
| Other religion | 193 | 0.4 | 47 | 0.6 | |
| Religion not stated | 3,536 | 7.3 | 502 | 6.7 | |
| All | |||||
| Source: 2011 Census | |||||
Download this table Table 2: UK and non-UK born population by religion in England and Wales, 2011
.xls (27.6 kB)2011 Census Table DC2207EW (country of birth by religion by sex) was used to produce Table 2.
Figure 6 looks at religion of residents in England and Wales who were born outside of the UK by period of arrival. Around a quarter of non-UK born residents arrived within each of the 4 periods of arrival (pre-1981, 1981 to 2000, 2001 to 2006 and 2007 to 2011). However, the proportions of the non-UK born residents varied by religion and between the time periods. As previously stated, there are often numerous reasons for this. Ethnicity and religion are interrelated and are often linked to historic events and commonwealth ties, legislative changes, personal, economic and cultural reasons.
The main findings show that:
the largest proportion of foreign-born residents were Christian (3.6 million). The highest proportion of Christians over 1.8 million (53%) arrived in the period 2001 to 2011. This included 464,000 people from Poland (following Poland’s accession into the European Union). The next largest countries of birth were Nigeria (95,000), the Philippines (82,000) and Lithuania (76,000)
Muslims were the second largest religious group of foreign-born residents (1.4 million), over a third (503,000) arrived between 1981 and 2000 (35%); previously published data has shown that 9 in 10 residents identifying as Pakistani and Bangladeshi ethnicity also identified as Muslim (91% and 90% respectively)
over half of Sikhs (52%) arrived before 1981 and the numbers have continued to fall over more recent periods of arrival. Table 1 showed that over a third (38%) of people who identified with an Indian ethnicity arrived before 1981. Previously published data has shown that over 7 in 10 of all usual residents in England and Wales who identified with the Indian ethnic group identified with Sikh religion (74%)
over a third of Buddhists (35%) arrived between 2007 and 2011,this compares to 14% before 1981; the main countries of birth were Thailand (31,000), Sri Lanka (20,000) and China (15,000)
Figure 6: Religion of the non-UK born population by period of arrival, England and Wales, 2011
Source: Census - Office for National Statistics
Download this chart Figure 6: Religion of the non-UK born population by period of arrival, England and Wales, 2011
Image .csv .xls2011 Census Table CT02652011 (country of birth by year of arrival by religion) (95 Kb Excel sheet) was used to produce Figure 6.
Back to table of contents
