Table of contents
1. Introduction
Data from the Crime Survey for England and Wales (CSEW) showed a notable rise in people experiencing or witnessing anti-social behaviour (ASB) in the local area for year ending March 2019. This may have been the result of a genuine rise in these experiences. However, it may also be the result of changes made in April 2018 to the order and context of questions across four different respondent pathways in the survey.
After the main screener questions, respondents are routed into four different pathways:
- experience of the police (module A)
- household crime prevention and security (module B)
- vehicle crime prevention and security (module C)
- personal and online crime and security (module D)
This methodology note presents findings from analysis to investigate whether increases in ASB are a result of an order effect caused by changes to the survey instrument or are indicative of a genuine rise in these experiences.
The analysis was designed to test two main hypotheses:
- the rise in (a) experiencing or witnessing any ASB and (b) individual types of ASB are the result of an order effect caused by survey changes in April 2018
- the order effect in experiencing or witnessing any ASB will differ across the four different respondent pathways through the questionnaire reflecting different development across the four modules
Main findings
A number of questionnaire changes were implemented across the four respondent pathways in April 2018. Analysis showed that these changes may have had a partial effect on responses to questions on anti-social behaviour (ASB).
- There was evidence of a small order effect on estimates of any ASB. However, this order effect was only identified in one of four respondent pathways (module C). No order effects were found for respondents of split-sample modules A, B and D.
- The order effect observed in module C did not result in a significant change to prevalence estimates of any ASB. The difference in prevalence estimates for the total sample and the total sample excluding module C was minimal, therefore, the increase in ASB was thought to be genuine.
- There was a mixed picture across individual types of ASB. However, for the majority of these ASB experiences, a small order effect was identified. Similarly, to any ASB, most of these effects coincided with genuine rises in recent years.
Background
Research literature on survey methodology has shown that the context and order in which questions appear in a survey can influence the answers given by respondents (see, for example Dillman and others, 2009). Such effects tend to be less striking for questions about facts (such as age or employment status) than for questions about attitudes and experiences, which are more sensitive to the context and order in which questions are asked.
Such effects have been described as cognitive-based or normative-based. Cognitive-based effects are those where answers to earlier questions influence the respondent’s thoughts when answering subsequent questions. Normative-based effects are those where earlier questions lead respondents to align their answers to a social norm.
The Crime Survey for England and Wales (CSEW) is a face-to-face survey in which a nationally representative sample of the population resident in households in England and Wales are interviewed in their own home. The CSEW has measured experiencing and witnessing anti-social behaviour (ASB) since 2012, with the wording of the questions and response options remaining the same:
“Have you personally experienced or witnessed any sort of anti-social behaviour in your local area in the last 12 months?”
and
“What sorts of anti-social behaviour have you personally experienced or witnessed in your local area in the last 12 months?”
Data on ASB are published in Crime in England and Wales: Other related tables as part of the Crime in England and Wales statistical bulletin.
The CSEW questionnaire is reviewed each year to ensure that it continues to meet both user and policy needs, as well as to reflect the changes in the nature of crime. During this review a range of stakeholders are consulted to identify what, if any, development might be required.
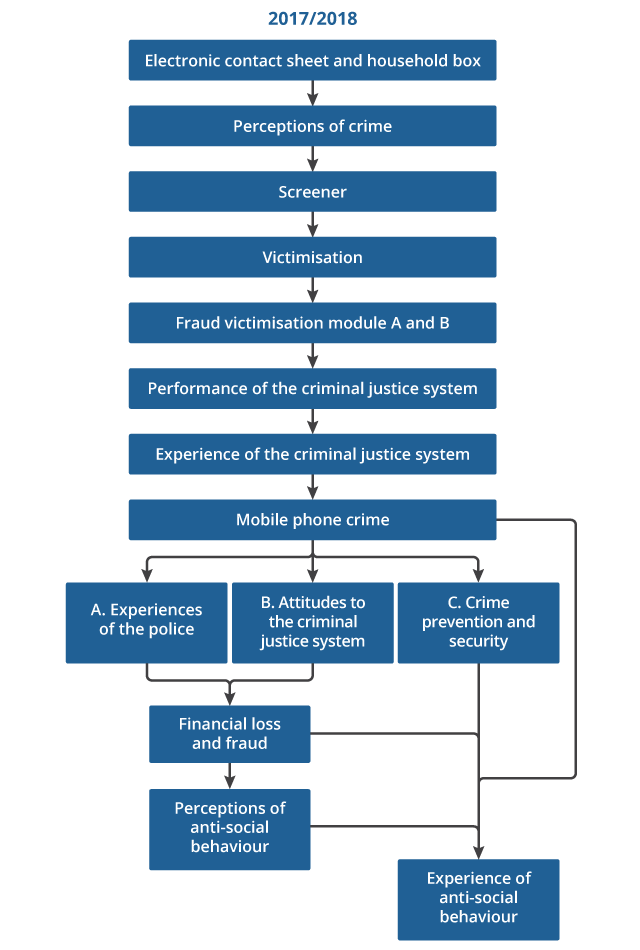
To enable consistency in the time series of our headline crime estimates, there has been minimal change to the main screener questions. However, changes and improvements are often made to other areas of the survey by adding, removing or amending questions when necessary. In April 2018, a range of changes were identified and recommended to be made to the survey instrument. Changes preceding the questions on ASB are presented in Figures 1a and 1b.
Figure 1a: Crime Survey for England and Wales questionnaires for the year ending March 2018
Source: Office for National Statistics - Crime Survey for England and Wales
Download this image Figure 1a: Crime Survey for England and Wales questionnaires for the year ending March 2018
.png (39.0 kB)
Figure 1b: Crime Survey for England and Wales questionnaires for the year ending March 2019

Source: Office for National Statistics - Crime Survey for England and Wales
Download this image Figure 1b: Crime Survey for England and Wales questionnaires for the year ending March 2019
.png (34.9 kB)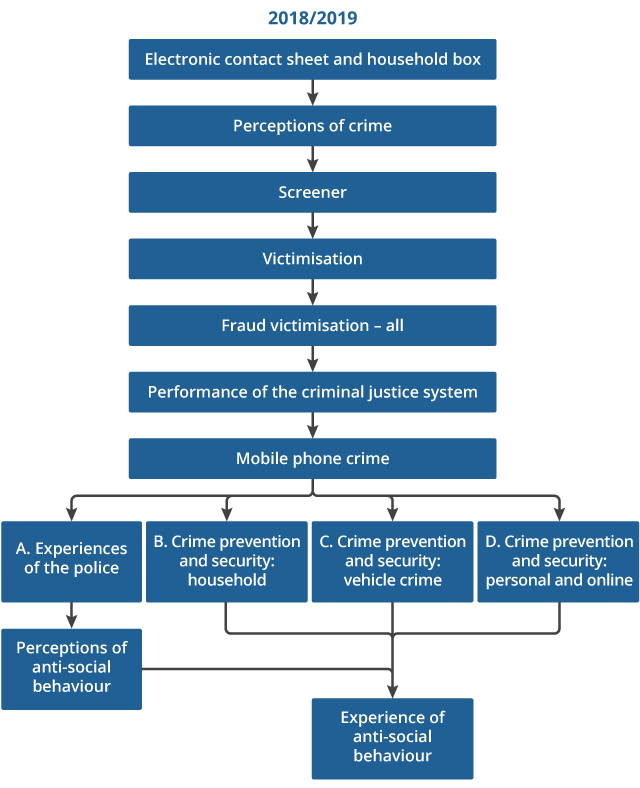
Changes preceding the ASB questions consist of1:
- module removals: the removal of the “experience of the criminal justice system” and “financial loss and fraud” modules
- adjustments to split-sample module content affecting 75% of the sample
Module removals: “experience of the criminal justice system” and “financial loss and fraud”
The “experience of the criminal justice system” module was asked directly following the victimisation modules and at a minimum three modules before the ASB component. The “financial loss and fraud” module was positioned directly before the ASB questions and was answered by respondents in modules A and B.
Adjustments to split-sample modules
In the CSEW, all respondents are randomly allocated to one of four pathways (modules A to D); each module includes 25% of the sample. This process is used to ensure that each split-sample module remains representative of the survey population. Changes to these pathways were implemented in April 2018.
In the year ending March 2018 questionnaire, despite the survey allocating respondents to four split-samples, only three were asked an additional module. These were module A “Experience of the police”, module B “Attitudes to the Criminal Justice System” and module C “Crime prevention and security”. Respondents allocated to module D continued into the “anti-social behaviour” module from the “mobile phone crime module”.
In the year ending March 2019 questionnaire, the “Crime prevention and security” module was split into three separate modules asking about the specific types of crime prevention for “households”, “vehicle crime” and “personal and online”. These were asked to respondents allocated to modules B, C and D, respectively. Those in module A followed the same pathway across both questionnaires.
Notes for: Introduction
- Small changes were also made to the “perceptions of crime”, “victimisation”, “fraud victimisation” and “performance of the criminal justice system” modules.
2. Methodology
Responses to anti-social behaviour (ASB) questions that were believed to have been affected by the questionnaire changes outlined in the first section were analysed using data collected in the Crime Survey for England and Wales between April 2017 and September 2019 (Table 1).
| Variable | Have you personally experienced or witnessed in your local area in the last 12 months? | |
|---|---|---|
| ASBEXP | Any sort of anti-social behaviour | |
| WHASBEXA | Youths, teenagers or groups hanging about on the streets | |
| WHASBEXB | Street drinking, drunken behaviour or under-age drinking | |
| WHASBEXC | Vandalism, criminal damage or graffiti (e.g. to buildings, vehicles, bus shelters, phone boxes, trees or plants, etc.) | |
| WHASBEXD | Inconsiderate behaviour (e.g. repeated or inappropriate use of firework; youths kicking/throwing/playing football in inappropriate areas; cycling/skateboarding in pedestrian areas or obstructing pavements; people throwing stones, bottles, eggs, etc.) | |
| WHASBEXE | Loud music or other noise (e.g. shouting, noisy cars, noise from pubs, etc.) | |
| WHASBEXF | People using or dealing drugs or evidence of drugs (e.g. discarded needles, crack houses) | |
| WHASBEXG | People being intimidated, threatened, verbally abused or harassed (inc. on the grounds of race, religion, disability, sexual orientation, etc.) | |
| WHASBEXH | Environmental e.g. Litter or rubbish (including fly-tipping) or dog fouling | |
| WHASBEXI | Nuisance neighbours | |
| WHASBEXJ | Vehicle related e.g. Inconvenient or illegal parking; abandoned vehicles; speeding cars or motorcycles, joyriding, car revving, boy racers | |
| WHASBEXK | Begging, vagrancy, problems with homeless people | |
| WHASBEXL | Sexual e.g. Prostitution or kerb crawling or evidence of prostitution (e.g. cards in phone boxes, used condoms) People committing inappropriate or indecent sexual acts in public | |
| WHASBEXM | Problems with out of control or dangerous dogs | |
| WHASBEXN | Other anti-social behaviour |
Download this table Table 1. Variables used in this analysis to evaluate the impact of questionnaire changes on the experience of anti-social behaviour
.xls .csvNotes:
- The full Crime Survey for England and Wales (CSEW) questionnaire is available on our crime and justice methodology website pages.
Analysis
The analyses were conducted to account for the clustering by household in the survey design, and data were weighted for non-response bias for estimates of prevalence and associations where appropriate to generate robust standard errors.
Prevalence estimates for any ASB and each type of ASB experienced are reported for the sample using (a) annual1 and (b) monthly data. Prevalence estimates are also estimated for any ASB by the preceding split-sample module; module A, B, C and D.
To identify any order effects, interrupted time series analysis was employed. This method is a form of regression analysis where time is partitioned to estimate the impact of an intervention (Wagner and others, 2002)2 . In this analysis the intervention was represented by the April 2018 questionnaire changes.
The monthly estimates were divided into two time periods, pre- and post-intervention. Using a logistic regression model, we were able to calculate coefficients for these two time periods in order to take into account the already existing trend in the data when calculating the intervention effects (Jebb and others, 2015)3 . Odds ratios were then calculated for the association between prevalence estimates of ASB and intervention effects.
Notes for: Methodology
Annual estimates can be found for the experience of (a) any anti-social behaviour in Table D15 of the Crime in England and Wales: Annual Trend and Demographic Tables and (b) individual types of anti-social behaviour in Table F12a for the Crime in England and Wales: Other related tables.
Wagner, A.K., Soumerai, S.B., Zhang, F. and Ross-Degnan, D. (2002) ‘Segmented regression analysis of interrupted time series studies in medication use research’, Journal of Clinical Pharmacy and Therapeutics, volume 27, pages 299 to 309.
Jebb, A.T., Tay, L., Wang, W. and Huang, Q. (2015) ‘Time series analysis for psychological research: examining and forecasting change’, Frontiers in Psychology, volume 6, pages 1 to 24.
3. Results
Experience of any anti-social behaviour
Crime Survey for England and Wales (CSEW) estimates of experience of any anti-social behaviour (ASB) in the local area from the year ending March 2012 to the year ending March 2018 have fluctuated between 27% and 33% (Table D15, Crime in England and Wales: Annual Trend and Demographic Tables). However, experience of any ASB increased from 33% to 38% from the year ending March 2018 to the year ending March 2019 (Appendix table 1). This increase does follow consistent rises from the year ending March 2016, however, this increase was the largest in magnitude.
Figure 2 provides the prevalence estimates for the experience of any ASB from April 2017 to September 2019 using monthly data (Appendix table 2). There has been a gradual increase over this period that can be observed both before and after the questionnaire changed in April 2018. This suggests that the rise in the experience of ASB observed is at least partly genuine.
Figure 2: Crime Survey for England and Wales experiences of any anti-social behaviour in last 12 months, by month of interview, April 2017 to September 2019
Source: Office for National Statistics - Crime Survey for England and Wales
Notes:
- Percentages are presented for experience of anti-social behaviour in last 12 months by month interviewed.
Download this chart Figure 2: Crime Survey for England and Wales experiences of any anti-social behaviour in last 12 months, by month of interview, April 2017 to September 2019
Image .csv .xlsResults from the interrupted time series analysis showed a significant association between the intervention and an increase in experience of ASB, after accounting for trends pre- and post-intervention (Table 2; Appendix table 3). However, time was also associated with increased ASB in this model. This suggests that an order effect has partially contributed to the increase but that this has coincided with what appears to be a genuine rise in the experience of any ASB over this time period.
Experience of the individual types of ASB
If the respondent answered that they had experienced ASB, they were asked a follow-up question to identify what type of ASB it was.
CSEW estimates in the year ending March 2019 indicated there were significant increases across all types of ASB, such as drink-related behaviour and loud music or other noise (Appendix table 1). Monthly prevalence estimates for the experience of the individual types of ASB from April 2017 to September 2019 show a similar pattern, with a gradual increase before and after the questionnaire changed (Appendix table 2).
Interrupted time series analysis showed that there was an association between the intervention and increased ASB for 9 of the 14 individual types of ASB: groups hanging around on the streets, drink-related behaviour, inconsiderate behaviour, loud music or other noise, people using or dealing drugs, litter, rubbish or dog-fouling, vehicle related behaviour, people committing inappropriate or indecent sexual acts in public and other ASB (Table 2; Appendix table 3).
For the majority of individual ASB types, time was also associated with the increase, suggesting that an order effect had coincided with what appears to be a genuine rise over this time period. However, time was not associated with the increase in people committing inappropriate or indecent sexual acts in public or other ASB. However, these findings should be interpreted with caution because of small sample sizes for these two categories.
Analyses conducted on both any ASB and individual types of ASB only partially support our first hypothesis.
Experience of any anti-social behaviour in split-sample modules
CSEW estimates of experience of any ASB showed increases in all groups when stratified by split-sample module from the year ending March 2018 to the year ending March 2019 (Appendix table 1). However, there were differences between these groups. Whilst modules A, B and D saw percentage point increases between 2 and 5%1 , there was a 9% percentage point increase in any ASB for module C respondents.
Figure 3a, 3b. 3c and 3d shows the monthly prevalence estimates of the experience of any ASB from April 2017 to September 2019 for the four split-sample modules (Appendix table 2). Despite some volatility in these prevalence estimates, caused by smaller sample sizes, there has been a gradual increase across all four modules over time. Most notably, there was a distinct increase in any ASB following questionnaire changes for module C respondents.
Figure 3a: Module A
Crime Survey for England and Wales experiences of anti-social behaviour in last 12 months for each split-sample module, by month of interview, April 2017 to September 2019
Source: Office for National Statistics - Crime Survey for England and Wales
Notes:
- Percentages are presented for experience of anti-social behaviour in last 12 months by month interviewed.
Download this chart Figure 3a: Module A
Image .csv .xls
Figure 3b: Module B
Crime Survey for England and Wales experiences of anti-social behaviour in last 12 months for each split-sample module, by month of interview, April 2017 to September 2019
Source: Office for National Statistics – Crime Survey for England and Wales
Notes:
- Percentages are presented for experience of anti-social behaviour in last 12 months by month interviewed.
Download this chart Figure 3b: Module B
Image .csv .xls
Figure 3c: Module C
Crime Survey for England and Wales experiences of anti-social behaviour in last 12 months for each split-sample module, by month of interview, April 2017 to September 2019
Source: Office for National Statistics – Crime Survey for England and Wales
Notes:
- Percentages are presented for experience of anti-social behaviour in last 12 months by month interviewed.
Download this chart Figure 3c: Module C
Image .csv .xls
Figure 3d: Module D
Crime Survey for England and Wales experiences of anti-social behaviour in last 12 months for each split-sample module, by month of interview, April 2017 to September 2019
Source: Office for National Statistics – Crime Survey for England and Wales
Notes:
- Percentages are presented for experience of anti-social behaviour in last 12 months by month interviewed.
Download this chart Figure 3d: Module D
Image .csv .xlsThe results from the interrupted time series analysis showed that increased ASB was only associated with the intervention for respondents who answered module C questions, supporting our second hypothesis (Table 2; Appendix table 3). There was no association between increased ASB and questionnaire changes for the other respondent pathways (module A, B and D). Although there was an association between increased ASB and the intervention in module C, it was also associated with time in this model. Again, this suggests that the order effect has also been accompanied by a genuine rise in ASB as reported previously.
Although the order effect in module C was significantly associated with increased ASB, the effect was small and had minimal impact on prevalence estimates. In the year ending March 2019, 37.8% of respondents reported any ASB in the total sample compared with 36.9% of respondents if you exclude those who answered module C questions (Appendix table 1). This difference was less than 1% and was not statistically significant.
| England and Wales | Adults aged 16 and over | |
|---|---|---|
| Questionnaire changes¹ | Time² | |
| Statistically significant association³ | ||
| Personally experienced/witnessed anti-social behaviour in local area | * | * |
| Types of anti-social behaviour experienced/witnessed | ||
| Groups hanging around on the streets | * | * |
| Drink related behaviour | * | * |
| Vandalism, criminal damage or graffiti | * | |
| Inconsiderate behaviour⁴ | * | * |
| Loud music or other noise | * | * |
| People using or dealing drugs | * | * |
| Being intimidated, verbally abused or harassed | * | |
| Litter, rubbish or dog fouling | * | * |
| Nuisance neighbours | * | |
| Vehicle related behaviour⁵ | * | * |
| Begging, vagrancy or homeless people | * | |
| People committing inappropriate or indecent sexual acts in public | * | |
| Out of control or dangerous dogs | ||
| Other anti-social behaviour | * | |
| Personally experienced/witnessed anti-social behaviour in local area by split-sample module | ||
| Module A | ||
| Module B | * | |
| Module C | * | * |
| Module D | * | |
Download this table Table 2: Significant associations between experiences of anti-social behaviour with questionnaire changes and trend over time from interrupted time series analyses using
.xls .csvNotes:
Association between questionnaire changes implemented in April 2017 and increased experience of anti-social behaviour indicated by an asterisk.
Association between the trend over time before and after questionnaire changes with increased experience of anti-social behaviour indicated by an asterisk.,Statistically significant change at the 5% level is indicated by an asterisk. For more information on statistical significance, see Chapter 8 of the User Guide.
Includes repeated or inappropriate use of fireworks; youths kicking or throwing balls in inappropriate areas; cycling or skateboarding in pedestrian areas or obstructing pavements; people throwing stones, bottles or eggs and so on.
Includes inconvenient or illegal parking; abandoned vehicles; speeding cars or motorcycles; car revving; joyriding and so on.
Conclusion
Following changes to the survey in April 2018, a small order effect was observed on a split-sample of the survey (module C). The order effect observed in module C could be the result of cognitive-based effects, as hypothesised.
As part of this module, respondent answers related to vehicle crime prevention and security. Although these questions do not directly relate to experience of ASB, answers on vehicle security may have influenced their thoughts when answering questions on experiencing or witnessing ASB in the local area, particularly individual types of ASB, such as vehicle-related behaviour and vandalism.
The impact on prevalence estimates was minimal and did not result in a significant change. Although a more mixed picture, the small order effects observed for individual types coincided with genuine rises in ASB over time.
Recommendation
Given the order effect was small in nature and coincided with genuine increases in the experience of ASB over time, estimates remain broadly comparable. We recommend that these estimates continue to be used with the caveat that a small proportion of the increase may be caused by questionnaire changes implemented in April 2018.
Notes for: Results
- The percentage point change from the year ending March 2018 to the year ending March 2019 for the split-sample modules were: Module A – 3.5%, Module B – 4.4%, Module C – 8.9% and Module D – 2.3%.