Table of contents
- Main points
- Summary
- Introduction
- Offences recorded as homicide
- Case outcomes
- Victims
- Method of killing
- Relationship between victim and principal suspect
- Circumstances of the homicides
- Location of the homicides
- Focus on domestic homicides
- Homicide risk for different age groups
- Drug and alcohol-related homicides
- Suspects
- Previous homicide convictions
- International homicide comparisons
- Statistical interpretation of trends in homicide
- Background notes
1. Main points
The Home Office Homicide Index showed there were 518 homicides (murder, manslaughter and infanticide) in the year ending March 2015 in England and Wales. This represents a decrease of 5 offences (1%) from the 523 recorded for the previous year.
Over recent years, the number of currently recorded homicides has shown a general downward trend and the number for the year ending March 2015 (518) was the lowest since 1983 (482).
In the year ending March 2015, there were 9.0 offences of homicide per million population. As in previous years, children under 1 year old had the highest rate of homicide (35.8 offences per million population) compared with other age groups, the highest since year ending March 2004 (42.8).
With the exception of those aged under 1 year, adults generally had higher incidence rates of being a victim of homicide than children. For children aged 1 or over, homicide rates were higher for 1 to 4 year olds (4 per million) than for 5 to 15 year olds (2 per million).
In the year ending March 2015, just under two-thirds of homicide victims (64%) were male, the lowest since 1996 (64%).
There were differences between males and females in the pattern of relationships between victims and suspects. Women were far more likely than men to be killed by partners/ex-partners (44% of female victims compared with 6% of male victims), and men were more likely than women to be killed by friends/ acquaintances (32% of male victims compared with 8% of female victims).
In the year ending March 2015, there were 54 homicide victims aged under 16 years. Three-fifths of these victims were killed by a parent or step-parent (60%, or 31 offences).
The most common method of killing continued to be by knife or other sharp instrument. In the year ending March 2015, there were 186 victims killed in this way, accounting for over 1 in 3 (36%) homicides.
In the year ending March 2015, 21 homicide victims (4% of the total) were killed by shooting, 8 fewer than the previous year and the lowest number since 1980 (19 homicides).
2. Summary
This chapter presents analyses of homicides recorded by the police in the year ending March 2015. The information comes from the Home Office Homicide Index, which contains detailed record-level information about each homicide recorded by police in England and Wales. The database is continually updated with revised information from the police and the courts and, as such, is a richer source of data than the main recorded crime dataset.
The data in this section are for the year ending March 2015, and figures for the year ending September 2015 show that the number of homicides recorded has increased. These will be analysed in subsequent publications, as the police continue to populate the Homicide Index.
Back to table of contents3. Introduction
The term ‘homicide’ covers the offences of murder, manslaughter and infanticide. Murder and manslaughter are common law offences that have never been defined by statute, although they have been modified by statute. In this bulletin the manslaughter category includes the offence of corporate manslaughter which was created by the Corporate Manslaughter and Corporate Homicide Act 2007 which came into force on 6 April 2008. The offence of infanticide was created by the Infanticide Act 1922 and refined by the Infanticide Act 1938 (section 1).
Data presented in this chapter have been extracted from the Home Office Homicide Index which contains detailed record-level information about each homicide recorded by police in England and Wales. It is continually updated with revised information from the police and the courts and, as such, is a richer source of data than the main recorded crime dataset1. Data presented here are therefore more accurate than the homicide figures presented in the Crime in England and Wales quarterly releases2.
In accordance with the Statistics and Registration Service Act 2007, statistics based on police recorded crime data (including figures from the Homicide Index) have been assessed against the Code of Practice for Official Statistics and found not to meet the required standard for designation as National Statistics. The full assessment report can be found on the UK Statistics Authority website. Further information on the interpretation of recorded crime data is provided in the User Guide.
Homicide Index data are based on the year when the offence was recorded, not when the offence took place or when the case was heard in court. While in the vast majority of cases the offence will be recorded in the same year as it took place, this is not always the case. The data refer to the position as at 13 November 2015, when the Homicide Index database was ‘frozen’ for the purpose of analysis3. The data will change as subsequent court hearings take place or as other information is received.
Caution is needed when looking at longer-term homicide trend figures, primarily because they are based on the year in which offences are recorded by the police rather than the year in which the incidents took place. For example, the 172 homicides attributed to Dr Harold Shipman as a result of Dame Janet Smith’s inquiry took place over a long period of time but were all recorded by the police during the year ending March 2003. Also, where several people are killed by the same suspect, the number of homicides counted is the total number of victims killed rather than the number of incidents. For example, the victims of the Cumbrian shootings committed by Derrick Bird on 2 June 2010 are counted as 12 homicides rather than one incident in the year ending March 2011 data.
Notes for introduction
For example, when the police initially record an offence as a homicide it remains classified as such unless the police or courts decide that a lesser offence, or no offence, took place. The offence would be reclassified on the Homicide Index as ‘no longer recorded’ but remain in the main police recorded crime collection as a homicide.
Provisional homicide figures published in the Crime in England and Wales, Year ending March 2015 release showed 533 homicides recorded in the year ending March 2014 and 534 for the year ending March 2015. The corresponding figures from the Homicide Index were 523 and 518.
The Homicide Index is continually updated with revised information from the police as investigations continue and as cases are heard by the courts. The version used for analysis does not accept updates after it is ‘frozen’ to ensure the data do not change during the analysis period. See Section 3.1 of the User Guide for more information.
4. Offences recorded as homicide
When the police initially record an offence as a homicide, it remains classified as such unless the police or courts decide that a lesser offence, or no offence, took place. In all, 530 deaths were initially recorded as homicides by the police in the year ending March 2015 and by 13 November 2015, 12 were no longer recorded as homicides1, giving a total of 518 offences currently recorded as homicides.
Homicides generally increased from the 1960s up to the early 2000s (the peak in the year ending March 2003 includes 172 homicides committed by Dr Harold Shipman). There has been a general downward trend since the year ending March 2003.
The total number of offences recorded as homicide in the year ending March 2015 was 518. This represents a decrease of 5 offences (1%) from the 523 recorded for the previous year, the lowest number since 1983, when 482 homicides were recorded.
We also published more up-to-date figures on homicide from the main recorded crime return as part of our Crime Statistics in England and Wales series. Figures for the year ending September 2015 show that there were 574 homicides recorded by the police, higher than the 518 currently recorded homicides in the year ending March 2015 shown here. These figures are from different sources, but show that homicide does appear to have increased in the months following the time period that this bulletin reports on.
There were 331 male victims of homicide in the year ending March 2015, down 3% from 340 in the previous year and continuing a generally downward trend. In contrast, the number of female homicide victims increased slightly, from 183 to 186 victims (a 3% increase), although the longer- term trend is slowly downward.
To put the actual number of homicides in context, incidence rates show the volume of offences as a proportion of the resident population. The incidence rate for homicide remains relatively low, with 9.0 homicides recorded per million population during the year ending March 2015, the lowest homicide rate since the late 1970s (for example, there were 8.5 homicides per million population in 1977). If the 172 homicides committed by Harold Shipman recorded in the year ending March 2003 are excluded from the analysis, homicide rates peaked in the year ending March 2002, at 15.2 offences per million population2 (Figure 2.1).
Figure 2.1: The incidence rate per million population for homicide offences currently recorded by the police in England and Wales, year ending December 1967 to year ending March 2015
Source: Homicide Index, Home Office
Notes:
- Homicide Index data are not designated as National Statistics.
- Year ending December 1987 includes 15 victims of Michael Ryan.
- Year ending March 2001 includes 58 Chinese nationals who suffocated in a lorry en route into the UK.
- Year ending March 2003 includes 172 victims of Dr Harold Shipman.
- Year ending March 2004 includes 20 cockle pickers who drowned in Morecambe Bay.
- Year ending March 2006 includes 52 victims of the 7 July London bombings.
- Year ending March 2011 includes 12 victims of Derrick Bird.
Download this chart Figure 2.1: The incidence rate per million population for homicide offences currently recorded by the police in England and Wales, year ending December 1967 to year ending March 2015
Image .csv .xlsCompared with most other offences, homicides are relatively low-volume events, and year-on-year variations need to be interpreted with some caution. However, an analysis of trends (discussed in ‘Statistical interpretation of trends in homicides’ later in this chapter) shows the reduction in homicides in recent years was statistically significant and indicates a real fall in this offence rather than merely a consequence of random year-to-year variation.
Notes for offences recorded as homicide
For example, following further investigation the police determined that the case was a suicide not a homicide.
In the year ending March 2003, the rate of homicide was 17.9 homicides per million population. If the 172 Harold Shipman homicides recorded that year are excluded, the rate would have been 14.6 offences per million population.
5. Case outcomes
The circumstances surrounding a homicide may be complex and it can take time for cases to pass through the criminal justice system (CJS). Due to this, the percentage of homicides recorded in the year ending March 2015 (and, to a lesser extent, those recorded in earlier years) that have concluded at Crown Court is likely to show an increase when the next figures from the Homicide Index are published in 12 months’ time. Conversely, the proportion of cases without suspects or with court proceedings pending is expected to decrease as police complete more investigations and as cases pass through the CJS (see ‘Suspects’ section within this chapter for further details).
Where there are multiple suspects in a homicide case they are categorised in the Homicide Index as either the principal or a secondary suspect. There is only ever 1 principal suspect per homicide victim. If there is any conviction information available then the suspect with the longest sentence or most serious conviction is determined to be the principal suspect. In the absence of any court outcome, the principal suspect is either the person considered by the police to be the most involved in the homicide or the suspect with the closest relationship to the victim.
As more than 1 person can be convicted for a single homicide, the number of people convicted will not necessarily be the same as the number of victims recorded. However, if the outcome of only the principal suspect in each case is examined (that is, 1 suspect per victim), this can provide a more direct comparison to the case outcome of each homicide.
Of the 518 cases currently recorded as homicide in the year ending March 2015, data on the case outcomes of the principal suspects at 13 November 2015 showed (Appendix Table 2.02):
court proceedings had resulted in homicide convictions in 198 cases (38%)
court proceedings were pending for 173 cases (33%)
proceedings had been discontinued or not initiated or all suspects had been acquitted in 18 cases (3%)
suspects had committed suicide in 28 cases (5%)
no suspects had been charged in connection with 99 cases (19%)
These figures are similar to those published last year for the year ending March 2014, with the exception of cases with no suspects (13%). Analysis of homicide suspects is included in the ‘Suspects’ section of this chapter.
Back to table of contents6. Victims
In the year ending March 2015, just under two-thirds of homicide victims were male (64%, 331 victims) and one-third were female (36%, 186 victims). The proportion of victims that were male was slightly lower than in previous years (68 to 69% of victims were male in the previous 5 years), and the lowest since 19961 (64%). Among the 25 victims aged under 1 year old, 64% were male, a higher percentage than in previous years.
Although there was a small decrease in the number of male victims in the year ending March 2015 compared with the previous year (down from 340 to 331; a 3% fall) and the number of female victims increased slightly from 183 to 186 (2%), the general trend remained flat (Figure 2.2).
In the year ending March 2015, the homicide rate for males (11.7 per million population) was almost twice that for females (6.4 per million population). The homicide rate has consistently been higher for males than for females, although the difference between the rates for men and women is much smaller than it used to be (Appendix Table 2.03). It should be noted that the nature of homicides differs between men and women, as discussed in the ’Relationship between victim and principal suspect’ section of this chapter.
Figure 2.2: Homicide offences currently recorded by the police in England and Wales by sex of victim, year ending March 1997 to year ending March 2015
Source: Homicide Index, Home Office
Notes:
- Homicide Index data are not designated as National Statistics.
- Year ending March 2003 includes 42 male and 130 female victims of Dr Harold Shipman.
- Year ending March 2012 includes 1 victim with unknown gender
- Year ending March 2015 includes 1 victim with unknown gender.
Download this chart Figure 2.2: Homicide offences currently recorded by the police in England and Wales by sex of victim, year ending March 1997 to year ending March 2015
Image .csv .xlsNotes for victims
- Excluding year ending March 2003 which included 42 male and 130 female victims of Dr Harold Shipman.
7. Method of killing
As in previous years, the most common method of killing for both male and female victims was by a knife or other sharp instrument, with 186 such homicides (36% of the total) recorded in the year ending March 2015 compared with 204 (39%) in the previous year (Appendix Table 2.04). This is the lowest number of homicides by knife or sharp instrument since 1993 (182). Although the absolute number of homicides committed by knives or sharp instruments has fallen over recent years, the proportion of homicides committed by this method has only fluctuated slightly from year-to-year as there has been a general downward trend in all homicides.
The second most common method of killing was ‘kicking or hitting without a weapon’, accounting for 95 homicides (18% of the total), a proportion that has remained roughly a fifth over the last decade. The majority (87%) of those killed in this way were male victims.
Twenty-one homicide victims were killed by shooting, 8 fewer than the previous year and the lowest number since 1980 (19 homicides).
Similar proportions of male and female victims were killed by a sharp instrument or by a blunt instrument but there were differences in other methods between the sexes. For example, while hitting and kicking without a weapon was the second most common method for male victims, for female victims it was strangulation or asphyxiation (34 homicides in the year ending March 2015; 18% of female homicides). Differences in methods of killing by sex of victim are likely to reflect differences in victim/suspect relationships as discussed below (Figure 2.3).
Figure 2.3: Offences currently recorded as homicide by apparent method of killing and sex of victim, year ending March 2015
England and Wales
Source: Homicide Index, Home Office
Notes:
- Homicide Index data are not designated as National Statistics.
- Includes all other apparent methods and where method is unknown.
Download this chart Figure 2.3: Offences currently recorded as homicide by apparent method of killing and sex of victim, year ending March 2015
Image .csv .xls8. Relationship between victim and principal suspect
Data on relationship of victim to principal suspect for the year ending March 2015 show similar findings to previous years. There were differences between males and females in the pattern of relationships between victims and suspects. Female victims (68%) were more likely than male victims (52%) to have been acquainted with the principal suspect (Appendix Table 2.05; Figure 2.4)1.
In particular, women were far more likely than men to be killed by partners/ex-partners (44% of female victims compared with 6% of male victims), and men were far more likely than women to be killed by friends or acquaintances (32% of male victims and 8% of female victims) or strangers (31% of male victims compared with 12% of female victims).
Figure 2.4: Relationship of victim to principal suspect by sex of victim, year ending March 2015
England and Wales
Source: Homicide Index, Home Office
Notes:
- Homicide Index data are not designated as National Statistics.
Download this chart Figure 2.4: Relationship of victim to principal suspect by sex of victim, year ending March 2015
Image .csv .xlsTo account for differences by age in victim relationships to principal suspect, the analysis in the next 2 sections reports on victims aged 16 and over and victims aged under 16 separately.
Victims aged 16 years and over
There were large differences in the victim-suspect relationship between men and women. In the year ending March 2015, just under half (49%) of female victims aged 16 or over were killed by their partner/ex-partner2 (81 offences). This is 5 percentage points lower than that found in the year ending March 2014 (54%) but broadly similar to the year ending March 2013 and continues a general downward trend since year ending March 2009.
In contrast, only 6% of male victims aged 16 or over were killed by their partner/ex-partner in the year ending March 2015 (19 offences), a percentage that is similar to previous years (Appendix Table 2.06, Figure 2.5).
Figure 2.5: Number of homicide victims aged 16 and over killed by partner/ex-partner, by sex of victim, year ending March 2005 to year ending March 2015
England and Wales
Source: Homicide Index, Home Office
Notes:
- Homicide Index data are not designated as National Statistics.
Download this chart Figure 2.5: Number of homicide victims aged 16 and over killed by partner/ex-partner, by sex of victim, year ending March 2005 to year ending March 2015
Image .csv .xlsJust over one-third (36%) of male victims aged 16 or over were killed by a friend/acquaintance in the year ending March 2015 (similar to that found in the year ending March 2013, 39%, but lower than the year ending March 2014 figure of 43%) although there is some fluctuation in the series. In contrast, female adult victims were less likely than men to be killed by a friend/acquaintance, at 8% of homicides in the year ending March 2015 (13 offences).
In the year ending March 2015, around 1 in 3 male victims (102 males, 34%) and around 1 in 8 female victims (21 females, 13%) aged 16 and over were killed by strangers.
Victims aged under 16 years
In the year ending March 2015, there were 54 victims under 16 years of age, compared with 47 victims in the previous year.
Of the 518 offences currently recorded as homicide in the year ending March 2015, 10% involved victims under the age of 16, a similar proportion to the year ending March 2014 (9%, Appendix Table 2.03). In previous years, a higher percentage of female victims were aged under 16 than male victims, but in the year ending March 2015, there was little difference in this pattern between males and females (10% of currently recorded male homicide victims and 11% of female homicide victims were aged under 16).
As in previous years, the majority of victims aged under 16 were acquainted with the principal suspect (65%, 35 offences), and in all but 4 of these cases they were killed by a parent or step-parent (Figure 2.6).
Proportionally few homicides of those aged under 16 are committed by strangers. The victim was known to have been killed by a stranger in 3 offences in the year ending March 2015 (6%). This has varied between 1 and 9 offences in each year over the last decade.
As of 13 November 2015, there were 16 victims aged under 16 (30%) for whom no suspect had been identified, a higher proportion than among adult victims (17%). This number is likely to fall as police investigations continue3.
Figure 2.6: Victims under 16 years of age, by relationship of victim to principal suspect, year ending March 2013 to year ending March 2015
England and Wales
Source: Homicide Index, Home Office
Notes:
- Homicide Index data are not designated as National Statistics.
- Figures are likely to change as cases progress through the courts and more information becomes available.
Download this chart Figure 2.6: Victims under 16 years of age, by relationship of victim to principal suspect, year ending March 2013 to year ending March 2015
Image .csv .xlsNotes for relationship between victim and principal suspect
The relationship between victim and principal suspect is not always known and, for the purposes of this analysis, such cases have been included in the ‘stranger’ category. Stranger category includes: business associate, police/prison officer killed in the course of duty, stranger (terrorist/contract killing and other) and where there is insufficient information about the suspect to determine relationship to victim.
Partner/ex-partner includes the sub-categories 'spouse, cohabiting partner, boyfriend/girlfriend, ex-spouse/ex-cohabiting partner/ex-boyfriend/girlfriend, adulterous relationship, lover’s spouse or emotional rival'.
For example, Table 2.07 in the year ending March 2014 release showed that for homicides of victims aged under 16 recorded in the year ending March 2014, there were 15 for whom there was no suspect. This had fallen to 12 by the time the Homicide Index was frozen for analysis on 13 November 2015. (Appendix Table 2.07).
9. Circumstances of the homicides
About a half (48%, or 247 offences) of all homicide cases in the year ending March 2015 resulted from a quarrel, a revenge attack or a loss of temper. This proportion was higher where the principal suspect was known to the victim (59%), compared with when the suspect was unknown to the victim (33%). A further 7% (35 offences) were attributed to irrational acts1 and 4% of homicides (19 offences) occurred during furtherance of theft or gain. As at 13 November 2015, the apparent circumstances were not known for 17% of homicides (87 offences) recorded in the year ending March 2015 (Appendix Table 2.08). This figure is likely to decrease as the police carry out further investigations.
Notes for circumstances of the homicides
- These figures for irrational acts do not account for all homicides committed by mentally disturbed people, as offences with an apparent motive (for example, during a quarrel or robbery) are instead included under the respective circumstance. Higher overall totals for homicides committed by mentally disturbed people are quoted elsewhere (National Confidential Inquiry into Suicide and Homicide by People with Mental Illness).
10. Location of the homicides
Over a half (56%, or 289 offences) of all homicide cases in the year ending March 2015 occurred in a house or a dwelling. Around a fifth (19% of homicides, 96 offences) occurred in a street, footpath or alleyway and 6% took place in an open outdoor area (33 offences)1.
The pattern was different for males and females, reflecting differing victim-suspect relationships (Appendix Table 2.09, Figure 2.7). The majority of female homicides (82%, 152 offences) took place in or around a house or dwelling or residential home compared with 49% of male homicides (161 offences). A quarter of male homicides took place in a street, path or alleyway (82 offences) compared with only 8% of female homicides (14 offences).
Figure 2.7: Offences currently recorded as homicide by location of homicide and sex of victim, year ending March 2015
England and Wales
Source: Homicide Index, Home Office
Notes:
- Homicide Index data are not designated as National Statistics.
- 'House, dwelling (in and around)' includes residential homes.
- 'Other' includes all other locations including unknown.
Download this chart Figure 2.7: Offences currently recorded as homicide by location of homicide and sex of victim, year ending March 2015
Image .csv .xlsNotes for location of the homicides
- ‘Open outdoor area’ here includes the category from the Homicide Index and car parks.
11. Focus on domestic homicides
This section looks in more detail at the characteristics of the victims of domestic homicides. ‘Domestic’ on the Homicide Index includes the following categories: spouse, cohabiting partner, boyfriend/girlfriend, ex-spouse/ex-cohabiting partner/ex-boyfriend/girlfriend, adulterous relationship, lover’s spouse, emotional rival1, son/daughter or parent (including step and adopted relationships), brother/sister and other relatives.
Due to the relatively low volume of homicides there can be considerable year-to-year variability, and so this analysis combines data for a 3-year period (year ending March 2013 to year ending March 2015) to provide more robust results. Figures in this section are compared with homicides where the relationship was not ‘domestic’, and excludes those aged under 16 years old.
There was little difference in the average age of domestic homicide victims by sex, with the average age for males being 47 and for females 46. However, male victims of domestic homicides were slightly older on average than non-domestic male homicide victims (47 compared with 39 years old). In contrast, female victims of domestic homicides were on average the same age as female non-domestic homicide victims (both 46 years old) (Appendix Table 2.10).
Over three-quarters (77%) of female domestic homicide victims were killed by a partner/ex-partner, with the remaining 23% killed by a family member. For male homicides, there was a much more even split, with around a half (51%) of victims killed by a partner/ex-partner and the other half (49%) killed by a family member.
Male victims of domestic homicides were more likely to be White (84%) than male victims of non-domestic homicides (77%). Among females, victims of domestic homicides were less likely to be White (76% compared with 86% of female victims of non-domestic homicides), and more likely to be Asian (12%, compared with 7% of female non-domestic homicide victims).
The method of killing showed a different pattern among male victims of domestic homicide compared with non-domestic male homicide victims:
60% of male victims of domestic homicide were killed with a sharp instrument, compared with 41% for non-domestic male victims aged 16 and over
12% of male victims of domestic homicide were killed by hitting or kicking without a weapon, compared with 28% of non-domestic male homicide victims aged 16 and over
The difference was less marked for women, where 45% of domestic homicide victims were killed with a sharp instrument, compared with 43% of non-domestic female homicide victims aged 16 and over. Conversely, 23% of female victims of domestic homicide were killed by strangulation (72 victims), compared with 6% (5 victims) of non-domestic female homicide victims aged 16 and over.
The majority (97%) of the female domestic homicide victims were killed by a male suspect, whereas among men, only around a third of domestic homicide victims were killed by a female suspect. Among non-domestic adult homicides, 94% of male and 89% of female victims aged 16 or over were killed by a male suspect.
Notes for focus on domestic homicides
- “Emotional rival” is defined as those instances where 2 persons come to know or meet each other through their association or knowledge of a third person, and where their emotional or sexual interest in this third person brings them into direct conflict with each other.
12. Homicide risk for different age groups
Analysis and commentary in this section focuses on data combined from the last 3 years (the year ending March 2013 to the year ending March 2015) to allow a more detailed breakdown of age groupings, including by sex (Figure 2.8; Appendix Table 2.11).
Previous analysis of Homicide Index figures has consistently shown that children under the age of 1 have the highest rate of homicide per million population (Appendix Table 2.03) and the analysis here shows that they were disproportionately represented, accounting for 4% of homicide victims but only 1% of the population (Appendix Table 2.11).
Victims aged between 20 and 49 years old also formed a disproportionately large number of victims compared with the population profile, particularly so for those in the 20 to 24 years age group. While 7% of the population were aged 20 to 24, this age group accounted for 11% of homicide victims (173 victims).
The relatively high incidence rate among 20 to 24 year olds was largely due to the higher incidence rate amongst males in this age group. While 7% of the male population were aged 20 to 24, this age group accounted for 12% of male homicide victims (129 victims).
There was a disproportionately high number of female victims aged 75 and over compared with the population profile (13% of female homicide victims were aged 75 and over, whereas 9% of the female population was in this age group). Conversely, male victims were less likely to be aged 75 and over (4%) compared with the population profile (7% were in this age group).
A disproportionately small number of victims were in the age groups 5 to 9 years and 10 to 14 years. For example, while 6% of the population were aged 10 to 14 years old, this age group accounted for only 1% of homicide victims (17 victims).
Figure 2.8: Age and gender profile of currently recorded homicide victims compared with population, combined years, year ending March 2013 to year ending March 2015

Source: Homicide Index, Home Office
Notes:
- Homicide Index data are not designated as National Statistics.
Download this image Figure 2.8: Age and gender profile of currently recorded homicide victims compared with population, combined years, year ending March 2013 to year ending March 2015
.png (15.4 kB) .xls (40.4 kB)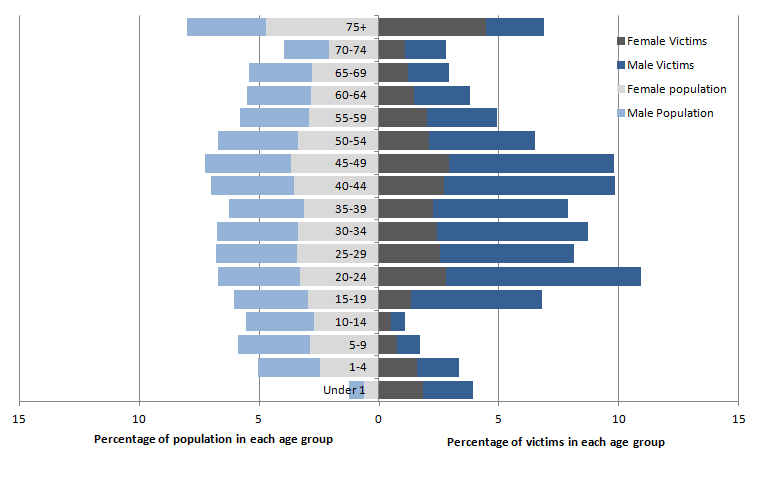
Additional analysis has previously been conducted on the ethnicity, sex, age and method of killing of victims and their inter-relationships. Differences were found in the sex and age profile and method of killing by ethnicity and the results are discussed in Focus on Violent Crime and Sexual Offences, 2012/13.
Back to table of contents14. Suspects
Definition of homicide suspect
For the purposes of the Homicide Index, a suspect in a homicide case is defined as:
(i) a person who has been arrested in respect of an offence initially classified as homicide1 and charged with homicide; or
(ii) a person who is suspected by the police of having committed the offence but is known to have died or committed suicide prior to arrest/being charged
More than 1 suspect may be charged per homicide victim and in some cases no suspect is ever charged (Table 2.1). Due to this, the number of suspects is not the same as the number of offences. It should also be noted that the number of cases with no suspect will reduce as the police continue their investigations.
Table 2.1: Number of suspects for initially recorded homicide victims, year ending March 2013 to year ending March 2015
| England and Wales | ||||||
| Apr '12 to Mar '13 | Apr '13 to Mar '14 | Apr '14 to Mar '15 | ||||
| Number | % | Number | % | Number | % | |
| No suspects charged | 65 | 9 | 57 | 8 | 99 | 15 |
| One | 354 | 49 | 361 | 49 | 330 | 50 |
| Two | 138 | 19 | 118 | 16 | 114 | 17 |
| Three or more | 169 | 23 | 207 | 28 | 114 | 17 |
| All initially recorded homicides | 726 | 100 | 743 | 100 | 657 | 100 |
| Source: Homicide Index, Home Office | ||||||
| Notes: | ||||||
| 1. Homicide Index data are not designated as National Statistics | ||||||
| 2. As at 13 November 2015; figures are subject to revision as cases are dealt with by the police and by the courts, or as further information becomes available. | ||||||
Download this table Table 2.1: Number of suspects for initially recorded homicide victims, year ending March 2013 to year ending March 2015
.xls (35.8 kB)In total, there were 558 suspects as at 13 November 2015 relating to the 530 homicides initially recorded in the year ending March 2015 (Appendix Table 2.15). Of these:
court proceedings had concluded for 285 suspects (51% of all suspects)
court proceedings were pending for 244 suspects (44%)
27 suspects had committed suicide or died (5%)
the remaining 2 suspects had no proceedings taken on advice of the Director of Public Prosecutions
For those suspects where proceedings had concluded, 90% were male (257 suspects), 9% were female (26 suspects) and in 1% (2 cases) the homicides were corporate manslaughter (data not shown).
Among male suspects:
just under half (48%) of those indicted for a homicide offence and with a court outcome were convicted of murder
a third (33%) were convicted of manslaughter
12% were acquitted or their proceedings were discontinued
7% had another outcome2.
For females indicted for homicide with an outcome:
17% were convicted of murder
42% were convicted of manslaughter
4% were convicted of a lesser offence
A third (33%) were acquitted or had their proceedings discontinued
4% had another outcome2
In the 3 years from the year ending March 2013 to the year ending March 2015, 83% of suspects indicted for homicide (murder, manslaughter or infanticide) with a court outcome were found guilty of homicide and 11% were acquitted (Appendix Table 2.16). Similar criminal justice statistics produced by the Ministry of Justice (MoJ) in their publication Criminal Justice System Statistics Quarterly, December 2014 show that the conviction ratio (the number of convictions within a given period divided by the number of prosecutions in the same period) for homicide offences in 2014 was 88%3. This is a relatively high conviction ratio and, for example, compares with 68% for violence against the person offences, and 73% for burglary offences.
The case outcomes for suspects of homicides recorded in the year ending March 2015 (Figure 2.9) are likely to change as cases progress through the criminal justice system (CJS) and more information becomes available. As such, cases from previous years are more likely to have concluded at court. This is illustrated in Figure 2.9 which shows the court outcomes for all suspects of homicides recorded in the year ending March 2011 and the year ending March 2015. While court proceedings were pending for 44% of the suspects in homicides recorded in the year ending March 2015, proceedings were pending for only 23% of the cases recorded in the year ending March 2011. Conversely, 40% of the suspects of homicides recorded in the year ending March 2015 had been to court and been convicted of homicide compared with 57% of those recorded in the year ending March 2011.
Figure 2.9: Current outcomes for suspects of homicides recorded in year ending March 2011 and March 2015
England and Wales
Source: Homicide Index, Home Office
Notes:
- Homicide Index data are not designated as National Statistics.
- As of 13 November 2015.
- Includes suspect unfit to plead, proceedings concluded with other outcome, suspect committed suicide or died and the cases where no court proceedings were taken.
Download this chart Figure 2.9: Current outcomes for suspects of homicides recorded in year ending March 2011 and March 2015
Image .csv .xlsNotes for suspects
The homicide may no longer be recorded as such if all the suspects were acquitted.
‘Other outcome’ includes suspect unfit to plead, proceedings concluded with other outcome, suspect committed suicide or died and the cases where no court proceedings were taken.
It is worth noting that offenders found guilty in a given year may have been proceeded against in previous year.
15. Previous homicide convictions
The Homicide Index shows that in the year ending March 2015 there were 3 convictions for homicide offences for suspects who had a previous conviction for homicide. As more cases are concluded at Crown Court, this figure may change. For homicide offences recorded in the year ending March 2014, there were 6 people convicted of homicide who had a previous conviction for homicide (Appendix Table 2.18).
For homicide offences recorded between the year ending March 2005 and the year ending March 2015 in total, 48 people who were convicted of a homicide offence had a previous conviction for homicide (less than 1%). Of these 48 offences, the second conviction was for murder in 41 cases ([Appendix Table 2.192).
Back to table of contents16. International homicide comparisons
A number of international organisations, including Eurostat, have attempted to collate international homicide statistics. There are issues surrounding the comparability of international homicide data including:
different definitions of homicide between countries, although definitions vary less than for some other types of crimes
differing points in criminal justice systems at which homicides are recorded, for instance, when the offence is discovered or following further investigation or court outcome
the figures are for completed homicides (that is, excluding attempted murder) but, in some countries, the police register any death that cannot immediately be attributed to other causes as homicide
Caution should therefore be taken in comparing homicide rates across countries.
Figures published by Eurostat show that police recorded intentional homicide offences consistently decreased across EU member states from 2008 to 2013.
The Scottish Government publish annual homicide figures, and the most recently published report shows that there were 59 victims of homicide (11 homicides per million population) in Scotland in the year ending March 2015, one fewer than the 60 victims (also 11 per million) in the previous year. This was the lowest number of homicides since 1976, the first year for which comparable data are available.
The Police Service of Northern Ireland publish monthly figures on homicides, and the financial year trends release shows that there were 24 homicide offences recorded by the police in Northern Ireland in the year ending March 2015, continuing a general downward trend.
The United Nations Office on Drugs and Crime (UNODC) publish a Global Homicide Handbook which gives a comprehensive overview of intentional homicide across the world. The most recent of these was published in 2014, and showed that the global average homicide rate stands at 62 per million population, but Southern Africa and Central America had rates over 4 times higher than that (above 240 victims per million population). Meanwhile, with rates some 5 times lower than the global average, Eastern Asia, Southern Europe and Western Europe were the sub-regions with the lowest homicide levels.
Back to table of contents17. Statistical interpretation of trends in homicide
The number of homicides recorded by the police fluctuates from year to year and there is interest in knowing the extent to which these fluctuations in the level of homicides represent an indication of a real underlying trend as opposed to random year-to-year variation. Using data for London between April 2004 and March 2007, London murders: a predictable pattern? found that homicides in London have a predictable level of fluctuation over time, which allowed them to apply statistical techniques for analysis.
It should be noted that the discussion in this section is related to the statistical properties of the data, and it should not be interpreted as saying that small changes in the numbers of homicides are not of concern.
This section presents analyses of homicide incidents, defined as incidents where the same person (or a group of persons) is suspected of committing one or more related homicides. The numbers therefore differ from the total number of recorded homicides presented above (the focus of analysis is on such incidents as it is not possible to statistically model multiple homicides that relate to one case and were recorded on the same day; for that reason the homicides attributed to Dr Harold Shipman and the 7 July London bombings are, for example, each treated in this analysis as one incident). Although each incident is highly related to socio-economic characteristics of the suspect and the victim and independent from other incidents, over a period of time, the probabilities of homicide incidents happening can be closely modelled by a Poisson distribution . This can be used to test whether any change in the numbers of incidents per year is statistically significant, or what can be termed within the range of expected ‘natural variation’ of the data.
Expected homicide incidents per day
Between April 2012 and March 2015, the police recorded 1,521 independent homicide incidents in England and Wales. The observed number of homicide incidents on a daily basis closely matches the expected number under the Poisson distribution1 (Figure 2.10). For example, from knowing there was an average of 1.39 incidents a day, we would predict over the time period of 1,095 days that there would be 122 days on which there would be exactly 3 independent incidents. This is close to the observed number of 127 days, indicating that the occurrence of these apparent ‘clusters’ is not as surprising as one might anticipate. A statistical test (χ²) shows no significant difference between the expected and observed figures. Thus, the observed figures are in fact Poisson distributed. This allows for calculation of the number of days on which it would be expected that no incidents or one incident occurs and so on.
Figure 2.10: Observed and expected number of homicide incidents recorded on a day, combined data years ending March 2013 to March 2015
England and Wales
Source: Homicide Index, Home Office
Notes:
- Homicide Index data are not designated as National Statistics.
- As of 13 November 2015.
Download this chart Figure 2.10: Observed and expected number of homicide incidents recorded on a day, combined data years ending March 2013 to March 2015
Image .csv .xlsTrend analysis
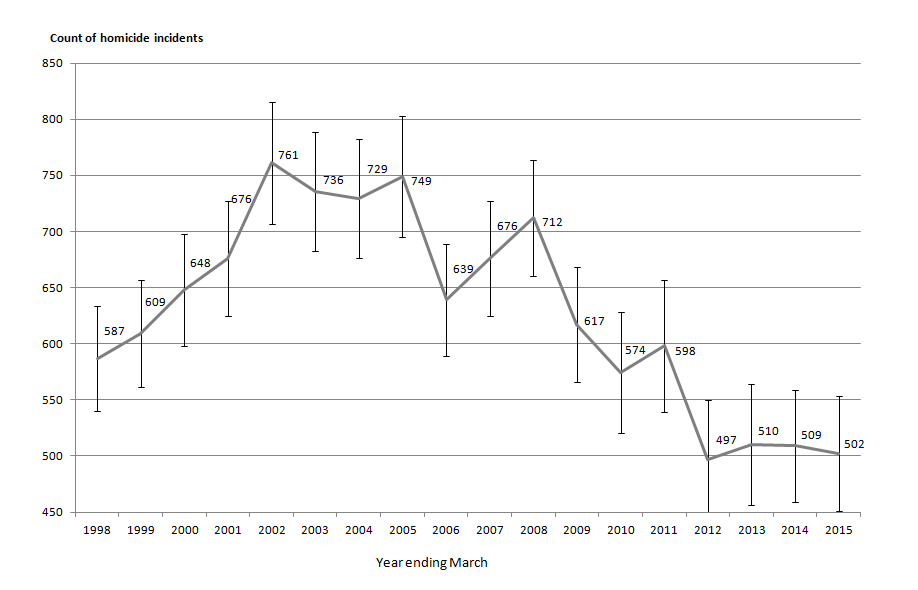
Furthermore, knowing that homicide incidents are statistically distributed allows the application of statistical techniques in order to assess longer-term trends. Figure 2.11 shows the number of homicide incidents since the year ending March 1998. For each year, the observed count is given along with a 95% confidence interval on the Poisson error. The interval represents the range of values one would expect to measure 95% of the time if the underlying risk of homicide remained unchanged. These confidence intervals can be used as a rough approximation to determine whether the number of homicide incidents in any 2 years are statistically different from one another. If the confidence intervals do not overlap, one can infer there has been a significant change in the underlying risk of homicide. However, it is possible for the confidence intervals to overlap and for there still to be a statistically significant change in the number of homicide incidents. In order to measure the significance more accurately, it is appropriate to use a statistical test.
As has been shown previously, the Poisson distribution can be applied to the number of homicide incidents per year and the number of these incidents is large enough to approximate the normal distribution. Therefore a statistical test (in this case a Z-test) can be used to determine if the counts in each year are statistically significantly different from one another at the 95%confidence level (that is, whether there has been a true change in the underlying risk).
Based on this statistical test, one can assess that the number of homicide incidents recorded in the year ending March 2015 was statistically significantly lower at the 95% level than the number recorded in every year shown in Figure 2.11 up to year ending 2009 and has remained stable since year ending March 2012. This means the risk of becoming a victim of homicide was, in fact, lower for the year ending March 2015 compared with those earlier years.
Figure 2.11: Homicide incident trend analysis, year ending March 1998 to year ending March 2015
England and Wales
Source: Homicide Index, Home Office
Notes:
- Homicide Index data are not designated as National Statistics
- As of 13 November 2015
Download this image Figure 2.11: Homicide incident trend analysis, year ending March 1998 to year ending March 2015
.png (21.6 kB) .xls (38.4 kB)
Many of the short-term fluctuations seen from year to year in the number of homicide incidents are not statistically significant and appear to arise as natural statistical variation in the data. In looking at homicide data the degree of natural variation needs to be considered in interpreting trends and also when looking at year-to-year changes.
Notes for statistical interpretation of trends in homicide
- The Poisson distribution expresses the probability of the number of events occurring in a given period of time if these events occur with a known average rate and independently from each other.