


1. Summary
This chapter presents findings from the 2012/13 and 2013/14 Crime Survey of England and Wales (CSEW) on violent incidents where alcohol has been a factor. Additional analysis is also provided from the Home Office Data Hub, a record level dataset of police recorded offences.
Victims perceived the offender(s) to be under the influence of alcohol in 53% of violent incidents measured by the 2013/14 CSEW. This is equivalent to an estimated 704,000 ‘alcohol-related’ violent incidents. While the volume of incidents has fallen, the proportion of violent incidents that were ‘alcohol-related’ has remained relatively steady over the last ten years
Alcohol was a particularly prevalent factor in violent incidents between strangers, 64% of which were perceived to be alcohol-related (CSEW 2013/14)
In the combined datasets of the 2012/13 and 2013/14 CSEW, 70% of violent incidents occurring at the weekend, and 70% of violent incidents occurring in the evening or night, were alcohol-related
The proportions of violent incidents that were alcohol-related increased as the afternoon and evening progressed, from 23% of violent incidents occurring between noon and 6pm, to 52% were between 6pm and 10pm and 83% occurred between 10pm and midnight
70% of violent incidents which took place in a public space were alcohol-related compared with 40% of incidents that occurred in the home and 43% of incidents that happened in and around the workplace
Where injuries were sustained these were typically more severe in incidents of alcohol-related violence compared with other violent incidents. Victims in alcohol-related violent incidents were more likely to have received cuts (15%, compared with 9% of victims in non alcohol-related incidents) or to have suffered concussion or loss of consciousness (5%, compared with 1% of victims in non alcohol-related incidents) as a result of the incident
2. Introduction
This chapter looks at the extent, nature of, and trends in, alcohol-related violent incidents experienced by adults aged 16 years and older resident in households in England and Wales. It presents data on the extent of alcohol-related violence from the 2013/14 Crime Survey of England and Wales (CSEW) and also includes more detailed analysis of the nature of this type of violent incident based on combined data from the 2012/13 and 2013/14 surveys. Combining data from two survey years increases the number of incidents available for analysis of the more detailed breakdowns of the data.
Further information on the involvement of alcohol as a factor in violent incidents is provided from the Home Office Data Hub, a record level dataset of police recorded offences which contains more detailed information on crimes than the main police recorded crime data collection. As there is no specific offence of alcohol-related violence defined in law the aggregate police recorded crime data collection does not separately identify this type of crime. However, the Data Hub contains a field where police forces can identify a given set of aggravating factors related to an offence and one of these factors is whether the offence was ‘alcohol-related’. It is not mandatory for forces to populate this field and not all forces are presently supplying crime data to the Home Office via the Data Hub. Analysis using these data is therefore limited to 21 of the 43 territorial police forces of England and Wales, and is subject to continuing quality assurance. These forces account for over half (61%)1 of the violence against the person offences in England and Wales and include data from the Metropolitan Police, who alone record around a fifth of offences in England and Wales.
This analysis of the Data Hub was restricted to offences recorded in the category of violence against the person. There are some further offences recorded by the police as public order offences that can involve an element of violence, though not directed at an individual victim. Public order offences cover circumstances where an offender is behaving in a way that causes, or would be likely to cause, alarm, distress or disorder and may include some offences where injury is threatened. Similar analysis of the Data Hub shows that 21% of recorded public order offences were flagged as alcohol-related. These offences are excluded from the analysis presented in this chapter.
There have been long-running concerns about the relationship between alcohol and crime. Past studies2 show that high proportions of offenders have consumed alcohol before committing an offence, with proportions higher in violent offences compared with acquisitive offences. It is likely that the link between alcohol and violence is complex, as although large proportions of offenders report drinking prior to offending, and victims often perceive offender(s) to be under the influence of alcohol, most people who consume alcohol do not go on to commit crime. Many explanations for this link have been suggested, often focusing on the pharmacological effects of alcohol, the psychology of the individual offender, the situations alcohol is consumed in, and the social acceptability of certain behaviours when intoxicated (see for example, Dingwall, 2006. and Hughes et al., 2010, for an overview).
Defining alcohol-related violence
In this chapter, CSEW ‘alcohol-related’ violent incidents3 are defined as those violent incidents where the victim perceived the offender(s) to be under the influence of alcohol at the time of the incident. ‘Non alcohol-related violent incidents’ refer to those incidents where the victim perceived the offender(s) not to be under the influence of alcohol. The CSEW also collects information on the location of the incident, which can include locations in or around licensed premises, and on whether the victim was under the influence of alcohol at the time of the incident. Statistics on both of these measures are also presented.
At present, there is no definition of alcohol-related violence within the National Crime Recording Standard (NCRS) or Home Office Counting Rules (HOCR), although there is guidance within the National Standard for Incident Recording (NSIR). This guidance states this flag should be used to: “capture the characteristics and motivating factors around an incident where the consumption and effects of alcohol are more than merely incidental... where the consumption of alcohol has affected someone’s behaviour and been a major contribution to the activities leading up to the incident”4.
However, this guidance is not directly linked to the NCRS or HOCR so it is possible that police forces have applied their own interpretation of what is meant by alcohol-related in their returns to the Home Office. Furthermore, as the aggravating factors field is not mandatory, it is possible that it is being used for some offences within a force, but not all. As a result, these data are only able to provide a partial and provisional picture but they do provide useful support to the CSEW findings.
Notes for introduction
Based upon Table P1 in Crime in England and Wales, Year ending March 2014.
See, for example, Boreham, et al., 2007 and Matthews and Richardson, 2005.
Incidents of violence include wounding, assault with minor injury, and assault without injury. For more information see Chapter 5.1 of the User Guide to Crime Statistics for England and Wales.
Page 30, NSIR, 2011.
3. Prevalence of alcohol-related violence
The 2013/14 CSEW estimates that there were 1.3 million incidents of violence against adults in England and Wales1. Victims perceived the offender(s) to be under the influence of alcohol in 53% of these, equivalent to an estimated 704,000 violent incidents. Victims perceived the offender(s) not to be under the influence of alcohol in 38% of incidents, and in the remaining 9% of incidents the victim did not know2 ( Nature of Crime Table 3.10 (384 Kb Excel sheet) ). As well as their perceptions of the offender(s), victims reported that they (the victim) were under the influence of alcohol in a fifth (20%) of violent incidents, and that 19% of violent incidents were located in or around a pub or club ( Appendix Table 5.01 (1.42 Mb Excel sheet) and Figure 5.1):
Figure 5.1: Proportion of violent incidents where alcohol was likely to be a factor, by question, 2013/14 CSEW
Source: Office for National Statistics, Crime Survey for England and Wales
Download this chart Figure 5.1: Proportion of violent incidents where alcohol was likely to be a factor, by question, 2013/14 CSEW
Image .csv .xlsNotes for prevalence of alcohol-related violence
Incidents of violence include wounding, assault with minor injury, and assault without injury. For more information see Chapter 5.1 of the User Guide to Crime Statistics for England and Wales.
This question is asked to victims able to say something about the offender(s). Victims were able to say something about the offender(s) in 99% of all violent incidents. Question is not asked where the offender(s) were perceived to be children less than 10 years old.
4. Trends in CSEW alcohol-related violence
Consistent with trends in overall violent crime, there have been falls in the number of alcohol-related violent incidents. Between the 2004/05 and 2013/14 surveys, both overall CSEW violent incidents and those where the offender(s) was perceived to be under the influence of alcohol fell by 34% (overall CSEW violence from 2 million incidents to 1.3 million; alcohol-related incidents from 1.1 million to 0.7 million) (Figure 5.2).
Figure 5.2: Number of overall violent incidents and those where the victim believed the offender(s) to be under the influence of alcohol, 2004/05 to 2013/14 CSEW
Source: Office for National Statistics, Crime Survey for England and Wales
Download this chart Figure 5.2: Number of overall violent incidents and those where the victim believed the offender(s) to be under the influence of alcohol, 2004/05 to 2013/14 CSEW
Image .csv .xlsThe proportion of violent incidents where the victim perceived the offender(s) to be under the influence of alcohol has remained relatively steady over the last ten years (the time period over which comparable data are available). For example, the proportion of offender(s) perceived to be under the influence of alcohol was 53% in both the 2004/05 and 2013/14 CSEW (Figure 5.3). Data from earlier survey years (not comparable with 2004/05 to 2013/14) suggest that this trend has also remained steady in the longer term under the wider categorisation of violent incidents1.
Figure 5.3: Proportion of violent incidents where the victim believed the offender(s) to be under the influence of alcohol, 2004/05 to 2013/14 CSEW
Source: Office for National Statistics, Crime Survey for England and Wales
Download this chart Figure 5.3: Proportion of violent incidents where the victim believed the offender(s) to be under the influence of alcohol, 2004/05 to 2013/14 CSEW
Image .csv .xlsThe Home Office Data Hub provides information on the proportion of police recorded offences that were identified as being alcohol related. This collection remains under development and data for 21 forces in 2013/14 shows that 22% of violence against the person offences were flagged as alcohol-related, a lower proportion than shown in the CSEW. There are a number of possible reasons for the difference in the proportions from the two sources:
The CSEW estimate is based on the victims’ perception whether the offender was under the influence of alcohol; the police are likely to take a more evidence-based approach to whether an offence was alcohol related.
The alcohol flag is not part of the mandatory return that police forces send to the Home Office, therefore the flag might not be being applied consistently across all forces and offences types.
The mix of crimes between the CSEW and police recorded violence differ. For example, around 10% of police recorded violence against the person is harassment offences, which are not well covered by the CSEW. Harassment offences are less likely to be alcohol-related than other violent offences (Figure 5.6). Conversely, lower-level violence (including, for example, scuffles in or outside pubs) is likely to be better covered by the CSEW than police recorded crime, as much of this violence will not come to the attention of the police and therefore will not be recorded as crimes.
Notes for trends in CSEW alcohol-related violence
- Data from 1995-2012/13 is available from Crime Statistics, Focus on Violent Crime and Sexual Offences, 2012/13 (Nature of Crime table 3.11). Violent incidents in these data include assault with injury, assault without injury, and robbery.
5. Type of violence
In the 2013/14 CSEW, the victim perceived the offender(s) to be under the influence of alcohol in 53% of wounding, 57% of assault with minor injury and 51% of violence without injury incidents ( Nature of Crime Table 3.10 (384 Kb Excel sheet) ).
There were differences in the proportion of incidents that were alcohol-related according to the relationship between offender and victim. Alcohol was a particularly prevalent factor in violent incidents between strangers, 64% of which were alcohol-related, compared with 52% of acquaintance and 36% of domestic violence incidents (Figure 5.4)1:
Figure 5.4: Proportion of violent incidents where the victim believed the offender(s) to be under the influence of alcohol, offence and violence type, 2013/14 CSEW

Source: Office for National Statistics, Crime Survey for England and Wales
Download this image Figure 5.4: Proportion of violent incidents where the victim believed the offender(s) to be under the influence of alcohol, offence and violence type, 2013/14 CSEW
.png (18.2 kB) .xls (35.8 kB)
The Home Office Data Hub provides information on the proportion of police recorded offences that were alcohol related by type of offence. Data for 2013/14 shows the offence of assault without injury on a constable had the highest proportion of offences that were alcohol-related (43% of offences). The proportion of other offences which were alcohol-related is shown in Figure 5.5. It is important to note that assault without injury on a constable only account for 2% of police recorded violence against the person in 2013/14 and these figures refer to proportions of offences, rather than actual level of offences.
Figure 5.5: Proportion of violence against the person offences recorded by the police which were ‘alcohol-related’, by offence type, 21 forces, 2013/14, Home Office Data Hub
Source: Home Office, Police Recorded Crime
Notes:
- Police recorded crime data are not designated as National Statistics
Download this chart Figure 5.5: Proportion of violence against the person offences recorded by the police which were ‘alcohol-related’, by offence type, 21 forces, 2013/14, Home Office Data Hub
Image .csv .xlsNotes for Type of violence
- The domestic violence figures presented here are taken from the main face-to-face survey. It is known that this crime type is particularly liable to under-reporting in face-to-face interviews. Information on partner abuse from the self-completion module in the CSEW also indicates that the offender was under the influence in a lower proportion of partner abuse incidents than in stranger violence (Crime Statistics, Focus on Violent Crime and Sexual Offences, 2012/13, Appendix Table 4.15).
6. Nature of alcohol-related violence
This section provides a more detailed examination of alcohol-related violent incidents from the CSEW, and includes further police recorded crime data from the Home Office Data Hub on the timing of offences identified as alcohol-related. Data from two CSEW survey years (2012/13 and 2013/141) have been combined to give larger sample sizes, increasing the number of incidents available for analysis, allowing more detailed breakdowns of the data. Figures reported in this section are 12-month averages of the estimates from the two survey years and so are comparable with 12-month CSEW estimates presented elsewhere in this and other crime statistics bulletins.
Timing
As expected CSEW data confirm that violent incidents were more often alcohol-related in the evening or night compared with the daytime, and during the weekend compared with weekdays (Appendix Table 5.02 (1.42 Mb Excel sheet)). The victim perceived the offender(s) to be under the influence of alcohol in 70% of all violent incidents that occurred at the weekend (from Friday 6pm to Monday 6am) (compared with 35% of incidents occurring during the week), and 70% of all violent incidents occurring in the evening or night (from 6pm to 6am) (compared with 20% occurring in the day). The proportions of violent incidents that were alcohol-related increased as the afternoon and evening progressed, from 23% of violent incidents occurring between noon and 6pm, to 52% of violent incidents occurring between 6pm and 10pm and 83% of violent incidents occurring between 10pm and midnight. A similarly large proportion (84%) of incidents occurring between midnight and 6am were alcohol-related (Figure 5.6):
Figure 5.6: Timing of violent incidents, according to whether victim perceived offender(s) to be under the influence of alcohol, combined data for 2012/13 and 2013/14 CSEW

Source: Office for National Statistics, Crime Survey for England and Wales
Download this image Figure 5.6: Timing of violent incidents, according to whether victim perceived offender(s) to be under the influence of alcohol, combined data for 2012/13 and 2013/14 CSEW
.png (23.4 kB) .xls (40.4 kB)
Information from Home Office Data Hub enables more detailed analysis of the timing of an offence recorded by the police, as each record includes a time stamp. These data show a similar picture to findings from the CSEW, with more alcohol-related offences taking place in the evening than during the day, especially on Friday and Saturday evenings. Figure 5.7 shows the proportion of offences taking place by day of the week and hour of the day in 2013/14. For this analysis, data from a number of forces were excluded from the 21 where an ‘alcohol-related’ flag was available as they did not include accurate time-stamped data. However, the Metropolitan police, the largest force in terms of population and number of crimes recorded, are included.
Figure 5.7: Number of offences recorded by the police that were identified as ‘alcohol-related’, by day and time of offence, 13 police forces in England and Wales, 2013/14, Home Office Data Hub.

Source: Home Office, Police Recorded Crime
Notes:
- Police recorded crime data are not designated as National Statistics
Download this image Figure 5.7: Number of offences recorded by the police that were identified as ‘alcohol-related’, by day and time of offence, 13 police forces in England and Wales, 2013/14, Home Office Data Hub.
.png (29.8 kB) .xls (45.6 kB)
Location
As detailed in the prevalence section of this report, 19% of all 2013/14 CSEW violent incidents occurred in or around a pub or club ( Nature of Crime Table 3.2 (384 Kb Excel sheet) ). In the combined 2012/13 and 2013/14 CSEW datasets, 93% of violent incidents occurring in or around a pub or club location were alcohol-related, as were 51% of incidents occurring in the street. These data show that the majority (70%) of ‘public space’2 violent incidents were alcohol-related ( Appendix Table 5.03 (1.42 Mb Excel sheet) ). The proportions of incidents occurring in locations in and around work, around the home and in other locations that were alcohol-related are shown in Figure 5.8.
Figure 5.8: Location of violent incidents, according to whether victim perceived offender(s) to be under the influence of alcohol, combined data for 2012/13 and 2013/14 CSEW

Source: Office for National Statistics, Crime Survey for England and Wales
Download this image Figure 5.8: Location of violent incidents, according to whether victim perceived offender(s) to be under the influence of alcohol, combined data for 2012/13 and 2013/14 CSEW
.png (17.5 kB) .xls (38.9 kB)
The locations in which violent incidents occur often reflect the nature of the incidents themselves, particularly the relationship between victim and offender. Violence between strangers, where 64% of violent incidents in the 2013/14 CSEW were alcohol-related, are more likely to occur in public spaces where strangers are most likely to meet. In contrast, domestic violence3, where a smaller proportion of incidents were alcohol-related (36% in the 2013/14 CSEW), will predominantly occur around the home (see Nature of Crime Table 3.10 (384 Kb Excel sheet)).
The alcohol-related violent incidents that occurred in or around a ‘pub or club’ can be broken down further. Just over half of these incidents occurred within a licensed premise (30% ‘inside a nightclub’, 25% inside a ‘pub, bar or working men’s club’), while the remaining incidents occurred in locations outside but near the premises (Figure 5.9).
Figure 5.9: Specific location of violent incidents occurring in or around a ‘pub or club’, where victim perceived offender(s) to be under the influence of alcohol, combined data for 2012/13 and 2013/14 CSEW
Source: Office for National Statistics, Crime Survey for England and Wales
Download this chart Figure 5.9: Specific location of violent incidents occurring in or around a ‘pub or club’, where victim perceived offender(s) to be under the influence of alcohol, combined data for 2012/13 and 2013/14 CSEW
Image .csv .xlsCharacteristics of victims
The proportion of adult victims who perceived the offender(s) to be under the influence of alcohol at the time of a violent incident varied by personal and household characteristics. Many of these characteristics are closely associated, so caution is needed in their interpretation when viewed in isolation. Separate analysis on the characteristics associated with being a victim of any violent crime is available in the overview chapter of this publication.
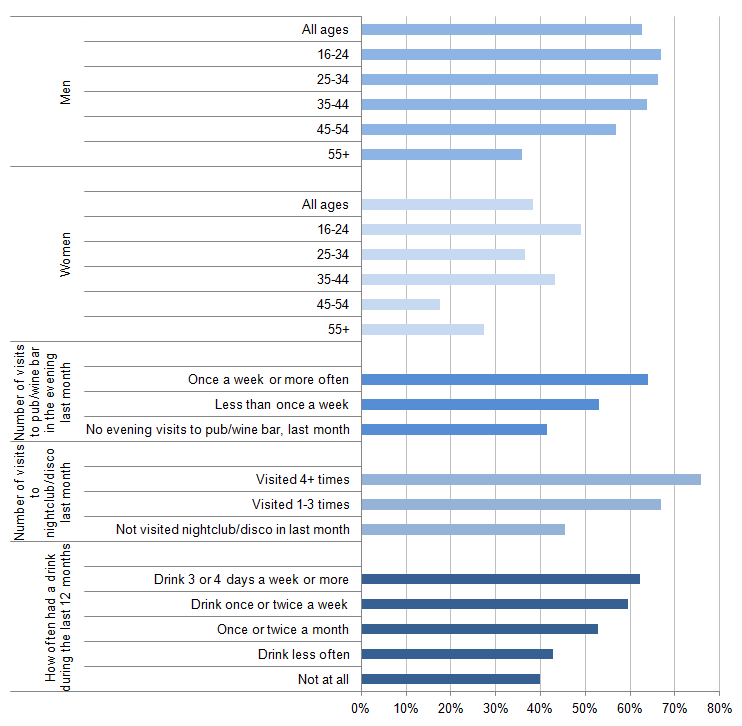
Violent incidents were more often alcohol-related in incidents involving male victims, where 62% of incidents were alcohol related, than those involving female victims, where 38% of incidents were alcohol-related. While it is not possible to infer a causal relationship between alcohol consumption, leisure and lifestyle choices, and being a victim of alcohol-related violence, those who drank alcohol or visited pubs and bars regularly were more likely to be victims. For example, violent incidents were alcohol-related in 62% of incidents involving victims who estimated that they drank alcohol three-four days a week or more in the previous year4; 64% of incidents where the victim made evening visits to a pub or wine bar once a week or more in the last month; and 76% of incidents involving victims who visited a nightclub four times or more in the last month ( Appendix table 5.04 (1.42 Mb Excel sheet) and Figure 5.10).
Figure 5.10: Proportion of violent incidents where victim perceived offender(s) to be under the influence of alcohol, by victim characteristics, combined data for 2012/13 and 2013/14 CSEW
Source: Office for National Statistics, Crime Survey for England and Wales
Download this image Figure 5.10: Proportion of violent incidents where victim perceived offender(s) to be under the influence of alcohol, by victim characteristics, combined data for 2012/13 and 2013/14 CSEW
.png (31.0 kB) .xls (38.9 kB)
Characteristics of offenders
The CSEW is a victim-based survey, and as such information on the characteristics of offender(s) is limited to the perceptions of the victim. However, the data available suggests that offenders in alcohol-related violent incidents share a similar age and gender profile to victims in these incidents. In the combined 2012/13 and 2013/14 surveys, the offender(s) were male in 80% of alcohol-related violent incidents, female in 12%, and from a mixed gender group of offenders in 8% of incidents. Offender(s) were aged between 16 and 24 in 51%, 25 and 39 in 42%, and 40 or older in 15% of alcohol-related violent incidents5.
A third (33%) of alcohol-related violent incidents involved more than one offender, a larger proportion than that for non alcohol-related violent incidents (19%). Offenders in alcohol-related violent incidents were also less likely to be known well by the victim (30% of incidents) than offenders in non alcohol-related violent incidents (56% of incidents), supporting findings earlier in this chapter on the relationship between victims and offenders ( Appendix Table 5.05 (1.42 Mb Excel sheet) and Figure 5.11):
Figure 5.11: Offender characteristics in violent incidents, according to whether victim perceived offender(s) to be under the influence of alcohol, combined data for 2012/13 and 2013/14 CSEW

Source: Office for National Statistics, Crime Survey for England and Wales
Download this image Figure 5.11: Offender characteristics in violent incidents, according to whether victim perceived offender(s) to be under the influence of alcohol, combined data for 2012/13 and 2013/14 CSEW
.png (15.2 kB) .xls (40.4 kB)
Use of weapons
Weapons were used in similar proportions of violent incidents that were alcohol-related (17%) and non alcohol-related (20%) according to the combined 2012/13 and 2013/14 CSEW data, though there were some differences in the types of weapons used. This was particularly the case for the use of bottles and glassware, which were used more often in alcohol-related incidents (5%), than in non-alcohol-related incidents (1%). This is likely to be due to the proximity of these objects as potential weapons in environments where alcohol is consumed ( Appendix Table 5.06 (1.42 Mb Excel sheet) ).
Consequences of violence
The proportion of victims in violent incidents who either sustained physical injury or received medical attention were similar regardless of whether the incident was alcohol-related, however, victims in alcohol-related incidents tended to experience more severe injuries. For example, victims in alcohol-related violent incidents were more likely to have received cuts (15%, compared with 9% of victims in non alcohol-related incidents) or to have suffered concussion or loss of consciousness (5%, compared with 1% of victims in non alcohol-related incidents) (Appendix Table 5.07 (1.42 Mb Excel sheet)). Similar proportions of alcohol-related (47%) and non-alcohol-related (45%) violent incidents came to the attention of the police (Appendix Table 5.08 (1.42 Mb Excel sheet)).
Perceived seriousness and emotional reactions
The CSEW asks victims how serious, on a scale of 1 to 20; they perceived the incident (with ‘1’ being a very minor crime, to ‘20’ being the most serious crime). The mean score given for alcohol-related violent incidents was 6.7, significantly lower than non alcohol-related violent incidents, where the mean score was 7.3 (Appendix Table 5.09 (1.42 Mb Excel sheet)).
The emotional reactions experienced by victims also differed. Whilst large proportions of victims in both alcohol-related (78%) and non-alcohol-related (81%) violent incidents reported having experienced an emotional reaction, the severity of the reactions differed. Victims in alcohol-related violent incidents were less likely to have been emotionally affected ‘very much’ overall (in 19% of alcohol-related violent incidents) than victims in non-alcohol-related violent incidents (29%; Figure 5.12).
Figure 5.12: Emotional impact of violent incidents, according to whether victim perceived offender(s) to be under the influence of alcohol, combined data for 2012/13 and 2013/14 CSEW
Source: Office for National Statistics, Crime Survey for England and Wales
Download this chart Figure 5.12: Emotional impact of violent incidents, according to whether victim perceived offender(s) to be under the influence of alcohol, combined data for 2012/13 and 2013/14 CSEW
Image .csv .xlsThere were also differences in the types of emotional reactions experienced. Victims in alcohol-related violent incidents were less likely to have experienced emotions including shock and fear, as well anxiety or panic attacks, difficulty sleeping and depression (Appendix Table 5.10 (1.42 Mb Excel sheet) and Table 5.1 below):
Table 5.1: Type of emotional impact in violent incidents, according to whether victim perceived offender(s) to be under the influence of alcohol, combined data for 2012/13 and 2013/14 CSEW
| England and Wales | |||
| Personal incidents, percentages | |||
| Type of emotional response experienced3 | Violent incidents2 | ||
| Alcohol-related | Not alcohol-related | Statistically significant difference | |
| Anger | 41 | 43 | |
| Annoyance | 40 | 35 | |
| Shock | 36 | 46 | * |
| Fear | 23 | 31 | * |
| Loss of confidence or feeling vulnerable | 19 | 32 | * |
| Crying/tears | 17 | 27 | * |
| Anxiety or panic attacks | 14 | 19 | * |
| Difficulty sleeping | 14 | 20 | * |
| Depression | 9 | 18 | * |
| Other | 3 | 3 | |
| Unweighted base | 697 | 557 | |
| Source: Crime Survey for England and Wales, Office for National Statistics | |||
| Notes: | |||
| 1. This question is asked to victims able to say something about the offender(s). Victims were able to say something about the offender(s) in 99% of all violent incidents. Question is not asked where the offender(s) were perceived to be children aged less than 10 years | |||
| 2. Violent incidents comprise wounding, assault with minor injury and assault without injury. See Section 5.1 of the User Guide for more information | |||
| 3. Figures add to more than 100 as more than one response was possible | |||
Download this table Table 5.1: Type of emotional impact in violent incidents, according to whether victim perceived offender(s) to be under the influence of alcohol, combined data for 2012/13 and 2013/14 CSEW
.xls (30.2 kB)Notes for nature of alcohol-related violence
Incident counts are based on the full CSEW recall period from 12 months prior to the month of interview. The results therefore are from interviews conducted between April 2012 and March 2014, and refer to incidents between March 2011 and February 2014.
Includes incidents located in or around a pub or club, in the street, or on or around public transport.
The domestic violence figures presented here are taken from the main face-to-face survey. It is known that this crime type is particularly liable to under-reporting in face-to-face interviews. Detailed information on domestic abuse from a self-completion module in the CSEW can be found in chapter 4.
This question is asked of victims aged between 16-59 years.
The totals for each age group do not add to 100% as there may be more than one offender.