Table of contents
- Summary
- Introduction
- Prevalence of intimate violence – extent
- Prevalence of intimate violence – trends
- Intimate violence in the last year by personal characteristics
- Intimate violence by relationship to offender
- Nature of serious sexual assault
- Influence of alcohol and drugs
- Reporting of serious sexual assault
- Effects of serious sexual assault
- Attitudes to sexual violence
- References
- Background notes
1. Summary
This chapter presents findings from the 2013/14 Crime Survey for England and Wales (CSEW) self-completion module on intimate violence which is asked of adults aged 16 to 59. The module covers experience of emotional, financial and physical abuse by partners or family members, as well as sexual assaults and stalking by any person. In 2013/14, the module focused on the nature of serious sexual assault, findings from which are presented here.
There were 8.5% of women and 4.5% of men who reported having experienced any type of domestic abuse in the last year (that is, partner / ex-partner abuse (non-sexual), family abuse (non-sexual) and sexual assault or stalking carried out by a current or former partner or other family member). This is equivalent to an estimated 1.4 million female victims and 700,000 male victims
There were 6.8% of women and 3.0% of men who reported having experienced any type of partner abuse in the last year, equivalent to an estimated 1.1 million female victims and 500,000 male victims
Overall, 28.3% of women and 14.7% of men had experienced any domestic abuse since the age of 16, equivalent to an estimated 4.6 million female victims and 2.4 million male victims
The decline in domestic abuse for all victims between the 2004/05 and 2008/09 CSEW surveys was statistically significant. However, the current figure (6.5% for both men and women combined) continues a fairly stable trend seen since 2008/09
Women were more likely than men to have experienced intimate violence across all headline types of abuse asked about, for example, 2.2% of women and 0.7% of men having experienced some form of sexual assault (including attempts) in the last year
2. Introduction
This chapter includes headline findings from the 2013/14 self-completion module of the Crime Survey for England and Wales (CSEW) on the extent of, and trends in, intimate violence among men and women aged 16 to 59 resident in households in England and Wales. Intimate violence is a collective term used here to refer to a number of different forms of physical and non-physical abuse consisting of partner abuse, family abuse, sexual assault and stalking. The term reflects the intimate nature either of the victim-offender relationship or of the abuse itself.
A self-completion module on intimate violence was included in the CSEW in 2001 and then on a continuous basis since 2004/051. The use of self-completion on laptops allows respondents to feel more at ease when answering questions on sensitive issues due to increased confidence in the privacy and confidentiality of the survey. The self-completion module is restricted to respondents age 16 to 59 given the requirement to confidently use the interviewer’s laptop. This will be reviewed in the near future.
In the 2010/11 CSEW, a split sample experiment was started to test a set of alternative questions on intimate violence. This was prompted by the extension of the survey to cover 10 to 15 year olds in 2009 where anecdotal feedback from interviewers suggested that the explicit language of the IPV questions, and that they are asked just before the interviewer seeks parental permission to carry out the child survey, may have led to a higher than anticipated parental refusal rate. The split sample experiment considered the use of explicit language in the questions and the ease of answering the questions as a respondent.
After some further development for the 2012/13 survey, the new questions were incorporated for the whole sample for the 2013/14 CSEW. More information on the development of the new questions can be found in the accompanying methodological note. The change to the new question set has caused a break in the intimate personal violence time series. An adjustment has been applied to the back series to make it comparable with the estimates calculated from the new questions. For more information see the section on ‘Prevalence of intimate personal violence – trends’.
Definitions of abuse in the intimate violence self-completion module
Intimate violence is the collective term used to describe domestic abuse, sexual assault and stalking. Categories used in the presentation of these statistics are defined as follows:
Domestic abuse: this category combines partner abuse (non-sexual), family abuse (non-sexual) and sexual assault or stalking carried out by a current or former partner or other family member. This broadly matches the Government’s definition of domestic violence and abuse2.
Non-sexual abuse by a partner: physical force, emotional or financial abuse or threats to hurt the respondent or someone close to them carried out by a current or former partner.
Non-sexual abuse by a family member: physical force, emotional or financial abuse or threats to hurt the respondent or someone close to them carried out by a family member other than a partner (father/mother, step-father/mother or other relative).
Sexual assault: rape or assault by penetration including attempts (‘serious’), indecent exposure or unwanted touching (‘less serious’) carried out by any person.
Stalking: two or more incidents (causing distress, fear or alarm) of receiving obscene or threatening unwanted letters, e-mails, text messages or phone calls, having had obscene or threatening information about them placed on the internet, waiting or loitering around home or workplace, or following or watching by any person, including a partner or family member3.
In December 2014, the Home Secretary announced the Government’s intention to create a new criminal offence of domestic abuse of “coercive and controlling behaviour”4. The new law will capture coercive control through psychological and emotional abuse that stops short of physical violence. The CSEW has collected information of such non-physical abuse since the 2004/05 survey by asking if the respondent has experienced the following behaviours by a partner / ex-partner or family member:
Prevented you from having your fair share of the household money
Stopped you from seeing friends and relatives
Repeatedly belittled you to the extent that you felt worthless.
This category of non-physical abuse (emotional, financial), is presented within the category of non-sexual abuse by a partner or family member categories.
There are two headline measures of intimate violence in the CSEW: one relates to experiences since the age of 16 and the other is limited to those experiences in the last 12 months. As well as questions on experience of intimate violence, the CSEW self-completion module also includes a set of questions asking victims for further details about the nature of the incidents they experienced. These questions currently focus on partner abuse or sexual assault in alternate survey years. The questions in the 2013/14 CSEW focused on the nature of sexual assault and as a result this bulletin also includes analyses of these questions, including information about the context of victimisation and whether incidents came to the attention of the police and others.
Reporting
The under-reporting of crime to the police is known to be particularly acute for intimate violence offences, although there is evidence to suggest that there has been an increase in recording and reporting of these offences (see ‘Police recorded domestic abuse incidents‘). One of the strengths of the CSEW is that it covers many crimes that are not reported to the police. Estimates of the prevalence of domestic violence (a narrower definition than domestic abuse, which excludes non-physical abuse and threats) based on face-to-face CSEW interviews are regularly published5. However, this crime type is particularly liable to under-reporting due to the unwillingness of some victims to disclose such incidents in the context of a face-to-face interview (which can lead to fluctuating estimates from year-to-year). For example, only a small proportion (5%) of respondents (4% of men and 5% of women in 2013/14) who reported being victims of domestic abuse in the self-completion module had reported that they were victims of domestic violence in the last 12 months in face-to-face interviews. This is likely to be due to both:
the increased reporting of sensitive issues expected on account of the greater confidentiality provided by self-completion methods; and
the broader definition of domestic abuse used in the self-completion module6.
Comparing those who reported physical domestic abuse in the self completion module with those who reported the similar category of domestic violence in the face-to-face interview provides clearer evidence that respondents are more likely to report sensitive issues in the self completion module. Of those who reported being victims of physical domestic abuse7 (aged between 16 and 59) in the self-completion module, 13% reported being a victim of domestic violence in the last 12 months in face-to-face interviews (14% for women and 10% for men).
The coverage of domestic violence in the face-to-face interview is also impacted by the cap applied to the number of incidents in a series in the crime survey. CSEW crime estimates of the number of crimes only include the first five incidents in a ‘series’ of victimisations, that is, “the same thing, done under the same circumstances and probably by the same people”. This restriction to the first five incidents in a series has been applied since the CSEW began in order to ensure that estimates are not affected by a very small number of respondents who report an extremely high number of incidents and which are highly variable between survey years. Walby et al. (2014) have included some analysis of the impact of capping the number of domestic violence incidents in a series.
Findings from the self-completion module published here provide a more complete measure of intimate violence victimisation, but as there are several differences in the coverage of the self-completion and face-to-face figures, care should be taken when making comparisons between the two. Detailed tables on the variations of intimate violence experienced by a wider range of personal, household and area characteristics are also presented.
The small number of sexual offences identified in face-to-face CSEW interviews and the likelihood of under-reporting means that figures are too unreliable to report and these data are excluded from the headline CSEW estimates.
Notes for introduction
The 2001 module differed from the one used since 2004/05 and therefore 2004/05 is used as a baseline for trends.
More details are available from the Gov.UK website.
In the new questions (from 2012/13 survey year onwards), the definition of stalking has been changed to be in line with the legal definition of two or more incidents that was introduced in April 2013.
www.gov.uk/government/news/government-to-create-new-domestic-abuse-offence
See Appendix Table A3 of quarterly crime statistics publications.
Mainly that the self completion definition of domestic abuse includes emotional or financial abuse or threats to hurt the respondent or someone close to them.
Victims of force by a partner or family member and victims of any sexual assault by a partner or family member in the last year.
3. Prevalence of intimate violence – extent
The self-completion module on intimate violence includes questions covering experiences since the respondent was 16 (treated here as a measure of adult lifetime prevalence) and in the last year (treated here as a measure of recent experience).
As in previous years, women were more likely than men to have experienced intimate violence across all the headline types of abuse asked about (Appendix table 4.01 (1.42 Mb Excel sheet)). This is in contrast to findings on overall violent crime victimisation (from the face-to-face survey) in which men, particularly young men, were more likely to have experienced violent crime1. However, it is known that in these overall violence estimates from the face-to-face survey that domestic violence is substantially under-estimated. If domestic violence was accurately captured by the face-to-face survey, it would increase the overall estimate of violent incidents, with the increase occurring more for women than for men (see Introduction).
Intimate violence experienced since the age of 16
The 2013/14 CSEW found that, overall, 28.3% of women and 14.7% of men had experienced any domestic abuse since the age of 16 ( Appendix table 4.01 (1.42 Mb Excel sheet) ; Figure 4.1). These figures were equivalent to an estimated 4.6 million female victims and 2.4 million male victims (Appendix table 4.02 (1.42 Mb Excel sheet)).
For women the most commonly experienced types of intimate violence since age 16, covered by the survey, were non-sexual partner abuse (22.0%), stalking (21.5%) and sexual assault (19.9%). For men, the most commonly experienced types of abuse were stalking (9.8%) and non-sexual partner abuse (9.6%) ( Appendix table 4.01 (1.42 Mb Excel sheet) ; Figure 4.1).
Each of the categories of abuse showed significantly higher prevalence for women compared with men. The largest difference between the sexes was shown for sexual assault, with 19.9% of women and 3.6% of men having experienced sexual assault (including attempts) since the age of 16 ( Appendix table 4.01 (1.42 Mb Excel sheet) and Figure 4.1).
Figure 4.1: Percentage of adults aged 16 to 59 who experienced intimate violence since the age of 16, by sex and headline category, 2013/14 CSEW
Source: Crime Survey for England and Wales, Office for National Statistics
Download this chart Figure 4.1: Percentage of adults aged 16 to 59 who experienced intimate violence since the age of 16, by sex and headline category, 2013/14 CSEW
Image .csv .xlsIntimate violence experienced in the last year
Respondents who had reported at least one incident of being a victim of intimate violence since they were 16 were asked whether they had been a victim in the last year. Women were more likely than men to have been a victim in the last year (8.5% compared with 4.5%), which is consistent with the difference in adult lifetime prevalence (28.3% compared with 14.7%).
The 2013/14 CSEW showed that: (Appendix tables 4.01 and 4.03; Figure 4.2):
There were 8.5% of women and 4.4% of men who reported having experienced any type of domestic abuse in the last year, equivalent to an estimated 1.4 million female victims and 700,000 male victims.
In the last year, non-sexual partner abuse and stalking were the most common of the separate types of intimate violence. Twice as many women as men reported having experienced non-sexual partner abuse (5.9% of women and 2.8% of men) and 4.4% of women and 2.5% of men reported having experienced stalking.
Out of the separate types of intimate violence categories, non-sexual family abuse had the lowest difference between the prevalence experienced by men compared with women (1.7% and 2.2% respectively). However, this was still a statistically significant difference.
In the last year, 2.2% of women and 0.7% of men had experienced some form of sexual assault (including attempts). The majority of these were less serious sexual assault, which includes indecent exposure and unwanted sexual touching.
Nearly three times as many women as men had experienced less serious sexual assault (1.8% of women compared with 0.7% of men). Less than 0.1% of men had experienced serious sexual assault (including attempts) compared with 0.7% of women. And less than 0.1% of men had experienced serious sexual assault (excluding attempts) compared with 0.4% of women.
For all headline measures, the difference between the prevalence for men compared with women was statistically significant.
Figure 4.2: Percentage of adults aged 16 to 59 who experienced intimate violence in the last year, by sex and headline category, 2013/14 CSEW
Source: Crime Survey for England and Wales
Download this chart Figure 4.2: Percentage of adults aged 16 to 59 who experienced intimate violence in the last year, by sex and headline category, 2013/14 CSEW
Image .csv .xlsFor all sub-categories of abuse experienced in the last year, estimates for women were significantly higher than estimates for men except for prevalence of force2 by a family member. This pattern is broadly similar to patterns seen in previous years. It is no longer possible to separate severe and minor force using the new questions as a single coded question is now used which gives examples of both types of force.
Police recorded domestic abuse incidents
An additional source of information on domestic abuse is available from the police. The police supply data to the Home Office on the number of domestic abuse incidents they have dealt with in their force area3. This collection is wider than police recorded crime – not all domestic abuse incidents will be recorded as crimes as defined by the Home Office Counting Rules for recorded crime. Domestic abuse incidents are defined as any incidence of threatening behaviour, violence or abuse (psychological, physical, sexual, financial or emotional) between adults, aged 16 and over, who are or have been intimate partners or family members, regardless of gender or sexuality4.
In 2013/14, the police recorded 887,253 domestic abuse incidents (Appendix table 4.08 (1.42 Mb Excel sheet) )5. Due to the often private nature of domestic abuse, the majority of domestic abuse incidents will not come to the attention of the police. These figures are therefore not directly comparable with the CSEW estimates of domestic abuse. Furthermore, CSEW estimates relate to the number of victims rather than the number of incidents.
While incidents are recorded under the National Standard for Incident Recording6 in accordance with the same ‘victim focused’ approach that applies for recorded crime, it is known that there are substantial variations between police forces in how they record domestic abuse incidents, and two forces have been unable to supply data in previous years.
The number of police recorded domestic abuse incidents has been increasing in recent years. Given that the CSEW shows the trend in domestic abuse to be flat since 2008/09, it is thought that this increase is in part due to police forces improving their recording of these incidents rather than an actual upward trend in domestic abuse.
Additionally, in March 2014, a HMIC inspection (commissioned in September 2013) expressed concerns about the police response to domestic abuse but noted the majority of Police and Crime Commissioners (PCC) were now showing a strong commitment to tackling it. It is thought that this renewed focus may have led to more victims coming forward and allegations treated more sensitively.
One of the recommendations from the HMIC inspection report7 stated that “data collected on domestic abuse needs to be consistent, comparable, accessible and accurate so that it can be used to monitor progress”. In response to this recommendation, the Home Office, from April 2015, will collect data from police forces on the number of recorded crimes that are domestic-abuse related. These data will be collected based upon the governmental definition of domestic abuse as stated above. Data on domestic abuse incidents will continue to be collected as part of this new collection.
Notes for prevalence of intimate violence – extent
Overall violent crime in the CSEW is measured as part of the face-to-face interview. For estimates of victimisation from the face-to-face interview see Appendix tables 1.01 to 1.04.
Force examples given in the survey are: they may have pushed you, slapped you, hit, punched or kicked you, choked you or used a weapon against you.
These figures are not National Statistics.
Police domestic abuse incident data follow the Government definition of domestic abuse. This definition changed in September 2012 to include those aged 16 and 17. This is different from the CSEW definition which includes respondents age 16 to 59.
Data exclude British Transport Police.
The police record domestic abuse incidents in accordance with the National Standard for Incident Recording (NSIR); for further details, see Chapter 5 of the User Guide.
See recommendation 4.
4. Prevalence of intimate violence – trends
A split sample experiment was conducted for the IPV module1 as a result of a review prompted by the extension of the survey to cover 10 to 15 year olds in 2009. Anecdotal feedback from interviewers suggested that the explicit language of the IPV questions, and that they are asked just before the interviewer seeks parental permission to carry out the child survey, may have led to a higher than anticipated parental refusal rate. The split sample experiment considered the use of explicit language in the questions and the ease of answering the questions as a respondent.
In the 2013/14 CSEW, the new questions were used for the whole sample for the first time. More information about the new questions can be found in the methodological note. Estimates calculated from the new questions are not directly comparable with estimates calculated from the original questions published in previous bulletins.
In all parts of the self completion module where the new questions have been used, estimates have been calculated entirely from the new questions. This means that all estimates for 2012/13 and 2013/14 and non-sexual partner and non-sexual family abuse estimates for 2010/11 and 2011/12 use the new questions. Where estimates have been calculated from the original questions an adjustment has been applied to make the estimates as comparable as possible across the time series. Adjustments have been calculated for each category and applied independently. This means that the adjustment applied to the back series for a headline category (such as partner abuse) is not dependent on any of the adjustments applied to sub-categories. More information on how the adjustment has been calculated can be found in the methodological note.
The 2013/14 CSEW self-completion module shows that the prevalence of domestic abuse experienced in the last year (6.5% of adults aged 16 to 59) was the lowest since the 2008/09 survey (also 6.5%).
For the period covering 2004/05 to 2006/07, the CSEW estimated that between 8.8% and 9.0% of adults experienced some form of domestic abuse in the last 12 months. The level then decreased significantly to 6.5% in the 2008/09 survey (the next year for which figures are available) and has been followed by a period of stability where estimates have ranged between 6.5% and 7.0%. The 2013/14 figure of 6.5% continues this fairly stable trend and represents the equivalent of an overall fall from around 2.7 million victims in the 2004/05 survey to 2.1 million victims per year according to the 2013/14 CSEW.
Overall, between the survey years 2004/05 to 2006/07, domestic abuse experienced by women ranged from 11.0% to 11.5%. Since 2009/10 the level has made small but consistent declines which resulted in a statistically significant change between 2004/05 and 2013/14. Domestic abuse experienced by men in the last year also saw a decrease between the survey years 2006/07 and 2008/09 (6.5% to 4.2%). Since then the prevalence has fluctuated between 4.1% and 4.9%. While not the lowest figure recorded since the 2004/05 baseline, the latest figure does still represent a statistically significant change between the 2004/05 and 2013/14 surveys.
A time series for the four main categories (see definitions of abuse section above) that make up domestic abuse can be found in Figures 4.3 and 4.4. The 2004/05 CSEW has been used as the base year as it was the first year that the module was included on a continuous basis. A comparable question on stalking was not included in the 2007/08 CSEW self-completion module on intimate violence, and so data for 2007/08 are omitted from the stalking trends time series.
Figure 4.3: Percentage of men aged 16 to 59 who experienced intimate violence in the last year, by headline category, 2004/05 to 2013/14 CSEW
Source: Crime Survey for England and Wales, Office for National Statistics
Notes:
- The stalking time series excludes a data point for 2007/08 due to comparable questions on stalking not being included that year
- In 2011/12 the stalking question was changed to separately ask about receiving emails and a additional behaviour added of putting personal, obscene or threatening information about you on the internet
- The definition of stalking changed in 2012/13 to be in line with the legal definitions by referring to at least two incidents
Download this chart Figure 4.3: Percentage of men aged 16 to 59 who experienced intimate violence in the last year, by headline category, 2004/05 to 2013/14 CSEW
Image .csv .xlsOf the headline measures, stalking has shown the largest decrease in prevalence (9.2% to 2.5% for men and 7.5% to 4.4% for women) ( Appendix table 4.04 (1.42 Mb Excel sheet) , Figure 4.3 and Figure 4.4).
Between the 2012/13 and 2013/14 surveys, the only headline category in intimate violence to see a statistically significant change in prevalence was sexual assault (decreasing from 1.9% to 1.5%). This was driven by a significant decrease in sexual assault against women from 3.0% in 2012/13 to 2.2% in 2013/14 which continues the decreasing trend from 2011/12. This decrease has been driven by a decrease in less serious sexual assault from 2.3% in 2012/13 to 1.8% in 2013/14 (while the prevalence of less serious sexual assault for men has remained relatively flat at around 0.8%).
Figure 4.4: Percentage of women aged 16 to 59 who experienced intimate violence in the last year, by headline category, 2004/05 to 2013/14 CSEW
Source: Crime Survey for England and Wales, Office for National Statistics
Notes:
- The stalking time series excludes a data point for 2007/08 due to comparable questions on stalking not being included that year
- In 2011/12 the stalking question was changed to separately ask about receiving emails and a additional behaviour added of putting personal, obscene or threatening information about you on the internet
- The definition of stalking changed in 2012/13 to be in line with the legal definitions by referring to at least two incidents
Download this chart Figure 4.4: Percentage of women aged 16 to 59 who experienced intimate violence in the last year, by headline category, 2004/05 to 2013/14 CSEW
Image .csv .xlsNotes for prevalence of intimate violence – trends
- For CSEW survey years 2010/11 to 2012/13.
5. Intimate violence in the last year by personal characteristics
In addition to women being more likely than men to have experienced intimate violence in the last year, victimisation varied by other personal characteristics ( Appendix tables 4.09 and 4.10 (1.42 Mb Excel sheet) ). Many of these characteristics will be closely associated (for example marital status and age) so caution is needed in the interpretation of the effects of these different characteristics when viewed in isolation.
Multivariate analysis performed on 2009/10 CSEW data found that the characteristics that were most closely associated with domestic abuse were use of any drug in the last year, marital status, having a long-term illness or disability and the respondent’s sex (Smith et al., 2011). Other variables such as household structure, age, tenure, occupation, household income, alcohol consumption and number of visits to a nightclub in the last month were also important.
Among both men and women, the prevalence of intimate violence was higher for younger age groups. Women aged between 16 and 19 and between 20 and 24 were more likely to be victims of any domestic abuse (13.1% and 10.1% respectively) compared with those aged between 45 and 54 and between 55 and 59 (7.1% and 5.9% respectively).
Similarly, younger men were also more likely to have experienced domestic abuse than older men. Men aged between 16 and 19 (7.5%) and between 20 and 24 (6.5%) were more likely than men aged between 45 and 54 (3.5%) and between 55 and 59 (2.4%) to have experienced domestic abuse in the last year ( Appendix table 4.09 (1.42 Mb Excel sheet) ).
Young women were also more likely to be victims of any sexual abuse in the last year; 6.7% of women aged between 16 and 19 compared with all older age groups (for example, 2.0% of women aged between 25 and 34). In addition women aged between 16 and 19 and aged between 20 and 24 were more likely to be victims of stalking (7.5% and 7.8% respectively) compared with all other age groups.
Figure 4.5: Percentage of women aged 16 to 59 who were victims of intimate violence, in the last year by age and type of abuse, CSEW, 2013/14
Source: Crime Survey for England and Wales, Office for National Statistics
Download this chart Figure 4.5: Percentage of women aged 16 to 59 who were victims of intimate violence, in the last year by age and type of abuse, CSEW, 2013/14
Image .csv .xls
Figure 4.6: Percentage of men aged 16 to 59 who were victims of intimate violence, in the last year by age and type of abuse, CSEW, 2013/14
Source: Crime Survey for England and Wales, Office for National Statistics
Download this chart Figure 4.6: Percentage of men aged 16 to 59 who were victims of intimate violence, in the last year by age and type of abuse, CSEW, 2013/14
Image .csv .xlsWomen who were separated had the highest prevalence of any domestic abuse in the last year (22.1%) compared with all other groups by marital status (such as married (3.7%), cohabiting (8.9%) or divorced (15.5%)). Married men experienced less domestic abuse (2.1%) compared with all other groups by marital status except widowed (3.9%, difference not statistically significant).
The pattern was slightly different for sexual assault with single women (4.1%) being more likely to be victims compared with those who were married (1.0%), cohabitating (1.6%), divorced1 (2.6%) or widowed (0.3%). This is likely to be strongly related to age.
Both women and men with a long-term illness or disability were more likely to be victims of any domestic abuse in the last year (15.7% and 8.4% respectively), compared with those without a long-term illness or disability (7.1% and 4.0%). This pattern was consistent across the sub-categories of domestic abuse with the exception of sexual assault where there was no significant difference. The largest difference occurred within the sub-category of partner abuse for female victims where 11.3% of women with a long-term illness or disability were estimated to be a victim of partner abuse compared with 4.9% of women without a long term illness or disability.
Women with a degree or diploma were less likely than women with other qualifications to be a victim of any domestic abuse in the last year (7.1% of women with a degree or diploma compared with 9.2% of women with ‘A level or equivalent qualifications’ and 10.0% of those with ‘GCSE or equivalent qualifications’). Women with no qualifications were not statistically different from other groups in their level of victimisation (9.1%).
Women who said they visited nightclubs were more likely than those who said they never visited a nightclub to have been victims of sexual assault. The number of times they visited night clubs may be closely associated with age which may be the main driver of this finding. The biggest difference was for women where 6.7% of those visiting night clubs once a week or more were estimated to be victims of sexual assault compared with 1.8% of those that did not visit night clubs.
Just over 1 in 5 women living in lone parent households were victims of domestic abuse in the last year (22.6%) compared with around 1 in 15 of those living in a household with other adults and children (6.7%) or a household with no children (7.7%). The pattern was similar for men, with an estimated 11.4% of men from lone parent households experiencing domestic abuse compared with 3.9% of men living in a household with other adults and children and 4.8% living in a household with no children.
Women living in the lowest income households (less than £10,000) were much more likely than those within higher income brackets to have experienced domestic abuse. Nearly three times as many women in the lowest income bracket had experienced domestic abuse compared with the highest household income bracket (£50,000 and over) (15.3% compared with 4.2%). The same pattern appeared for men where 9.1% men in the lowest income households experienced domestic abuse compared with 3.7% in the highest household income bracket.
Figure 4.7: Percentage of adults aged 16 to 59 who were victims of domestic abuse, in the last year by household income and sex, CSEW, 2013/14
Source: Office for National Statistics
Download this chart Figure 4.7: Percentage of adults aged 16 to 59 who were victims of domestic abuse, in the last year by household income and sex, CSEW, 2013/14
Image .csv .xlsWomen living in households in the 20% most deprived areas of England were more likely to be victims of domestic abuse (9.9%) than women in the 20% least deprived areas (6.1%). The prevalence of domestic abuse for men was not statistically different between these two area types. However, both men and women who lived in areas where there was a high level of physical disorder2 were more likely to suffer domestic abuse; 15.4% of women and 8.3% of men living in these areas estimated to have been victims of domestic abuse compared with 8.0% of women and 4.3% of men living outside of these areas.
Notes for intimate violence in the last year by personal characteristics
This category includes those who have legally dissolved partnerships.
Physical disorder is a measure based on the interviewer’s assessment of the level of (a) vandalism, graffiti and deliberate damage to property; (b) rubbish and litter; and (c) homes in poor condition in the area.
6. Intimate violence by relationship to offender
The survey module on intimate violence asks whether respondents have experienced sexual assault or stalking by a partner/ex-partner or a family member. The relationship refers to all experiences of abuse since the age of 16, rather than the most recent. This means that respondents may report abuse from multiple categories of partner/ex-partner, family member or anyone else.
It is not possible to establish the victim-offender relationship for all types of abuse experienced by each respondent from the new questions1. While it is possible to tell if a respondent has experienced abuse from a partner/ex-partner and a family member, it is not possible to tell whether or not they have also experienced abuse by another offender, such as a stranger. For this reason, the results presented here (Figure 4.5, Appendix table 4.11 (1.42 Mb Excel sheet)) are as a percentage of all victims, that is, all respondents who have experienced that type of abuse, irrelevant of the type of relationship with the offender.
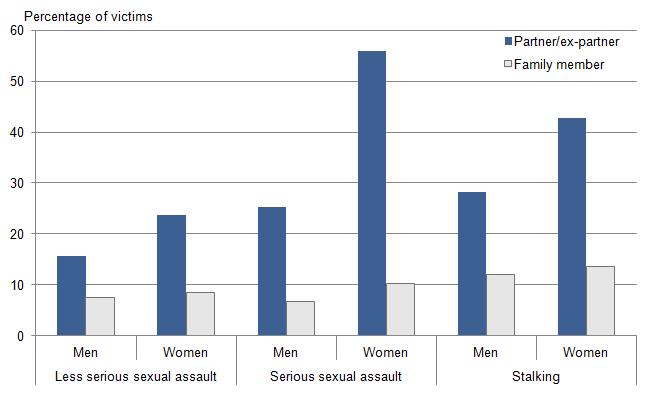
The majority of female victims of serious sexual assault have experienced at least one incident of serious sexual assault by a partner/ex-partner since age 16 (56.0%). In contrast, for less serious sexual assault around a quarter (23.8%) of victims had experienced at least one incident where a partner/ex-partner was the offender.
The percentage of victims who reported that the offender was a partner was significantly higher for women compared with men. There was no significant difference between men and women for the percentage reporting that they had been abused by a family member in each of the three types of abuse asked about.
Figure 4.8: Victim-offender relationship for sexual assault or stalking experienced since age 16, by sex for age 16 to 59, 2013/14 CSEW
Source: Crime Survey for England and Wales, Office for National Statistics
Notes:
- Figures are the percentage of victims who reported experiencing each type of offence by the relationship described.
Download this image Figure 4.8: Victim-offender relationship for sexual assault or stalking experienced since age 16, by sex for age 16 to 59, 2013/14 CSEW
.png (13.6 kB) .xls (34.3 kB)
Notes for intimate violence by relationship to offender
- The original questions allowed estimates for stranger and other known (who wasn’t a partner/ex-partner or family member) to be derived.
7. Nature of serious sexual assault
Further questions were asked in the 2013/14 Crime Survey for England and Wales (CSEW) to provide more detail on the circumstances of serious sexual assaults (including rapes) experienced by respondents either since the age of 16 or in the past year. For those who had experienced more than one incident, only the most recent incident was asked about as long as the respondent was at least 16 when the incident occurred.
Reflecting the differential rate of prevalence, it should be noted that the results for all adults presented in this section are dominated by the responses of women as the number of men interviewed who had experienced serious sexual assaults was small.
Further information is also available on sexual offences in ‘An Overview of Sexual Offending in England and Wales’. This is a joint publication by the Ministry of Justice, Home Office and the Office for National Statistics, published in January 2013, which brought together a range of official statistics from across the crime and criminal justice system on sexual offences. Along with other data sources, this report used combined CSEW data from the years 2009/10 to 2011/12 which differs from the data presented here (which relates to the latest 2013/14 survey year).
Offender characteristics
Respondents who reported that they had been victims of serious sexual assault since they were 16 were asked about characteristics of the offender and their relationship to them at the time that it happened.
Respondents who had experienced serious sexual assault since they were 16 reported that offenders were most likely to be men (99%), with 63% of victims reporting that the offender was a male aged between 20 and 39 (Appendix table 4.12 (1.42 Mb Excel sheet)).
For the majority of female victims of serious sexual assault, the offender was a partner / ex-partner or someone who was known to them other than as a partner or family member (47% and 33% respectively) with one sixth reporting the offender as a stranger (16%) (Appendix table 4.13 (1.42 Mb Excel sheet, Figure 4.6).The equivalent analysis has not been repeated for men as the number of victims of serious sexual assault was too small.
Figure 4.9: Victim-offender relationship for incidents of any serious sexual assault experienced by women since the age of 16, 2013/14 CSEW
Source: Crime Survey for England and Wales, Office for National Statistics
Download this chart Figure 4.9: Victim-offender relationship for incidents of any serious sexual assault experienced by women since the age of 16, 2013/14 CSEW
Image .csv .xlsLocation and number of incidents
Of those who had experienced a serious sexual assault since the age of 16, the majority took place in the victim’s home (38%) or the offender’s home (24%). For 10% of victims it had taken place in a park, other open public space or on the street (Appendix table 4.14 (1.42 Mb Excel sheet)).
Just over two fifths of victims of sexual assault had been the victim of serious sexual assault more than once since the age of 16 (44%) with nearly half of these respondents reporting being a victim more than three times (19% of all victims) (Appendix table 4.15 (1.42 Mb Excel sheet)).
Back to table of contents8. Influence of alcohol and drugs
Respondents who reported that they had been victims of serious sexual assault since they were 16 were asked whether they thought the offender (or offenders) was under the influence of alcohol or drugs and whether they (the victim) were under the influence of alcohol or drugs at the time of the incident1.
Victims were more likely to report that offenders were under the influence of alcohol rather than drugs (36% and 10% respectively) (Appendix table 4.16 (1.42 Mb Excel sheet)). The findings from the main 2013/14 CSEW showed that more offenders were under the influence of alcohol and drugs in violent incidents compared with serious sexual assault incidents, while the ratio of alcohol to drugs was similar. Victims believed the offender(s) to be under the influence of alcohol in around half (53%) of all violent incidents and under the influence of drugs in nearly a quarter (23%) of violent incidents (‘Nature of Crime’ table 3.09 (384 Kb Excel sheet)).
In 2013/14, 29% of victims reported that they were under the influence of alcohol at the time of the most recent incident of serious sexual assault and 3% reported that they were under the influence of drugs they had chosen to take. In the 2013/14 survey 6% of victims reported that they thought that the offender had drugged them during the last incident of serious sexual assault that they had experienced (Appendix table 4.16 (1.42 Mb Excel sheet)).
A higher percentage of victims were under the influence of alcohol when the offender was a stranger (38%) compared with when the offender was a partner/ex-partner (14%) (Figure 4.10, Appendix table 4.17 (1.42 Mb Excel sheet)). The percentage of victims that didn’t know whether or not they had been drugged was also higher when the offender was a stranger (13% compared with 2%). The two remaining categories (victim under the influence of drugs and victims has been drugged) showed no significant difference between the estimates.
Figure 4.10: Influence of alcohol and drugs on incidents of any serious sexual assault against women since the age of 16 where the offender was a partner/ex-partner or stranger, 2013/14 CSEW
Source: Crime Survey for England and Wales, Office for National Statistics
Download this chart Figure 4.10: Influence of alcohol and drugs on incidents of any serious sexual assault against women since the age of 16 where the offender was a partner/ex-partner or stranger, 2013/14 CSEW
Image .csv .xlsA fifth (20%) of victims were asleep or unconscious in the most recent serious sexual assault that they had experienced (Appendix table 4.18 (1.42 Mb Excel sheet)). For over half (57%) of victims, physical force had been used by the offender to try and make the respondent have sex with them and a tenth of victims, reported that the offender had choked or tried to strangle them. A quarter of victims reported that the offender frightened them or threatened to hurt them.
Notes for influence of alcohol and drugs
- The questions on influence of alcohol or drugs were asked of victims of serious sexual assault since age 16 because the number of victims of serious sexual assault in the last year was low. Some respondents to these questions on the influence of drink or drugs responded “Don’t know”, “Don’t want to answer” or “Can’t remember”.
9. Reporting of serious sexual assault
Those who had experienced a serious sexual assault since the age of 16 were asked who they had personally told. A third had not told anyone about their most recent experience (33%). Looking at whom victims had told, 58% of victims had told someone they knew personally and 28% told someone in an official position. One in six had told the police (17%) (Appendix table 4.19 (1.42 Mb Excel sheet) ).
Despite the low level of reporting to the police, in cases where the police did come to know about the incident of serious sexual assault, the majority of victims (64%) reported that they found the police to be very or fairly helpful and 36% reported they found the police not very helpful or not at all helpful ( Appendix table 4.20 (1.42 Mb Excel sheet)).
Of those who had told the police, the majority said they did so because they wanted to prevent it happening to others (52%) or they wanted the offender to be punished (49%) ( Appendix table 4.20 (1.42 Mb Excel sheet)).
Of those who had told someone, but hadn’t told the police, around two fifths said it was due to being embarrassed (41%), a third said it was due to not wanting more humiliation (30%) and around a quarter didn’t think the police could help (26%) (Figure 4.11, Appendix table 4.21 (1.42 Mb Excel sheet)). Of those who didn’t tell anyone, 42% said it was because they were too embarrassed (Figure 4.12, Appendix table 4.21 (1.42 Mb Excel sheet)).
Figure 4.11: Reason for not telling the police when the victim had told someone, CSEW 2013/14
Source: Crime Survey for England and Wales, Office for National Statistics
Download this chart Figure 4.11: Reason for not telling the police when the victim had told someone, CSEW 2013/14
Image .csv .xls
Figure 4.12: Reason for not telling anyone, CSEW 2013/14
Source: Crime Survey for England and Wales, Office for National Statistics
Download this chart Figure 4.12: Reason for not telling anyone, CSEW 2013/14
Image .csv .xlsThe majority (72%) of victims of serious sexual assault felt that it was a crime while 17% felt that it was wrong, but not a crime ( Appendix table 4.22 (1.42 Mb Excel sheet)).
Back to table of contents10. Effects of serious sexual assault
Nearly half of victims (45%) reported suffering physical injuries from the most recent serious sexual assault incident they had experienced since age 16. The physical injuries victims were most likely to suffer were minor bruising or a black eye (30%). Three in five (61%) victims of serious sexual assault suffered mental or emotional problems, while two in five (41%) reported having problems trusting people or having difficulty in other relationships. In 9% of incidents, the victim attempted suicide as a result. The victim reported becoming pregnant as a result of the incident in 5% of incidents and the victim reported contracting a disease in 3% of incidents ( Appendix table 4.23 (1.42 Mb Excel sheet) ).
Back to table of contents11. Attitudes to sexual violence
In addition to questions about experiences of sexual assault, questions were included in the 2013/14 survey to gauge public attitudes towards victims of such violence. All adults aged 16 to 59 were asked in the self-completion section of the interview about their attitudes towards sexual violence: the majority of people thought that victims were not responsible for someone sexually assaulting or raping them when they were drunk (66%), under the influence of drugs (60%) or if they had been flirting heavily beforehand (56%) (Appendix table 4.24 (1.42 Mb Excel sheet), Figure 4.13).
However, around one in eleven people thought that the victim is ‘completely’ or ‘mostly’ responsible for a sexual assault or rape by someone they have been flirting heavily with beforehand (9%), when they were under the influence of drugs (8%) or while drunk (6%). The difference between these percentages and the equivalent figures from 2011/12 are not statistically significant.
Figure 4.13: Attitudes to sexual violence in different contexts or circumstances, CSEW 2013/14
Source: Crime Survey for England and Wales, Office for National Statistics
Download this chart Figure 4.13: Attitudes to sexual violence in different contexts or circumstances, CSEW 2013/14
Image .csv .xlsWomen were more likely than men (59% and 53% respectively) to think the victim was not responsible for someone sexually assaulting or raping them if they had been flirting heavily beforehand (Appendix table 4.25 (1.42 Mb Excel sheet)). There were no other statistically significant differences between the attitudes of men and women.
Figure 4.14 shows the attitudes to sexual violence if the victim had been flirting heavily beforehand broken down by age band. In general, the younger age groups and the older age groups were less likely to think the victim was not responsible; however, not all the differences between age groups are statistically significant. The general pattern observed in this chart is similar for attitudes if the victim was drunk or on drugs (Appendix table 4.26 (1.42 Mb Excel sheet)).