In this section
- Introduction
- The Office for National Statistics (ONS) Population and Migration Statistics Transformation Programme
- Transforming international migration statistics
- Data on migrant journeys
- A total error framework to understand international migration data
- Our longitudinal admin data error framework
- Use of error frameworks in design
- Quality indicators
- Comparability ratios
- Quantification of false positive and false negative matching
- Analysis of residuals from linkage and matching
- Summary
- References
- Appendix 1: Errors in the single-source framework
- Appendix 2: Longitudinal error
- Appendix 3: Errors in the multiple-source framework
1. Introduction
The Office for National Statistics (ONS) is committed to increasing the use of administrative data in the production of population statistics. The current focus is on improving the estimation of international migration, using a range of administrative data sources.
We are engaged in a consultation exercise to better understand the migration statistics that our users need. We are also collaborating with the Home Office in the use of their administrative data, and to understand how the government's plans to build a new end-to-end border and immigration system may provide new opportunities to use administrative data sources to measure international migration.
As part of this programme of research, methodologists working alongside migration experts within the ONS have been looking at applying the Statistics New Zealand (SNZ) guidance on reporting administrative data quality to Home Office exit checks data.
In this project, we are indebted to migration experts at the Home Office whose knowledge of the data and their systems is greatly contributing to our understanding. Based on our learning and understanding of Home Office exit checks data, we have been able to develop a generic framework that can equally be applied to other longitudinally linked administrative data.
Building on the framework developed by SNZ for administrative sources, we present one general framework for single longitudinal data sources, and one for multiple sources that are longitudinally linked. Some of the statistical error that we seek to understand is at the conceptual level and therefore not easily measurable, although some error can be quantified.
We consider how statistical error can occur within administrative data both through data processing and linkage through time, and how this may be addressed by the organisations collecting and managing these data, or by organisations that are repurposing the administrative data to produce statistical outputs.
The SNZ framework provides a valuable organising structure for quality investigations, and has informed the development of quality indicators, which can be used to assess single or multiple sources. As part of this process, we have additionally reviewed and included quality indicators developed by the Home Office for reporting on statistics produced from exit checks data.
Our knowledge of statistical error structures that may appear in the administrative sources is informing the design of further linkage within the ONS, including longitudinal linkage of other administrative data in the production of population and migration estimates. This article describes our research and considers how we might optimise the design of integrated datasets going forward using these new insights and quality indicators.
This is work in progress and we are keen for your comments and views on the utility of this framework to you.
Back to table of contents2. The Office for National Statistics (ONS) Population and Migration Statistics Transformation Programme
The Office for National Statistics (ONS) is the UK's largest independent producer of official statistics and is its recognised national statistics institute. We are responsible for collecting and publishing a broad range of statistics related to all aspects of social life, the economy, population, and society, at national, regional and local levels. Every ten years we also conduct the census of population for England and Wales.
Like many other national statistical institutes (NSIs), we are committed to increasing the use of administrative data in the production of our statistics to reduce costs, reduce respondent burden, and to improve the quality and granularity of our statistics.
We are currently progressing a programme of research, which aims to deliver a fully transformed population and migration statistics system based on integrated administrative data by 2023. A critical component of that system is the estimation of international migration. We are working in partnership with other departments from across the Government Statistical Service (GSS) to transform the statistics available, to improve the evidence base for migration, and to research and understand migrants' experiences in the UK.
Back to table of contents3. Transforming international migration statistics
We currently produce statistics on short-term and long-term international migration and the migrant population, largely following United Nations definitions for these. Our estimates are primarily based on the International Passenger Survey (IPS), which has been collecting information from people entering and leaving the UK since 1961.
We have accepted for some time that the IPS is being stretched beyond its originally intended use; the survey-based estimates do not provide local authority-level outputs, for example, at a time when our users are requesting more granularity in our data on international migration.
The changing policy context means that decision-makers and the public are requesting more evidence on migration, including the impact of migration on the economy and society at local levels. High demand includes calls from parliamentary committees requesting better evidence on migration.
For these reasons we are pursuing a programme of research, and in January 2019 we published a research engagement report, updating our users on our population and migration statistics transformation journey.
We are considering all possible sources of information on international migration, and on the experiences of international migrants. We are looking into using administrative data from the NHS, the Higher Education and Statistics Agency (HESA), HM Revenue and Customs (HMRC), and the Department for Work and Pensions (DWP). One of the richest and most promising data sources so far is administrative data from the Home Office's exit checks programme.
We expect that the transformed international migration estimates will draw on several sources, enhanced through record linkage. With that in mind, the framework we have developed is intended as a helpful taxonomy of the potential errors that are integral to administrative data sources, which we need to be aware of in either evaluating administrative-based sources or in designing new, integrated, longitudinal datasets based on administrative data.
Back to table of contents4. Data on migrant journeys
The Home Office exit checks programme, introduced in April 2015, was designed primarily for operational (immigration control) purposes, and collected data on non-EU nationals departing from and arriving in the UK.
The Initial Status Analysis (ISA) system (developed by the exit checks programme) is a linked database that combines data from Home Office systems to build event histories that consist of an individual's travel in or out of the country, together with data relating to immigration status (for example, type and periods of leave granted indicated on a traveller's visa). These combined data are used by the Home Office for operational and security purposes but might also have statistical benefits.
Data in the ISA system are derived by integrating and matching data from multiple administrative systems including (via carriers) passenger data, passport scans at the border, and from immigration records. Producing statistics from these multiple sources presents a range of challenges. But, it has been possible to produce valuable statistical insights (see annual 'Migrant Journey') and practical operational benefits for the Home Office and to help us better understand non-EU migration patterns.
The Home Office has extensively published annual reports on the quality of data collected under the exit checks programme, improvements to data quality, and some statistical findings from the data. Quality indicators on the attributes of the data have been developed and are regularly reported on within these reports, including:
coverage: the measure of the proportion of routes which are covered by the system for collecting data on border crossings
completeness (voyage-level data receipt): the extent to which carriers supply Advance Passenger Information (API) for voyages; this does not mean that all data for every passenger was received
coherence (the processing of API data and matching to other sources): match rates of API data to immigration system records and passport examinations data
The approach taken by the Home Office is to use multiple sources of data to correct for missing data and reduce error. API data have been used for a number of years to inform operational immigration control assessments. Over time, processes have been implemented to improve the quality of the data, such as addressing duplicate records.
The Home Office also employs multiple matching techniques and business logic to make best use of records with poor data quality but are cautious enough to reduce false positive matches (combining events relating to two different individuals).
No single administrative source will meet all our data needs for international migration. While exit checks data are high quality and detailed, this currently only covers non-EU nationals departing from and arriving in the UK. Possibly its optimal use is as a gold standard against which to benchmark less detailed sources, or those which have more comprehensive coverage.
Because of its strategic importance for our research, we are taking care to understand the quality of the data. The approach taken by the Home Office provides an innovative perspective that contrasts with more traditional views of data quality from linked administrative data sources.
Back to table of contents5. A total error framework to understand international migration data
Our research draws heavily on the framework for measuring administrative data that has been developed by Statistics New Zealand (SNZ). The SNZ approach draws on the systematic identification of sample survey error described in Groves et al (2004), adapted for administrative data sources by Zhang (2012).
The framework is designed to help statisticians to understand the strengths and limitations of data, including administrative data, survey data and combinations of the two. The framework proposes a staged approach to understanding data quality, looking first at individual datasets (Phase 1), before assessing the datasets created through the integration of different datasets (Phase 2).
We found this taxonomy of error to be highly valuable in helping us to analyse and understand Home Office exit checks data and its use in the production of international migration estimates. We have also consulted the literature on longitudinal error, see for example Lynn (2001 and 2009), Lynn and Lugtog (2016) and Tourangeau (2018).
Linkage processes at the Home Office are carried out for operational purposes. The methods are very sophisticated, producing high-quality linkage. The complexity of the data processing, and the fact that it is carried out beyond the Office for National Statistics (ONS), mean that we need quantitative indicators of data quality to support the use of this information for estimation purposes. These aim to complement the quality indicators currently used by the Home Office to report on the quality of statistics collected under the exit checks programme (coverage, completeness and coherence) but are more specific for our purposes.
Figure 1 shows our interpretation of the exit checks data journey in the terms set out in the SNZ framework. The production of the exit checks data (PDF, 662.27KB) begins with the supply to the Home Office of passenger data, supplied by commercial carriers at UK ports of entry and exit.
The Home Office processes and manages the quality of these data. This generates a dataset of journey information which, in terms of the error framework, we consider to be a single-source dataset, even though it is provided by a range of separate suppliers.
The Home Office ingests these data into their Initial Status Analysis (ISA) system, where the journey data are linked to each other and then to other Home Office sources, including for example visa data. This is multiple-source linkage within the Home Office that aims to correct for missing data and reduce error.
An extract of ISA system data has been passed to the ONS where we are understanding data quality and linking the data to other administrative sources. These are longitudinal events data and we have extended the SNZ framework to reflect the longitudinal dimension. In the process, we have both simplified and added complexity to the framework. Figure 1 summarises the complex processes involved to create Home Office exit checks data.
Figure 1: Complexity of exit checks data linkage

Source: Office for National Statistics interpretation of Home Office Exit Checks data processes
Notes:
Blue boxes represent data.
Green boxes represent processes.
Objects (data objects) refer to rows in the data source, and what those rows of data represent.
Attributes (variables) refer to columns in the data source, and what those columns represent.
Download this image Figure 1: Complexity of exit checks data linkage
.png (39.6 kB)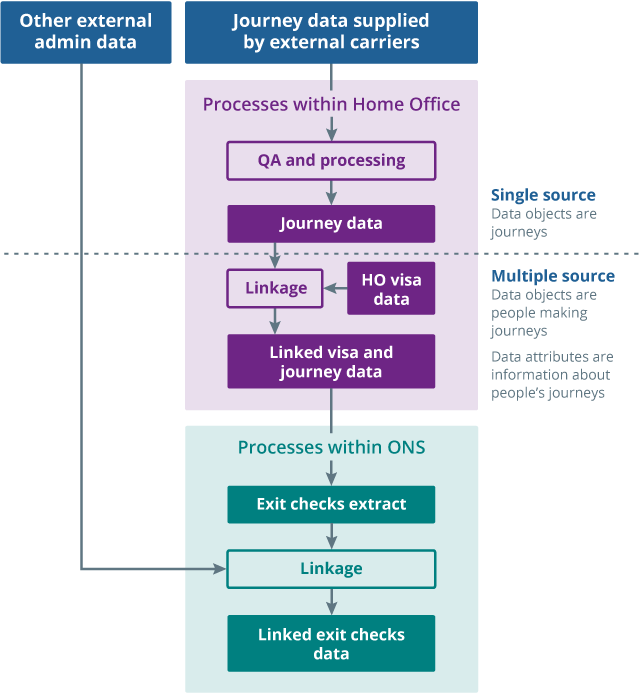
6. Our longitudinal admin data error framework
Much of the population statistics transformation research in the Office for National Statistics (ONS) involves longitudinal linkage by diverse teams. We have tried to create a simplified version of the framework, which is also labelled as intuitively as we could manage, shown in Figure 2 (single-source data) and Figure 3 (multiple-source data).
Our framework is conceptual with the intention that it can be applied to single-source and linked administrative data sources that are longitudinal in nature. We are in the process of applying our framework to ONS administrative-based population estimates (ABPE) and longitudinally linked Department for Work and Pensions (DWP) data.
We welcome comments on whether this is desirable or has been achieved. We have attempted to give a fuller account of the potential sources of error at each processing stage, drawing on published quality metrics and what we have observed in our data, and in an attempt to give the framework broader utility within the ONS.
Perhaps the biggest difference between our framework and the Statistics New Zealand (SNZ) one is that while we recognise the conceptual difference between objects and their attributes, we also acknowledge that often the data come to us as a coherent dataset already formed and we have little influence over their design.
We still consider these separate dimensions of the data, but rather than representing them as two parallel conceptual flows, we have at the heart of our framework datasets which we have not designed, they are what they are, but which we then transform through our data integration processes.
The framework suggests a staged approach to understanding data quality, looking first at single datasets before assessing error in the production of datasets that are the result of integrating two or more single sources. Figures 2 and 3 show the generalised error frameworks for single and multiple sources. Appendices 1, 2 and 3 define the statistical errors that may occur at each stage.
The single-source framework identifies four different stages of the data journey:
target data
accessible data
accessed data
processed data
Errors are represented as a conceptual difference between data at each of these stages. Target data are conceptual – the ideal data to be collected, and so errors between target data and accessible data are conceptual.
Errors are split between objects and attributes. Errors occurring to objects relate to the entity the data are for, for example, people, events or businesses. Errors relating to attributes relate to what is being measured for the objects. Errors for both objects and attributes can affect each other (represented by a double arrow between the two). Not all types of errors will be applicable to each source of data, and there may be other sources of error identified, particularly for processed data.
Traditional approaches often imply that error propagates through the framework, building at each stage, implying that errors accumulate with additional linkages. However, the Home Office approach shows it can be more nuanced than that. Experts at the Home Office proactively manage the quality of data in the exit checks programme and use the combination of additional sources to reduce and correct errors as the data pass through their systems. There is therefore an overall reduction in error through data linkages over time.
While errors can accumulate over time, there is also the possibility that compensating errors may complicate matters. Compensating errors, such as undercoverage – which can be masked by duplicates in the data – may be invisible in cross-sectional comparisons. They will, however, compound in longitudinal analysis.
The framework also incorporates longitudinal error created by the collection of data over time, for example as the result of seasonality or periodicity, attrition, and censoring (Appendix 2).
Figure 2: Single-source error framework

Source: Office for National Statistics adaptation of Statistics New Zealand error framework
Notes:
Time is presented vertically.
Target data represents the ideal data to be collected.
Objects (statistical data units) refer to rows in the data source, and what those rows of data represent.
Attributes (variables associated with the objects) refer to columns in the data source, and what those columns represent.
More information on the terms used can be found in Appendices 1 and 2.
Download this image Figure 2: Single-source error framework
.png (52.1 kB)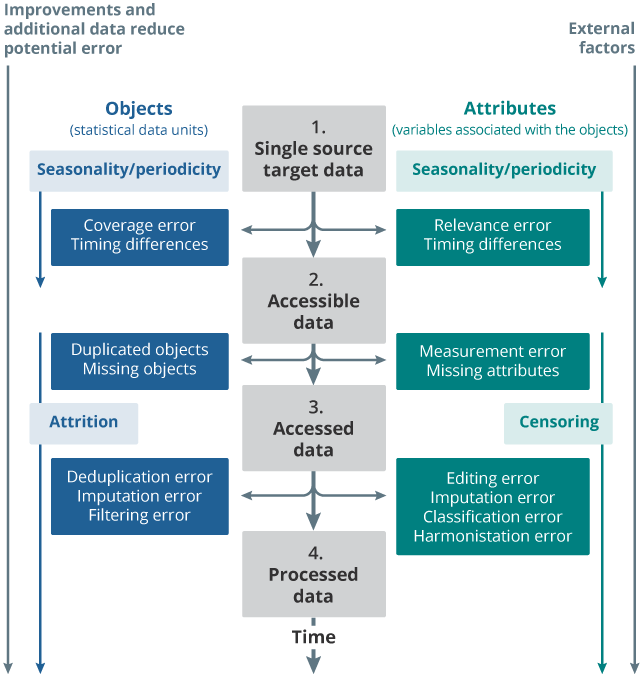
The multiple-source framework (Appendix 3) is for the linkage of multiple data sources. It consists of five stages:
target linked data
source data
linked data
aligned data
processed data
Errors are represented as a conceptual difference between data at each of these stages. Many of the errors in the multiple-source framework are conceptually similar to those in the single-source framework. The main difference is the fact that we are measuring errors between the source datasets and the ideal target-linked data (rather than target data) as well as errors between the source datasets to be linked. These conceptually similar errors have the same name between the single-source and the multiple-source frameworks. For example, timing differences, coverage error, relevance error, imputation error, selection error, and processing error.
Target-linked data are different to the target data for each individual source. Target-linked data are likely to be specific to the group of objects that will be measured through linkage of multiple sources. For the final stage (processed data), processing may have occurred in the single-source or in the multiple-source framework. For example, imputation may have already occurred at single source, or it may be done after linkage.
Figure 3: Multiple-source error framework
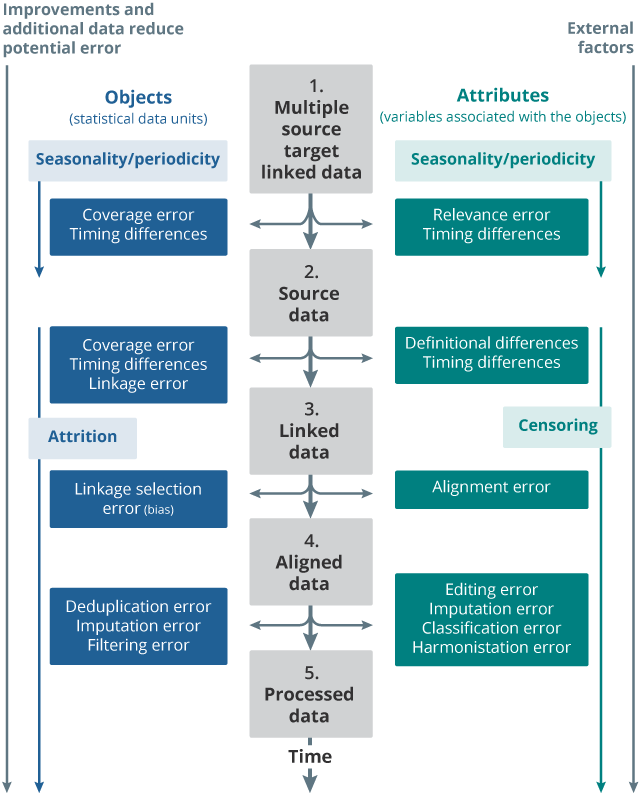
Source: Office for National Statistics adaptation of Statistics New Zealand error framework
Notes:
Time is presented vertically.
Target linked data represent the ideal linked data to be produced.
Objects (statistical data objects) refer to rows in the data source, and what those rows of data represent.
Attributes (variables associated with the objects) refer to columns in the data source, and what those columns represent.
More information on the terms used can be found in Appendices 2 and 3.
Download this image Figure 3: Multiple-source error framework
.png (59.5 kB)
7. Use of error frameworks in design
The purpose of applying administrative data error frameworks is to identify and examine sources of error to inform statistical design decisions in the production of further linkage. In the framework we have developed, we note the interaction between different sources of error, and the need to seek data designs that are optimal for the intended purpose of the linked dataset. For example, there may be a trade-off between linkage, coverage and imputation error.
Records that have poor quality data, possibly through measurement error, are also harder to link, which may be in part because of the quality of the identifiers used for linkage. One option is to develop sophisticated record linkage methods to minimise false negative matches (therefore accepting more false positives) and in this way aim to maximise the coverage of objects in the linked dataset.
There is a possibility that the attributes relating to these objects are also of poor quality, and will generate either missingness in the attribute fields, or will require imputation. Imputation is often undesirable in longitudinal data, since it can introduce spurious outcomes. The avoidance of missing data and imputation may be a more important concern than maximising coverage.
We also note the interaction between errors in objects and in attributes, and between the single- and multiple-source datasets. In our example, errors in the journey data will affect the ability to perform de-duplication in the single-source processing. This in turn will affect the ability to link journeys and thereby create identities. In our example, in the single-source processing, journeys are the objects but in the multiple-source processing, these become attributes and identities are the objects.
Back to table of contents8. Quality indicators
The administrative data error framework is helpful in evaluating the quality of linked datasets. We have also been developing quality indicators to measure dataset quality at different processing stages. These include comparability ratios for the processed data (both single- and multiple-source), false positive and false negative measures for linked multiple-source data, and analysis of the characteristics of residuals.
Back to table of contents9. Comparability ratios
In the example of exit checks data, the Home Office has developed quality indicators for coverage and completeness. Coverage is a measure of the proportion of routes (air, maritime and rail) that are covered by the system for collecting data on border crossings. Further detail is available in the fourth report on statistics collected under the exit checks programme.
The Home Office also publishes indicators on the completeness of the processed Home Office exit checks data referred to as "voyage level receipt". These are available for aviation routes and relate to the extent to which carriers supply Advance Passenger Information (API) data for voyages, not whether all data for every passenger on a particular flight was received.
We have generated comparability ratios to assess coverage of administrative data in single-source processing, which can be applied to the processed data. Comparability ratios can be usefully used to assess the coverage of a processed dataset against a "gold standard" or equivalent dataset. The basic idea is to find a benchmark against which to compare the administrative data.
While it is not always possible to have a "gold standard" or error-free comparison dataset, comparing against an equivalent or similar dataset can highlight definitional differences and patterns of variance for important attributes, either cross-sectionally or over time. Where patterns between data sources are inconsistent, these need to be explored in more detail.
For our purposes of assessing the statistical quality of Home Office exit checks data for use in production of migration statistics, we need to understand data quality at a more granular level, for example by port or time.
We have generated comparability ratios; in this analysis, these are defined as the ratio of journeys in the aggregate Semaphore data compared with industry data supplied by the Civil Aviation Authority (CAA) and other carriers. In our example, the aggregate Semaphore data are processed from API data and CAA data are single-source processed data. Our population of interest here are people arriving and leaving UK airports.
We note that this is a far from perfect comparison, for example because CAA data exclude transit passengers who are included in Semaphore data. Transit passengers have not been removed from the aggregate Semaphore data we are comparing with, and therefore the comparison is imperfect. For this reason, rather than focusing on the values of the individual comparability ratios, we scan them to detect unexpected signals. Here we are scanning the consistency of values over different ports, but the method is equally useful for assessing consistency over time.
Figure 4: Airport arrivals comparability ratios by airport and year
Embed code
Figure 4 summarises our analysis of airport arrivals in the UK using Semaphore and CAA Industry data as comparability ratios. Comparability ratios for Figure 4 have been calculated as follows:
Where:
Semaphore(p,t) are the aggregated Home Office journey data at port p and time t
And Industry(p,t) are the Industry data for the same port p and time t
In Figure 4, the horizontal axis represents airports ranked by total passenger flow (from largest to smallest). The vertical axis represents the comparability ratio meaning that each column of dots shows the ratio of Semaphore to CAA data for airports in 2016 and 2017.
In Figure 4, if the two data sources were exactly comparable, the comparability ratio would be one from each airport. In our framework, we would use this indicator to assess coverage of the single-source data. We can see that, for most airports, the comparability ratios hover around the value of one and are consistent across the two years. We are therefore content that coverage of Home Office journey data by airport in the exit checks is consistent, given that this is based on Semaphore API data.
We are also intending to develop comparability ratios for the multiple-source dataset. In this example, comparing ISA and Semaphore data will highlight data changes as a result of Semaphore processes, and will deepen our understanding of the Home Office exit checks data.
Where:
ISA system travellers(p,t,a,s,n) are identities formed through the linkage of travel events at port p and time t, by age a, sex s and nationality n.
And Semaphore(p,t,a,s,n) are the equivalent data prior to Stage 2 linkage.
By examining patterns in the comparability ratios, we can identify potential differences. Going forward, our challenge is to tease these out and understand the differences, and to identify data quality signals that emerge from the comparisons while not over-interpreting random variation. For fuller discussion of systematic and random variation in administrative data time series, see Wallgren and Wallgren (2014).
Back to table of contents10. Quantification of false positive and false negative matching
The Home Office Initial Status Analysis (ISA) database combines immigration and travel events data into travel histories for individuals through data linkage and matching. This also includes external linking based on immigration system data, and additional data matching to create (as far as possible) a single person-centric dataset. In our framework, we describe this as a linked multi-source dataset, where the objects are the identities and the attributes are travel events.
Linkage errors can arise from matching objects together incorrectly (false positive error) and failing to link objects together that should have been linked (false negative error). The Home Office employs multiple matching techniques and business logic with the aim of reducing false positive matches (that is, combining events relating to two different individuals).
Matching rates of Advance Passenger Information (API) and passport examinations data are reported. Match rates are high, reporting over 90% for both inbound and outbound journeys; this means that for more than 9 out of every 10 travel events to or from the UK by a visa national with an identity on ISA, there was a corresponding and linkable out of country visa or in country grant of leave.
To build our understanding of the quality of Home Office linkage and matching, we have taken a sample of identities stratified by the number of their travel events and conducted a clerical examination of the records to check whether there are any matches that have been made that appear to be erroneous. This has confirmed the very high quality of the record linkage at the Home Office, and the few anomalous matches that we found are being reviewed.
A similar clerical exercise can be conducted to check for false negative matching if required. Analysis of unmatched records will develop knowledge further and allow assessment of the effectiveness of de-duplication processes applied to administrative data.
Back to table of contents11. Analysis of residuals from linkage and matching
Analysis of linkage or matching residuals allows us to understand differences for important characteristics between unmatched residuals and the linked data, for example age and sex. This will help understand if the linked data are representative of the population of interest.
For example, further linkage of Home Office exit checks data to Higher Education Statistics Agency (HESA) data for international students in higher education has helped to inform our understanding of international students' length of stay during their studies. The HESA data included all non-EU students who require a visa to study in England and Wales.
We matched this against Home Office exit checks data for migrants on a study visa sponsored by an institution covered by the HESA data. Match rates of 80% and 74% were achieved for academic years 2015 to 2016 and 2016 to 2017, respectively. This multi-source linkage is work in progress. So far, the data have been linked using deterministic matching, so the unlinked data will contain false negative matches.
Figure 5: Matched 2015 to 2016 exit checks and HESA data and unmatched residuals, by age, for male non-EU nationals
Source: Office for National Statistics analysis of Home Office Exit Checks data and Higher Education Statistics Agency (HESA) data
Notes:
Age refers to age of individuals on 30 June 2015.
Non-EU nationals were analysed because only non-EU nationals are included in Home Office exit checks data.
Numbers below three have been rounded to zero, numbers between three and five have been rounded to five.
Download this chart Figure 5: Matched 2015 to 2016 exit checks and HESA data and unmatched residuals, by age, for male non-EU nationals
Image .csv .xlsFigure 5 shows the age distribution of the matched and unmatched data following HESA and exit checks for males. From these distributions based on residuals from deterministic matching alone, it is impossible to know the extent to which the matched dataset is representative of all non-EU nationals in higher education. As well as falsely unmatched records, the HESA residuals could include non-EU nationals who hold non-study visas, for example because they are also in employment or hold family visas. Further matching and investigation is underway.
Back to table of contents12. Summary
ONS is transforming its population statistics system and a key strategic aim is to make better use of administrative data, reducing our reliance on survey data. It has long been recognised that we need better data on international migration. The International Passenger Survey is being stretched beyond its original purpose and cannot support the more granular statistics that our users need. We are urgently seeking to enhance our estimation processes with administrative data. Exit Checks data from the Home Office provide details of the travel histories of non-EU nationals coming to the UK. These high-quality data, compiled by migration experts within the Home Office, fulfil important operational purposes. ONS needs to understand the statistical properties of these data for its own use in future migration and population estimates.
The framework for single- and multiple-source integrated data in use by Statistics New Zealand (SNZ) has provided a valuable taxonomy of potential data error, and an organising framework for understanding administrative data quality. The framework we present here extends the SNZ approach to focus on linked administrative data that is longitudinal in nature.
Our framework is valuable for making design decisions where trade-offs between different types of error could be finely balanced. Shrewd judgement requires an understanding of the error dynamics at play in the data.
In the case of Home office exit checks data where we receive a coherent linked dataset after it has been through processing, the framework has deepened our knowledge and understanding of data quality issues. Through regular and close collaboration with Home Office colleagues we have been able to create a virtual feedback loop whereby our insights can help inform improvements to existing operational processes and for statistical purposes.
Some of the errors to be considered cannot be easily quantified. In these cases, it is important that they are conceptualised so that the scale and implications of the errors can be borne in mind and managed. A number of indicators seek to quantify data errors – comparability ratios that benchmark the data against other sources. Even if both sources have errors, the relationship between them over time is illuminating, shining a light on both variance and potential bias.
In other work, logged comparability ratios have been modelled, as a means to attempt to measure statistical uncertainty. Qualitative investigation has produced estimates of false positive linkage. The age and sex distributions of linkage residuals provide some insight on the representativeness of our linked datasets.
We are in the process of obtaining a second tranche of Home Office exit checks data. This will help us to elaborate the framework further, with the identification of sources of error that that produce edge effects in longitudinal analysis, for example, as a result of retrospective corrections resulting from the linkage of new prospective events.
The framework described here was produced to support the use and understanding of the exit checks data, but we have attempted to make it a generalisable tool to use with any longitudinal administrative source. We will be testing its utility by applying it to the new ONS administrative-based population estimates.
We are very keen to receive feedback and observations on our work, including from those who find it useful, and in particular, those who think it needs further thought and refinement. Please contact us at demographic.methods@ons.gov.uk with any comments.
Back to table of contents13. References
Groves, R. M., F. J. Fowler Jr., M. Couper, J. M. Lepkowski, E. Singer and R. Tourangeau (2004), Survey methodology, Wiley, New York
Lynn, P. (2001) A Quality Framework for Longitudinal Studies (PDF, 85.0KB)
Lynn, P. (2009) Methods for Longitudinal Surveys, in Lynn, P. (ed) Methodology of Longitudinal Surveys, Wiley, Chichester
Wallgren, A. and Wallgren, B. (2014) Register-based Statistics; Administrative Data for Statistical Purposes, John Wiley and Sons; Chichester
Zhang, L. (2012), Topics of statistical theory for register‐based statistics and data integration. Statistica Neerlandica, 66: pp 41-63
Back to table of contents14. Appendix 1: Errors in the single-source framework
Objects1
Frame error:
Coverage error
Assessing objects that are not in the target data, or not being able to access objects that are in the target data.
Timing differences
Objects in the ideal target data that are not accessible because of a discrepancy in the time window for obtaining observations.
Selection error:
Duplicated objects
Objects that are represented more than once in the accessed data.
Missing objects
Objects that in theory are accessible but are not in the accessed data.
Processing error:
Deduplication error
Errors arising from deduplication of objects in the accessed dataset. This could include both deduplicating objects that are different (false positive error) or failing to deduplicate objects that are the same (false negative error).
Imputation error
Errors arising from the imputation of missing objects.
Filtering error
Errors arising from the selection or de-selection of accessed objects to an ideal target set.
Attrition:
The loss of research objects or units over time. Occurs naturally, through death (or an unobserved migration). Also occurs through failure of follow-up, a refusal to take part, in the case of survey data, or through missing information or linkage failure, in administrative sources.
Periodicity/seasonality error:
Objects are not observed because the data capture is not frequent enough (periodicity) nor adequate to capture seasonality in the data (seasonality).
Attributes2
Relevance error:
Validity error
The difference between ideal measurement of attributes sought about an object and the operational measure used to collect it.
Timing differences
A conceptual discrepancy in the timing of the measurement of attributes between the ideal target data and accessible data.
Measurement error
Measurement error
Errors arising from attributes that are not recorded accurately.
Missing attributes
Attributes that are missing from the accessed data (could be for specific objects or all the objects).
Processing error:
Editing error
Errors arising from editing the value of an attribute. This could include editing as a result of validation or QA checks.
Imputation error
Errors arising from the imputation of missing attribute values.
Classification error
Errors arising from classification of values into groups or derivation of new attributes.
Harmonisation error
Errors arising from the harmonisation of values of attributes to an ideal or target concept
Censoring:
Where the value of a measurement or observation is only partially known. Right censoring is when the research object drops out of the data before the end of the observation window or does not experience the event of interest during the observation window. Left censoring is when the event of interest has already occurred, before the observation window begins.
Periodicity/seasonality error:
Measurement of attributes over time are not frequent enough (periodicity) nor adequate to capture seasonality in the data (seasonality).
Notes for Appendix 1: Errors in the single-source framework:
This refers to data units and could be events, transactions, persons, households, firms or other entries in an admin dataset.
This refers to the measures or variables that have been collected that relate to the data objects/units
15. Appendix 2: Longitudinal error
Longitudinal error – applies to both single-source events and multisource longitudinal datasets.
Objects1
Attrition
The loss of research objects or units over time. Occurs naturally, through death (or an unobserved migration). Also occurs through failure of follow-up, a refusal to take part, in the case of survey data, or through missing information or linkage failure, in administrative sources.
Periodicity/seasonality error
Objects are not observed because the data capture is not frequent enough (periodicity) nor adequate to capture seasonality in the data (seasonality).
Attributes2
Censoring
Where the value of a measurement or observation is only partially known. Right censoring is when the research object drops out of the data before the end of the observation window or does not experience the event of interest during the observation window. Left censoring is when the event of interest has already occurred, before the observation window begins.
Periodicity/seasonality error
Measurement of attributes over time are not frequent enough (periodicity) nor adequate to capture seasonality in the data (seasonality).
Notes for Appendix 2: Longitudinal error:
This refers to data units and could be events, transactions, persons, households, firms or other entries in an admin dataset.
This refers to the measures or variables that have been collected that relate to the data objects/units
16. Appendix 3: Errors in the multiple-source framework
Multiple-source errors.
Objects1
Frame error:
Coverage error
Observing objects that are not in the target linked data, or not being able to access objects that are in the target linked data.
Timing differences
Objects are not observed due to conceptual discrepancies in the timing of the capture between the target linked data and source data.
Coverage error:
Coverage error
Objects are not linked due to discrepancies in the coverage of objects between data sources.
Timing differences
The difference between observed objects in source datasets due to the data being captured at different times.
Linkage error
Errors arising from linking objects together incorrectly (false positive error) and failing to link objects together that should have been linked (false negative error).
Identification error:
Linkage selection error (bias)
Errors arising from the selection of linked objects (or de-selection of unlinked objects) due to biases in the linkage, or through error in the resolution of conflicting links.
Processing error:
Imputation error
Errors arising from the imputation of missing objects.
Filtering error
Errors arising from the selection or de-selection of accessed objects to an ideal target set.
Attrition:
The loss of research objects or units over time. Occurs naturally, through death (or an unobserved migration). Also occurs through failure of follow-up, a refusal to take part, in the case of survey data, or through missing information or linkage failure, in administrative sources.
Periodicity/seasonality error:
Objects are not observed because the data capture is not frequent enough (periodicity) nor adequate to capture seasonality in the data (seasonality).
Attributes2
Relevance error:
Relevance error
The differences between ideal measurement of attributes sought about an object and the operational measures used to collect it in each source dataset.
Timing differences
A conceptual discrepancy in the timing of the measurement of attributes between the target linked data and the source data.
Mapping error:
Definitional differences
The differences between how attributes are operationally measured in each of the source datasets.
Timing differences
The differences between the values of attributes for a linked object between source datasets caused by the data being captured at different times.
Comparability error:
Alignment error
Errors arising from the alignment of the conflicting values of attributes across sources.
Processing error:
Editing error
Errors arising from editing the value of an attribute. This could include editing as a result of validation or QA checks.
Imputation error
Errors arising from the imputation of missing attribute values.
Classification error
Errors arising from classification of values into groups or derivation of new attributes.
Harmonisation error
Errors arising from the harmonisation of values of attributes to an ideal or target concept.
Censoring:
Where the value of a measurement or observation is only partially known. Right censoring is when the research object drops out of the data before the end of the observation window or does not experience the event of interest during the observation window. Left censoring is when the event of interest has already occurred, before the observation window begins.
Periodicity/seasonality error:
Measurement of attributes over time are not frequent enough (periodicity) nor adequate to capture seasonality in the data (seasonality).
Notes for Appendix 3: Errors in the multiple-source framework:
This refers to data units and could be events, transactions, persons, households, firms or other entries in an admin dataset.
This refers to the measures or variables that have been collected that relate to the data objects/units.